City, University of London Institutional Repository
Citation
:
Lasfer, M. and Hoque, H. (2015). Directors' Dealing and Post-IPO Performance. European Financial Management, 21(1), pp. 178-204. doi:10.1111/j.1468-036X.2013.12013.x
This is the accepted version of the paper.
This version of the publication may differ from the final published
version.
Permanent repository link: http://openaccess.city.ac.uk/11866/
Link to published version
:
http://dx.doi.org/10.1111/j.1468-036X.2013.12013.xCopyright and reuse:
City Research Online aims to make research
outputs of City, University of London available to a wider audience.
Copyright and Moral Rights remain with the author(s) and/or copyright
holders. URLs from City Research Online may be freely distributed and
linked to.
1
Insider Trading and the Long-run Performance of IPOs
Hafiz Hoquea and Meziane Lasferb*
a School of Business and Economics, Swansea University, Singleton Park, Swansea, SA2 8PP, Wales, UK
b Cass Business School, City University London, 106 Bunhill Row,
London EC1Y 8TZ, UK
Forthcoming European Financial Management
Abstract:
We use a unique dataset to assess whether IPOs where insiders change their holdings have different long-term returns. We find that IPOs where insiders are net sellers are more likely to generate positive long-run returns, while those where they are net buyers underperform. The analysis of individual trades shows that insiders sell when their IPO reaches its optimal value as the excess returns are positive in the pre-event and not significant in the post-event period. For the buy trades the returns are negative in both the pre- and post-trade periods, suggesting that insiders buy to support the price of their IPO, but the post-event returns are not as expected. These results imply that insider trading is a response to firm’s past performance. The valuation uncertainty of IPOs and the specific motivations to trade weaken the precision of the information content of insider trading and its impact on IPO long-run returns.
Key words: Long run IPO performance, insider trades, London Stock Exchange, market
timing.
JEL Classification: G12, G14, G24.
*Corresponding author: email: [email protected] (Lasfer), Tel.: +44 20 7040 8634; Fax: +44 20 7040 8648, [email protected] (Hoque).
2
Insider Trading and the Long-run Performance of IPOs
1. Introduction
Previous studies show that IPOs generate no or negative excess returns in the long run. This
relatively low performance emanates from a combination of extreme differences of opinion
among investors, costly short selling, and small public floats on many IPOs.1 In this paper,
we contribute to this extensive literature by assessing the characteristics of IPOs in which
insiders, defined as board members, are net buyers and net sellers, and whether their trades
are related to the long-run performance of IPOs. We address the following questions: Do
IPOs in which insiders are net sellers underperform relative to those in which they are net
buyers? If so, does this difference in performance occur before or after their trades, and
therefore, do insiders trade to respond to their IPOs’ past performance or to signal future
stock price performance? We construct a unique hand-collected dataset of 830 UK IPOs
containing all information from prospectuses and insider trading events, and we use relevant
accounting and stock price data, three-years after the IPO date, to answer these questions.
Studies on insider trading show that aggregate insider trading activity significantly
predicts future market returns, because insiders are likely to trade on private information and
to know better the true value of their firm than outside investors (e.g., Seyhun, 1998). For
example, Lakonishok and Lee (2001) form portfolios based on the net purchase ratio, NPR,
defined as insider net purchases over total transactions, and find that insider purchases, not
sells, are more likely to predict future stock returns, and insider trading informativeness is
more pronounced in smaller firms. In this paper we focus on the impact of NPR on the
long-run performance of IPOs. First, we compute the 36-months returns for each of our IPOs, and
then assess whether IPOs where insiders are net buyers (sellers) over this sample period
generate positive (negative) returns. We then analyse individual trades to assess whether this
3 In line with previous evidence on insider trading, we expect insiders to be contrarians
by buying shares if their IPO is underperforming, and selling if it is over-performing. On the
announcement date and post-trade period, share prices will increase for the buy and decrease
for the sell trades. Such results will be consistent with the proposition that insiders trade on
private information that may emanate from their assessment of the true value of their firm, or
subsequent news releases. This will imply that insiders reduce the IPOs’ inherent information
asymmetries, and, thus, their trades will affect the short- and long-run returns of their firm.
We find contrasting results to our expectations as IPOs where insiders are net sellers
(Net Sell) generate positive returns, while those where they are net buyers (Net Buy)
underperform substantially throughout the 36-months post-IPO period. We find similar
results using the style-adjusted, equal and value-weighted cumulative abnormal returns, and
the Fama and French (1993) three-factor model. Our regression results provide further
support for these results, as the coefficient of NPR, defined in terms of trading volume or
value, is negative and significant, suggesting that Net Sell (Net Buy) IPOs generate positive
(negative) long-run returns, even after accounting for all the IPOs’ fundamental factors.
We investigate further the causality of our results, the drivers of this asymmetric
performance, the timing ability of insiders, and the information content of insider trading, by
assessing the market reaction to each individual trade. We find that the pre-sell trades’ excess
returns are positive and significant. On the announcement date, share prices decrease, but, in
the post trade period, they are mainly not significant, suggesting that insiders time their trades
by selling when they know that the price of their IPO is stabilised with no more gains to
achieve. In contrast, for the buy trades, we find significant negative excess returns in the pre-
and post-event periods. While the buy trades of insiders in failing IPOs may be consistent
with the price support hypothesis,2 our results indicate that this aim is not achieved as the
post-trade returns are not positive. Overall, our results suggest that insider trading is likely to
4 The analysis of insiders’ trading patterns shows that the trades are not clustered
around the lockup expiry dates; they are relatively evenly distributed across the 36 months
sample period as the median number of years from the IPO date to the trading date is 1.45
years for both the Net Buy and Net Sell samples. When we split our sample period into two
subsamples: months 2 to 18 and months 19 to 36, we show that the excess returns of Net Sell
IPOs are positive in the first period, but not significant in the remaining months, but for the
Net Buy IPOs, they are negative in both sub-periods. Since at the time of the IPOinvestors
cannot separate firms on the basis of subsequent insider trading, which, according to Hoque
and Lasfer (2011) cannot be predicted even during the lockup period, we account for any
look-ahead bias in our results by analysing the long-term returns from the trading rather than
the IPO date. We find similar event study results, and the portfolio of Net Sell (Net Buy) IPOs
earns positive (negative) alphas in the Fama-French calendar time 3-factor regressions. Our
results imply that insiders respond to past performance and do not trade on insider
information, although, in line with previous studies, they are contrarians, and Brennan and
Cao (1997) argue that contrarian investors are likely to trade on insider information.
Why do insiders adopt such strategies? Our results could simply imply that, in line
with the disposition effect in behavioural finance, insiders may exhibit a tendency to sell
winners and hold on to losers for too long, because realising profits allows them to maintain
self-esteem, but realising losses causes them to admit failure implicitly. While this may
remain a possibility, we are not aware of other means of testing further this hypothesis.3
Instead, we provide alternative explanations for our results which may be specific to IPOs.
Huddart and Ke (2007) argue that the impact of insider trading depends on two fundamental
factors: the precision of the insider’s information and the level of uncertainty in the
marketplace regarding the firm’s value. We consider that, in the case of IPOs, there is great
uncertainty about the value of the firm, and the information of insiders is likely to be less
5 stock prices around the buy trade which appears to be a weak signal, unlike that in seasoned
firms. Nevertheless, we find that Net Buy IPOs perform better than No Trade IPOs,
suggesting that the former IPOs could have had a worst performance without the buy trades
of insiders. On the other hand, Net Sell IPOs are likely to have low information asymmetries
as they perform well before the sell trades. Their signal is also weak as the post-trade returns
are not negative, but the results suggest that these IPOs have reached their optimal valuation.
Our paper contributes to two main areas of research that are not so far considered
conjointly: IPO long-run performance and insider trading. Although investors cannot predict
at the time of the IPO the decision by insiders to trade, we show that these trades are affected
by the IPOs’ long-run returns, but not by the previously documented factors that affect the
long-run returns such as underpricing (Morris, 1996; Jenkinson and Ljungqvist, 2001),
overhang (Mikkelson et al., 1997), reputation of underwriters (Carter and Manaster, 1990),
venture capitalist (Brav and Gompers, 1997, Krishnan et al, 2011), and private equity backing
(Levis, 2011). Our results may be specific to IPOs as they do not indicate that insider trading
mitigates the information asymmetry as is the case for seasoned firms (See Korczak et al
(2010) for recent review), and they also do not support Marin and Oliver (2008) who find that
insiders sell up to 12 months before large monthly price drops, but buy one month before a
large price jumps, and Jiang and Zaman (2010) who show that insiders’ ability to predict
future cash flow news, rather than their adoption of contrarian strategies, explains the
predictive ability of their aggregate trades. Nevertheless, the behaviour of share prices in the
pre-event period is consistent with the theoretical work of Cespa (2008) who shows that
insiders are likely to trade on long-lived information and they control the flow of information.
The rest of the paper is structured as follows. Section 2 reviews the literature and sets
up the hypotheses. Section 3 presents a discussion of our data and the methodology. Section 4
6
2. Review of the Literature and Hypotheses Tested
2.1. Review of the literature
In theory, IPOs are expected to generate positive long-term returns for a number of
reasons. First, they are usually more risky than the average market, indicating a high
exposure to market risk.4 Second, the asymmetric models, particularly the signalling theories
that relate the long-term performance to the first day returns, suggest that IPOs underprice on
purpose to subsequently be able to sell further shares at a higher price, and as a result, the
long-run returns should be high. If firms underprice to signal their high quality, they should
perform better than low quality firms (Jenkinson and Ljungqvist, 2001). Similarly,
Benveniste and Spindt (1989) develop a book building model under which underpricing
compensates better-informed investors for truthfully revealing their information before the
issue price is finalized, thus reducing the expected money left on the table. These investors
may reveal a noisy signal, which indicates the direction and extent of the revision in the offer
price relative to the price range, and may result in subsequent performance to correlate
positively with the initial price revision.
The empirical evidence provided to date is mixed. Some studies report that IPOs
underperform various benchmarks for the first few years after offering.5 For example, Ritter
and Welch (2002) show that the three-year abnormal underperformance of US IPOs listed in
1980-2001 is -23%, with -34.3% in the later period of 1999-2000. Brav and Gompers (1997)
report alpha from the regressions of Fama and French (1993) of -0.49. This
underperformance is also observed in other countries (e.g., Schuster (2003) in Europe, and
Levis (1993, 2011), Espenlaub et al. (2000), and Goergen et al. (2007) in UK).
However, other studies show that this long-run underperformance depends on the
sample period, statistical methodology, and may suffer from econometrics misspecifications.
Eckbo et al (2007) report significant underperformance of IPOs relative to matched firms of
value-7 weighted returns are used, the difference is not significant. Similarly, Brav, Geczy and
Gompers (2000), and Eckbo and Norli (2005) report insignificant differences in buy and hold
returns between IPOs and size and book-to-market matched control firms. They also report
insignificant alpha based on variants of Fama and French (1993) model. Ritter and Welch
(2002) find underperformance of only -5.1% using the style adjusted returns methodology,
but decreasing to -61.2% in 1999 to 2000. Using the Fama and French (1993) factor model,
they show that the sign and significance of alpha, which measures the excess performance,
depend on sample periods and on the inclusion of lagged values of the factors. Brav and
Gompers (1997) find that IPOs appear to overperform relative to size, book-to-market, and
Fama and French industry portfolios. However, for non-venture-backed IPOs, the Fama and
French (1993) three-factor regression model results in negative alphas, particularly for small
and medium sized IPOs. Brav et al. (2000) find that post-issue IPO returns are similar to
those of firms with similar size and book-to-market characteristics and they co-vary with
similar non-issuing firms. Levis (2011) shows that, in the UK, while the equally weighted
returns are not significant, the value weighted are negative and significant and the Fama and
French (1993) coefficients are also not homogeneous across the equally- and value-weighted
returns. He also shows significant positive performance for private-equity backed IPOs, but
negative for non-backed IPOs.
Notwithstanding the methodological issues reviewed in Fama (1998)6 and Ritter and
Welch (2002), the past literature offered a number of explanations for the long-run
under-performance of IPOs. Morris (1996), Ritter (1991) and Rajan and Servaes (1997) among
others, argue that with costly short selling and heterogeneous beliefs among investors at the
time of the IPO, investors are over-optimistic about the growth prospects of the company,
resulting in initial overpayment. Aggarwal and Rivioli (1990) argue that there are fads in the
IPO market as firms go public at the time when investors are over-optimistic about growth
8 market. Subsequently, as more information becomes available and investor sentiment
changes, they mark prices down. Ljungqvist (1996) argues that the greater the fraction of
equity capital initial owners retain at floatation, the lower their incentive to take advantage of
over-optimistic investors, since the value of their retained shares would fall as and when new
investors become less optimistic, resulting in an increase in the long-run returns with the
retention rate. Ritter (1991), Lerner (1994), Loughran and Ritter (1995, 2000), Baker and
Wurgler (2000) and Hirshleifer (2001) extend these behavioural explanations and suggest
that stock prices periodically deviate from fundamental values and managers and investment
bankers take advantage of overpricing by selling stock to overly optimistic investors. Overall,
under these arguments, the long-term returns emanate from high divergence of opinion
raising the initial market price, and this disagreement declines over time, and the valuation by
the marginal investor comes closer to that of the average investor.
Other studies relate the long-term returns to IPO fundamentals. For example, Eckbo et
al. (2000) show that leverage is significantly reduced following equity offerings, while
liquidity is increased, resulting in a reduction in risk. As a result, IPOs are less sensitive to
interest and inflation shocks and require lower liquidity premium than benchmark firms, and
thus, should have lower returns. Ibbotson (1975) reports a negative relation between initial
returns at the IPO and the long-run share price performance. In terms of agency costs,
Mikkelson et al. (1997) show that the long-run returns are unrelated to ownership structure,
but Jain and Kini (1994) find a positive relation between post-IPO operating performance and
equity retention by original shareholders. Other studies find that large IPOs (Brav et al.,
2000), backed by venture capitalists (Brav and Gompers, 1997), or private equity firms
(Levis, 2011), and underwritten by prestigious underwriters (Carter et al., 1998, Krishnan et
al, 2011) underperform less, while those with wide initial spread, a late opening trade, and a
high proportion of institutional flipping, have lower returns (Houge et al., 2001). Carter et al
9 In terms of insider trading, previous studies document that insiders are contrarians,
but focus more on the association between insider trading and subsequent stock returns.
Seyhun (1986) shows that insiders are net buyers in small firms and net sellers in large firms
and larger insider trades are associated with higher subsequent abnormal returns. Frankel and
Li (2004) find that financial statement informativeness and analyst following reduces the
impact of insider trade on subsequent returns. Lakonishok and Lee (2001) find that the
impact of insider trading on stock returns is limited to small firms. Aboody and Lev (2000)
use research and development (R&D) expenditure as a proxy for the information asymmetry
between insiders and investors, to find a higher market reaction on the announcement date of
insider trades for high R&D firms. Other studies that focus on individual insider trades also
report that insider trading is informative and results in more efficient prices that reflect public
as well as private information (e.g., Meulbroek (1992), Cornell and Sirri (1992) and
Chakravarty and Mcconnell, 1999). However, Hubbart and Ke (2007) find only two measures
of information asymmetries, R&D expenditures, and the median absolute abnormal return
over past earnings announcements to affect the information content of insider trading, but not
institutional ownership, analyst following, book-to-market ratio, and the frequency with
which the firm reports losses. Ofek and Yermack (2000) show that stock-based compensation
does not drive insider trading, and their results are consistent with portfolio rebalancing rather
than the exploitation of private information. Clarke et al (2001) show that insider selling
increases prior to seasoned equity offerings that are completed and cancelled, but declines
afterward only for cancelled offerings, suggesting that insiders issue overvalued equity, and
cancel the issue when the market reaction to the announcement eliminates the overvaluation.
As far as we know, no previous study focuses on the joint relationship between these
two trends in the literature. We assess in this paper the link between insider trading and IPO
10 2.2. Testable Hypotheses
Overall, previous studies suggest that IPOs underperform because of high information
asymmetries (Ritter and Welch, 2002). Since other studies show that insider trading conveys
information, we expect such trades to mitigate the information asymmetry inherent in IPOs,
and thus, to affect the long-term performance of IPOs, for a number of reasons. Insiders are
likely to trade prior to information releases and/or if their company is mispriced. The former
is tightly regulated, but various studies show that insiders do trade before material
information is released (e.g., Korczak et al., 2010). We focus more on the second motivation
as our concern is more on the long-term returns. We consider that when insiders have a
higher information advantage, the abnormal return following their buy (sell) trades should be
higher (lower). Given the great uncertainty about the value of their IPOs, insiders are likely to
benefit from their trades if they hold perfect information, suggesting that insiders will only
affect stock prices if they hold precise and credible information, and if outsides have lower
information about the value of the IPO.
The second factor that might affect the impact of insider trading on the IPO
performance is the level of competition in the market. Grossman and Stiglitz (1980) develop
the price-taking model where individuals can trade any amount without altering the price at
which the trade takes place, while Kyle (1985) shows that, under imperfect competition,
insiders will influence prices. Huddart and Ke (2007) argue that, in the case of insider
trading, both these models predict that higher information asymmetry leads to more positive
(negative) abnormal returns following buy (sell) trades, and, thus, higher returns to insiders.
In this paper, we expand this literature in several ways. We test the hypothesis that
insider trading increases stock price accuracy and discovery in the long-run by mitigating the
relatively significant information asymmetries inherent in IPOs, thus leading to a more
efficient long-run pricing. We use Lakonishok and Lee’s (2001) net purchase ratio, NPR,
11 in our IPOs. We expect NPR to explain further the long-run returns of IPOs. In particular, if
insiders trade on private information, we expect IPOs where insiders are net sellers to
generate negative returns, while IPOs where they are net buyers to have positive returns.
Since insider trading cannot be predicted at the time of the IPO (Hoque and Lasfer, 2011),
investors cannot separate firms on the basis of subsequent insider trading. We alleviate this
shortcoming by running calendar time regressions with the 3-factor model starting from the
date of the trade rather than the IPO date. We expect the alpha of the buy (sell) trade
portfolios to be positive (negative) and significant. This stock price behaviour will also be
consistent with the agency theory framework (Jensen and Meckling, 1976) because insider
buy (sell) trades will lead to lower (higher) agency conflicts. In this case, we expect this
impact to be higher in IPOs with high potential agency conflicts, i.e., those with low insider
ownership (overhang, shares locked), institutional ownership, underpricing, prestigious
underwriters and venture-capitalist backing.
However, long-term performance could be the cause rather than the effect of insider
trading. Previous studies (e.g., Lakonishok and Lee, 2001; Jenter, 2005) assert that insiders
are contrarian investors as they tend to buy (sell) after negative (positive) price performance.
If the post-trade returns do not revert, then we can conclude that the long-term returns that
affects insider trading, rather than the reverse. We test this causality by analysing the average
cumulative returns before their trades. The UK market is ideal for such analysis as insiders
are required to inform their company and the market within a maximum of five days of
trading, and such announcements are immediately disclosed in the Regulatory News Service.7
We, thus, expect IPOs where insiders sell (buy) to generate positive (negative) excess returns.
However, insiders may trade for other than private information reasons, such as
liquidity and portfolio rebalancing considerations. In IPOs, they could also trade after lockup
expiry date, but this will apply to only sell, not buy, trades. In this case, we expect weak or no
12
3. Data and Methodology
We first gather the list of IPOs that went public in the London Stock Exchange,
(LSE), in both the Main market and the Alternative Investment Market (AIM), a relatively
less regulated market for smaller and younger companies, between January 1999 and 2006
from the LSE website. We find 1,117 IPOs. We use the LSE database to collect data on the
quotation market (AIM or Main market), admission date, country of incorporation, issue
price, market value, money raised, name of the broker, and for AIM IPOs, the advisor. We
then download all prospectuses from Perfect Filings database and hand-collect all
information relating to lockup arrangements, including lockup dates, percentage of shares
locked-up, fraction of insider shares locked up, directors’ ownership before and after the IPO,
percentage sold at the time of the IPO, institutional ownership, and venture capital backing.
We extract any delisting dates, other accounting, and stock market data, which include daily
stock prices and indices to compute the stock returns, market capitalization, which we use as
proxy for size, accounting return on assets to measure profitability, and price-to-book ratio to
proxy for growth from DataStream. We exclude 77 IPOs for which we could not find the
prospectuses, 15 with missing share price data, and 195 with no lockup date or ownership
data from the prospectuses. Our final sample includes 830 (74%) firms with complete data.
We obtain information on subsequent raising capital in the form of seasoned equity issues
(SEOs) from London Stock Exchange, and then match it with our IPO sample to determine
how many IPO firms raise more capital within three years of IPOs. We also obtain M&A
announcement information from Thomson One Banker database. Then we match the M&A
sample with out IPO data to determine how many of them occur during three years of IPOs.
Finally, we use a Fifth database, Directors’ Deals, which records all the trades
undertaken by insiders in the UK market. The database includes news items on directors’
13 price, amount, and value, post-transaction holding, change in holding, name and position of
the insider, and announcement and transaction dates. We exclude a number of observations
not related to private information, such as exercise of options or derivatives, script dividends,
bonus shares, rights issues, awards made to directors under incentive plans or reinvestment
plans. We also exclude all directors’ transactions in investment companies. After this
screening, we obtain 36,943 insiders’ trades from the UK market. We check the data for
errors and exclude 2,952 (8%) trades as the difference in announcement and transaction date
is more than 5 days, the UK legal requirement (Korczak et al., 2010). Our final sample
includes 33,991 directors’ trades in 2,664 listed companies, split into 26,268 (77%) buy, and
7,723 (23%) sell trades. We, then, match all insider trading event dates with the dates of the
IPOs, and select all IPOs where insider trading occurs during the three-year period of IPO.
We find 287 firms without insider trading (35%) and 543 (65%) firms with at least one
insider trade during the 36 months period after IPO. We exclude 31 trades that occur on the
same day. We identify 791 sell trades in 231 IPOs and 2,102 buy trades in 480 IPOs. Finally,
we follow Lakonishok and Lee (2001) and define the Net Purchases Ratio, NPR, as:
Trades
Total
Sells
Purchases
NPR
We find 190 (35%) IPOs with negative NPR, referred to as Net Sell sub-sample, and
353 (65%) with positive NPR, classified as Net Buy sub-sample. We use both number of
transactions, NPR transaction, and value of the trades, NPR value. Overall, we expect
insiders to be net buyers in over-performing and net sellers in underperforming IPOs.
We use various methodologies to test our hypotheses. We first use the standard event
study methodology to compute the cumulative abnormal returns over 3 years after the first
month of the IPO. The abnormal returns are the monthly returns on each IPO less the return
on the Financial Times All Share Index, FTA, which is a more representative index as it
14
FTA for IPOs on the main market, and compute both the equally- and value-weighted CARs.
We also compute the style-adjusted CARs, and buy and hold returns, BHARs, following
Ritter and Welch (2002), as the difference between the returns on an IPO and a style-matched
firm, defined as the closest market capitalization and book-to-market ratio listed firm to our
IPO. We select the control firm only once, and if it is delisted prior to the IPO returns’ ending
date, we replace it with another matching firm on a point-forward basis. If the IPO is delisted,
we compute the excess returns up to the date of delisting. We also use the market model to
compute the abnormal returns over the event window [-40, +40] relative to the trading date, and
the lockup expiry date. The α and β are from the regression of the security returns against the
corresponding market indices, the AIM all share price8 and FTA, for AIM and main market
IPOs, respectively, over the period [-290, -41] trading days relative to each event date. Finally,
we estimate the Fama-French (1993) calendar time regressions, using Ritter and Welch
(2002) approach:
pt t t t t t t t t ft Mt t ft Mt t ft
pt R R R R R SMB SMB HML HML
R ( ) 1( 1 1) 1 1 1 1
where Rpt – Rft is the excess return over the risk free rate on a portfolio in time period t, RMt –
Rft is the market risk premium, with FTA as a proxy for RMt, and Rft the 3 months Treasury
bill rate. SMBtis the return on small firms minus the return on large firms, and HMLt is the
return on high book-to-market return minus the return of the low book-to-market portfolio.
We extract the relevant data for size and book-to-market indices from K. French data library:
http://mba.tuck.dartmouth.edu/pages/faculty/ken.french/data_library.html#International. We
compute β of our firms as the sum of βt and βt-1. We use similar method to assess our firm’s
exposures to SMB and HML factors. Under the signalling and agency theory hypotheses, we
15
We also relate CARs to NPR after controlling for other factors defined in the previous
literature, such as first day return, size, insider ownership (overhang), the underwriter
reputation, venture capitalist backing, abnormal returns on the lockup expiry dates, lockup
length, period dummies, and Seasoned Equity Offerings (SEO) to capture Myers and Majluf
(1984) effects. In addition to the direct proxy for the actual takeover obtained from Thomson
One Banker database, as discussed above, we follow Brar et al (2008) and define the takeover
probability as follows. We first build a two-way matrix by size and growth in turnover. We
consider that large and high growth firms are less likely to be subject to a takeover bid, and
thus assigned a value of zero. In contrast, those in small and low growth quadrant have a
higher probability of a takeover, and we assign them a value of one. We then classify firms in
the remaining two quadrants into yield groups: high yield IPOs have a higher probability,
and, thus take a value of one, while those with low yield have a value of zero.
Finally, we run logit regressions to determine the characteristics of the Net Sell and
Net Buy subsamples. In the first regression, the dependent variable is equal to one if IPO is in
Net Sell sub-sample, and zero for No Trade. We next compare Net Buy and No Trade
sub-samples. The last regression compares the Net Sell and Net Buy sub-samples. We use various
explanatory variables to capture the IPO fundamentals. We use size, as measured by the log
of market value of equity at the IPO date, to assess whether insider trading occurs in large,
thus, less risky firms. In addition, we include risk, as measured by the standard deviation of
the stock returns over the 36-months period, and first day underpricing. We use
market-to-book ratio, and CAR-40,-2 relative to trading dates, to assess whether insiders are contrarians.
We measure insider ownership structures using overhang, shares locked, and lockup lengths.
We also account for ownership of outsiders, including VC backing, and institutional holding.
Finally, we use takeover and SEO probabilities, to assess trading on insider information and
16
4. Empirical Results
4.1. Descriptive Statistics
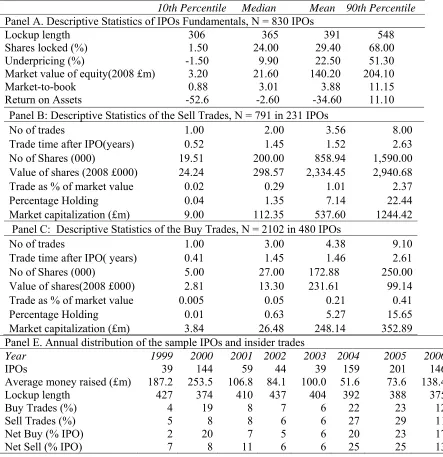
Table 1 provides the descriptive statistics of our sample firms. Panel A. reports the
mean, median, and 10th and 90th percentiles of a set of fundamental variables. The results
show that the average (median) length of the lockup is 391 (365) days, in line with Espenlaub
et al (2001) and Hoque and Lasfer (2011),9 and more than double that in the US, where, for
example, Brav and Gompers (2003) and Field and Hanka (2001) find median of 180 days.
Our IPOs offered 38.6% (32.9%) of their shares in the market, the mean (median) shares
locked amounts to 29.5% (24%) of the shares outstanding, and the level of underpricing of
22.5 % (9.5%) is consistent with previous evidence (e.g., Chambers and Dimson, 2009). The
analysis of the fundamentals indicates that, while the average market value of equity of our
firms is £140m (about $210m), our sample includes small as well as large firms. Consistent
with US evidence (e.g., Brav and Gompers, 2003), our IPOs are loss making as the average
(median) return on equity is -34.6% (-2.6%) and high growth as the average (median)
market-to-book ratio is 3.88 (3.01).
Panels B and C report the distribution of the buy and sell trades during the three-year
post-IPO period. On average, there are 3.56 sell and 4.38 buy trades, occurring roughly 1.5
years after IPO, suggesting that most of the trades occur after the lockup expiration date. The
results indicate, however, that the number and value of shares sold are significantly higher
than the buy trades; the value of shares sold of £2.3m is 10 times those bought of £0.23m. We
also observe this difference (1.01% vs. 0.21%) when we scale the value of the trades by
market capitalisation to account for size impact, as the average market value of IPOs subject
to buy trades of £248m is significantly lower than the £538m for the sell trade IPOs. Overall,
the buy trades are more frequent, but they are significantly smaller than the sell trades.
17 Panel E reports the annual distribution of sample IPOs and the lockup lengths.
Consistent with previous evidence (e.g., Chambers and Dimson, 2009), the volume of IPOs is
relatively high in the ‘Bubble’ periods of 2000, and 2004-2006, but 2001-2003 is a relatively
quiet period. The next row reports the distribution of the amount of money raised. IPOs
appear to be relatively larger in 1999 to 2000 period, with an average of £200m per issue,
compared to £88m in the post-2001 period. In terms of the length of the lockup, the results
show that the maximum of 437 days is in 2002 and the minimum of 374 is in 2000. However,
we note that the distribution is relatively homogeneous, and in each year, the average is
higher than 180 days documented in the US. The most interesting results relate to the annual
distribution of insider trades and the Net Sell and the Net Buy sub-samples, reported in the
last two rows. In total, there are 791 sell trades undertaken in 231 IPOs and 2,102 buy trades
in 480 IPOs. The results indicate that both the buy and sell trades are more frequent in
2004-2006, except for the 19% buy trades in 2000. In 1999, the total number of trades is 122, split
into 79 (4% of 2,102) buy and 43 (5% of 791) sell trades, while the respective trades in 2005
are 715, 475, and 240. We find a relatively similar frequency distribution when we analyse
the number of Net Buy and Net Sell IPOs. The frequency of both sub-samples peaked in
2004-2005 and declined slightly in 2006. During 1999-2003, only a small number of IPOs are
subject to insider trading activity, with the exception of the 166 IPOs (20%) in 2000. We
account for this time effect in our regressions.
[Insert Table 1 here]
4.2. The long-run performance of IPOs
Table 2 reports the long-run performance over various sub-periods after the IPO date.
We first report in Panel A. the raw buy and hold average returns (BHARs). However, Brav,
Geczy and Gompers (2000) argue that tests of underperformance based on buy-and-hold
18 the raw equally-weighted returns may result in biased long-term returns as they are not
compared to a benchmark and they may suffer from size effects. Furthermore, previous
studies using matching firm approach find that the underperformance disappears (e.g., Brav
and Gompers, 1997) or, at least, it shrinks (e.g., Ritter and Welch, 2002). We account for
these potential biases by reporting, following Ritter and Welch (2002), in Panel B and Panel
C the style adjusted BHARs and cumulative abnormal returns (CARs) where the
style-matched firm is the closest market capitalization and book-to-market ratio listed firm. In
Panel D and Panel E we compare equally weighted and value weighted CARs with α = 0 and
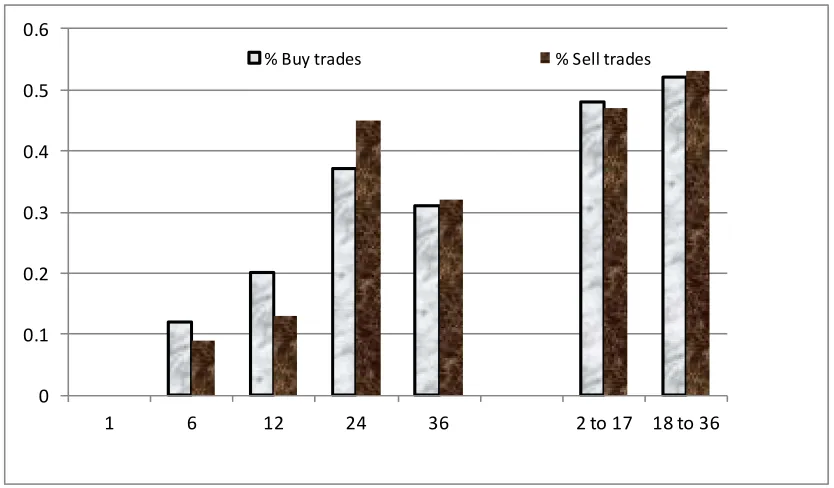
β = 1. Finally, the last column of Table 2 reports the cumulative abnormal returns over
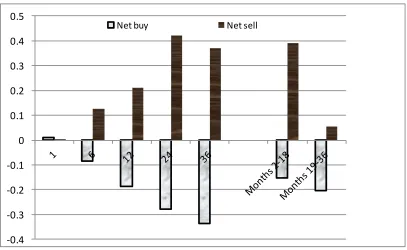
months 2 to 18, and 19 to 36 as Figure 2 shows that the periodicity of the 2,102 buy trades
and 791 sell trades are relatively evenly distributed cross these two sub-periods.
[Insert Figure 1 here]
Our results are relatively consistent across these different methodologies. Overall,
they indicate that the excess returns are not homogeneous across our sample firms. In
particular, the overall underperformance of our sample of IPOs appears to be driven by IPOs
without insider trading and Net Buy IPOs which underperform consistently across all our
sample period except the first few months of quotation, while Net Sell IPOs over-perform.
For example, the style-adjusted buy and hold excess returns (BHAR) reported in Panel B in
months 19 to 36 amount to -22.6% and -20.4% for the sample as a whole and Net Buy IPOs,
respectively, but -43.8% for IPOs with no insider trading. In contrast, the Net Sell IPOs
generate positive returns throughout the sample period, except the first month. We show
these results in Figure 1. Overall, our results suggest that these trades are less likely to be
informative, insiders are not trading on insider information, but they are likely to sell when
their IPOs reached their peak, and/or to stop the positive performance of their firms.
19 4.3. The timing of the excess returns
In this section, we assess whether the positive (negative) excess returns of Net Sell
(Net Buy) IPOs occur before or after the trades of insiders. We assess directly the market
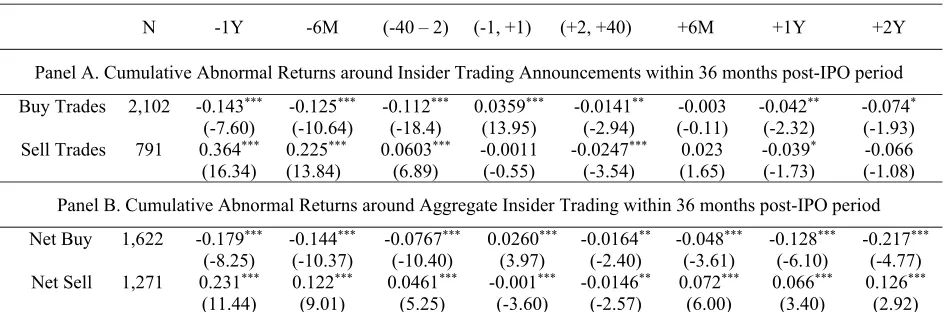
reaction around each individual buy and sell trade undertaken by insiders. Table 3, Panel A,
shows that on the announcement date of buy trades, share prices increase substantially by
3.59%, compared to the 1.16% reported by Fidrmuc et. al. (2006) for UK seasoned firms. In
the various pre-event periods, the CARs are all negative and significant, suggesting that the
trades occur when the IPO is underperforming. Interestingly, the post-event CARs are all
negative, suggesting that the positive signal of the buy trades is short-lived. For the sell
trades, the pre-event period CARs are positive and highly significant, but on the event and
post-event periods, they are not constantly negative and significant. These results suggest
that, consistent with previous insider trading literature (e.g., Seyhun, 1986), insiders adopt
contrarian strategies by buying (selling) after significant share price decreases (increases), but
the informativeness of these trades is weak, as stock prices do not increase (decrease) after
their buy (sell) trades. Although the negative announcement dates abnormal returns implies
that by selling shares insiders convey bad new to the market, in line with Brau and Fawcett
(2006), the impact is short lived. Our results also imply that since the returns in the period
before the sell trades are positive, insiders may have stopped the positive performance of the
IPO. Without such trades, returns may have carried on increasing, although they are small.
In Panel B, we aggregate these trades for Net Buy and Net Sell sub-samples. The
CARs for Net Buy sub-sample are all negative and significant, with the exception of the
positive returns of 2.60% on the announcement dates. In contrast, for the Net Sell sample, the
CARs are all positive, except for CAR-1,+1 and CAR+2,+40. However, the pre-trade CARs are
relatively larger than the post-trade CARs, suggesting that, in line with the last two columns
in Table 2, the pre-trade period is likely to drive the excess returns for the Net Sell sample.
20 4.4. Fama and French (1993) Results
We expand our robustness checks using the Fama-French (1993) regressions model.
In line with Table 2, we tested for robustness using various measures of excess returns. We
report only a subset of these results as they are relatively similar. Table 4, Panel A, reports
the results based on equally weighted returns. For the sample as a whole, α is negative and
significant and amounts to about -0.9% per month, equivalent to CAR1, 36 of -36% reported in
Panel A, Table 2. Interestingly, β, the sum of βt and βt-1 is 1.66, in line with Ritter and Welch
(2002) findings of 1.73. This magnitude of β is relatively homogeneous across all our
sub-samples, ranging between 1.45 for Net Buy and 1.66 for Net Sell samples. These results
suggest that IPOs have relatively higher risk and, therefore, they should generate positive
long-term returns. The results indicate that α is negative and significant for No Trade and Net
Buy IPOs. On the other hand, α of Net Sell IPOs is constantly positive and significant, reflecting the relative overperformance of these IPOs, in line with our findings in Table 2.
The remaining results show that the coefficients of SMB across all the subsamples
are relatively identical, and the lagged coefficients are predominantly insignificant. Similarly,
the coefficients of the lagged HML are not significant, but the coefficient of HML is more
negative for the Net Sell IPOs. The results based on value-weighted returns in Panel B, are
relatively similar. While α is not significant for the All IPOs, and No Trade IPOs, it becomes
positive and significant for Net Sell and negative and significant for Net Buy IPOs.
Our results so far may suffer from the look-ahead bias, because investors could not
separate IPOs on the basis of subsequent insider trading at the time of the IPO. Such trading
cannot be predicted even during the lockup period (Hoque and Lasfer, 2011). We, therefore,
assess the excess returns from the date of the buy and sell trades, rather than IPO date, to
allow investors to trade on such information. We run the Calendar time portfolio regressions.
21 trades, confirming that insiders earn negative returns on their purchases, but shares prices do
not decrease after sell trades, in line with the results in Panel A and Panel B.
[Insert Table 4 here]
4.5. The determinants of the long-run performance
The previous section indicates that insider trading affects significantly the long-run
performance of IPOs as Net Sell (Net Buy) IPOs generate positive (negative) excess returns.
In this section, we expand these results by running a set of regressions to assess whether this
difference in performance holds after controlling for IPO fundamentals. Table 5 reports the
cross sectional regressions results. Regressions (1-3) are with bubble and hot market
dummies and regressions (4-6) are with year dummies. As a measure of insider trading
activity in the IPOs we use net purchase ratio (based on number of transactions and value)
and a dummy variable for no insider trading. The last three columns replicate Regression (1)
for Net Buy, Net Sell and No Trade subsamples. Interestingly, all the three insider-trading
variables affect negatively the long-term performance. The negative coefficient of NPR
implies that IPOs where insiders are net buyers generate negative returns. Similarly, No
Trade dummy is negative and significant, suggesting that IPOs not subject to insider trading
underperform significantly more than their counterparts where insiders trade. These insider
trading variables have also increased the explanatory power of the regressions as previous
studies report relatively much lower R2 of 1 to 8% (e.g., Levis, 2011; Goergen, Khurshed and
Mudambi, 2007).10 Overall, our results suggest that insider trading is an additional and
significant explanatory variable of the long-run performance of IPOs.
The remaining explanatory variables expand the findings reported in previous studies.
For example, the relationship between long-run performance and Underpricing is negative
and significant in all our specifications, except in the Net Sell subsample, in line with
22 generate lower long-term returns, in contrast to the predictions of the signalling models
(Jenkinson and Ljungqvist, 2001). The variable Overhang is significant in (3) to (5), but not
in (6) and in the subsample IPOs. The results also indicate that Prestigious Underwriters and
the Venture Capitalists do not affect performance, in line with Levis (2011), but in contrast to
Krishnan et al (2011). Size is negative, but not significant, in contrast to Brav and Gompers
(1997) who show that underperformance is concentrated in small, non-venture
capitalists-backed firms. We also find a positive relationship between long-term returns and the lockup
expiry dates excess returns, suggesting that IPOs with high abnormal returns on the lockup
expiry dates are more likely to have higher long-term returns, as insider are unlikely to have
sold their holdings after the lockup, and, thus, lower agency conflicts. In addition, the Lockup
Length, High Tech, Bubble and Hot market dummies, affect negatively the long-term returns.
Levis (2011) report a negative, but not significant, coefficient for bubble dummy.
[Insert Table 5 here]
4.6 The determinants of insider trading in IPOs
The results in the previous sections highlight the controversy that IPOs where insiders
sell perform better that those where they buy. In this section, we expand this analysis by
assessing the likelihood of insider trading through univariate analysis, and by running a set of
logit regressions, in line with Hoque and Lasfer (2011) who focus on trading during the
lockup period. We contrast further the fundamental characteristics of IPOs in three different
samples: Net Sell vs. No Trade, Net Buy vs. No Trade, and Net Buy vs. Net Sell. Previous
studies consider that insiders trade for information and non-information reasons. While the
latter relate to liquidity and portfolio diversification, the former states that insiders are likely
to trade to take advantage of their foreknowledge of a particular major news announcement or
that they consider that their firm is mispriced in the market. Under the non-information
23 information, the excess stock returns on and after the trades should be significant. The
overwhelming past evidence finds that insiders do trade on private information (e.g., Seyhun,
1986; Korczak et al., 2010). The question is whether they trade shortly before news
announcements and violate insider trading rules, with potential regulatory scrutiny and
litigation, as well as potential political and reputational costs,11 or whether the abnormal
returns reflect insiders’ superior knowledge about their firms’ prospects, and their ability to
recognize pricing errors made by outside investors. In this later case, insiders are expected to
trade against the market sentiments.
We use SEO dummy and takeover dummy to proxy for trading on news releases.
Trading on mispricing suggests that insider know the value of their company and, as a result,
they tend to adopt contrarian strategies by buying (selling) stocks with poor (good) past
performance (e.g., Jenter, 2005; Lakonishok and Lee, 2001). To capture this effect, we use
the cumulative abnormal return 40 days before the trading dates, CAR-40,-2, and
market-to-book ratio, to assess whether insiders buy a stock when it is selling at a low valuation, and
sell it when it has a high valuation over a longer horizon.
However, other fundamental factors are also likely to affect such strategies. While
Peress (2010) reports that firm size affects trading propensity, Seyhun (1986) finds that
insiders are more likely to buy in small and sell in large firms. We use the natural logarithm
of market capitalization, defined as the IPO offer price times the number of shares offered. In
addition, previous studies also identified ownership as an additional factor that might affect
the propensity of insiders to trade. For example, Ofek and Yermack (2000) report that
executives with large shareholdings sell stock after receiving new equity incentives to
diversify their portfolios. We use shares locked, the lockup length, and the ratio of shares
retained to shares sold, Overhang, to account for this potential effect. We control for outside
ownership by including in our regressions institutional ownership and venture-capital
24
more risky companies tend to sell equity more aggressively. We use Underpricing as a
measure of risk. Previous studies report that risky IPOs are underpriced more (see Ljungqvist
(2007) for a review). Finally, we use Prestigious Underwriters to measure the power of
underwriters in the UK to initiate the trades,12 and market conditions.13
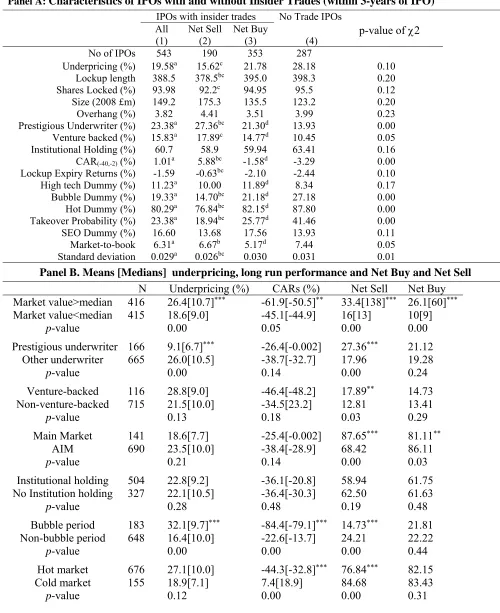
Table 6 reports the univariate analysis. The first column reports the results for all
IPOs with insider trading. Compared to No Trade sample, the results show that insiders are
more likely to trade in IPOs with low underpricing, standard deviation of returns, and
market–to-book, underwritten by prestigious underwriters, and backed by venture capitalists.
These IPOs also generate higher returns before the trade and on the lockup expiry date, are
high technology firms, but less likely to be issued in bubble period, and to be subject to a
takeover. These results appear to suggest that insiders are likely to trade in low risk IPOs.
Interestingly, the results also suggest that prestigious underwriters and venture capitalists
affect insider trading positively. Finally, consistent with the proposition that insiders do not
trade on private information, the probability of insider trading is significantly lower in the
IPOs with high takeover probability.
We then focus on differences between Net Sell, Net Buy, and No Trade samples. The
results indicate that Net Sell IPOs have lower lockup lengths and risk, more likely to be
underwritten by prestigious underwriters, higher pre-trade returns and lockup expiry returns,
less likely to be issued in bubble and hot periods, and less likely to be taken over than Net
Buy and No Trade sub-samples. In addition, they have lower underpricing and fraction of
shares locked, and less likely to be backed by venture capitalists, than the No Trade IPOs, but
a higher risk than Net Buy IPOs. Compared to the No Trade IPOs, the Net Buy IPOs are more
likely to be underwritten by prestigious underwriters and backed by venture capitalists, more
likely to be high tech but less likely to be issued in hot period or to be taken over. They also
generate relatively higher returns before the trades, CAR(-40,-2), but they have low
25 insiders sell in IPOs with relatively shorter lockup lengths and a smaller proportion of shares
locked, but they appear do undertake their trades after the lockup expiry date, as the abnormal
returns on that date are significantly lower than the remaining IPOs. In addition, they have
the best underwriters, have low risk and generate highest returns, suggesting that the
underwriters are likely to be happy for them to sell, as the usual negative signal of sell trades
is likely to be small. In contrast, the Net Buy IPOs have strong underwriters, but more risky
and generate low returns before the trade and their low market-to-book ratio suggest that they
are undervalued. These results imply that insiders buy stocks probably to support the decrease
in price. Contrary to Seyhun (1986), our results do not suggest that insider buy in small IPOs.
Panel B reports the distribution of Underpricing, CARs (36 months equal weighted),
and the proportion of Net Buy and Net Sell IPOs, by fundamental factors. The results indicate
that underpricing is higher in large firms, in line with Brav and Gompers (2003) and Levis
(2011), and in IPOs issued in the bubble period, but it is lower in IPOs underwritten by
prestigious underwriters and not affected by institutional holding, venture capitalists backing,
market of quotation, and hot period. The results for the long-term returns (CARs) are
relatively similar, except that prestigious underwriters is not a factor, but IPOs issued in hot
period have lower long-run returns. The last two columns provide additional analysis of our
IPOs in the Net Buy and Net Sell subsamples. The results indicate that insider trading in both
the Net Buy and Net Sell IPOs occur mainly in larger firms, and that Net Sell IPOs are likely
to be underwritten by prestigious underwriters, backed by venture capitalists, and quoted in
the main market, but less likely to be issued in bubble period and in cold market. In contrast,
Net Buy IPOs are relatively homogeneously distributed across these characteristics, but unlike
Net Sell IPOs, they appear to occur more in IPOs quoted on AIM than on the Main Market.
26 Table 7 reports the logit results. All regressions include year dummies.14 For each
group, we run two regressions to account for any multicollinearity, particularly between Size
and Prestigious Underwriters. In equation (1) and (2), we assess the probability that insiders
are net sellers by comparing Net Sell IPOs, set equal to 1, against No Trade IPOs, equal to 0.
The results indicate that the pre-trade stock price performance affect significantly the
decision to sell rather than not to trade, in line with previous insider trading literature (e.g.,
Seyhun, 1986; Korczak et al., 2010). The positive and significant coefficient of CAR (-40,-2)
suggests that insiders sell in IPOs with significant increase in share prices, 38 trading days
before the trade. These results are consistent with the notion that insiders adopt contrarian
strategies in their sell trades. However, they appear to suggest that insiders are more
concerned with the short-term run up in share prices rather than the long-term valuation of
their IPO, as the coefficient of market to book, MB, is not significant. Insiders are also more
likely to sell in large firms, and those backed by venture capitalists. Although these results
suggest that insiders sell in less risky firms, the coefficient of the standard deviation of
returns, σ, is negative and not significant. The coefficient of the takeover probability is
negative and significant, suggesting that insiders are less likely to sell on private information
for fear of litigation, political and reputational risks. In Equation (2), we report the results
based on non-correlated variables, which are relatively similar, except that the coefficient of
Prestigious Underwriters is now positive and significant.
Equations (3) and (4) report the results of Net Buy, relative to No Trade. Interestingly,
while the coefficient of CAR is not significant, that of market to book, MB, is negative and
significant, consistent with Lakonishok and Lee (2001) and Jenter (2005), and suggesting that
insiders buy stocks if they consider that their firm is undervalued in the long- not short-run.
In addition, unlike Net Sell IPOs, firm size is positive but not significant. However, in line
with the first two columns, the results indicate that insiders are less likely to buy when the
27 Equations (5) and (6) report the probability of Net Buy vs. Net Sell. The results are
relatively similar to the univariate findings in Table 5. In particular, the CAR (-40,-2) of Net
Buy IPOs are significantly lower than those of Net Sell IPOs, confirming the contrarian
strategies adopted by insiders. Net Buy IPOs are also smaller than Net Sell IPOs. Surprisingly,
insiders in these IPOs have already a large proportion of their holdings locked and the lockup
length is significantly longer than the Net Sell IPOs. The remaining variables are relatively
similar across the two samples.
Finally, Equation (7) reports the multivariate logit regression results where the
dependent variable is equal to 2 for Net Sell, 1 for Net Buy, and 0 for No Trade IPOs. The
results show that the pre-trade CARs are positive and significant, suggesting that these CARs
are significantly higher for the Net Sell IPOs. These IPOs are also more likely to be backed
by venture capitalists, and to be significantly larger than the other IPOs. In contrast, they have
lower proportion of shares locked, lower probability of takeover and market-to-book ratio.
[Insert Table 7 here]
5. Conclusion
We find strong relationship between insider trading and the long-run returns of IPOs.
As far as we are aware, our paper is unique, as previous studies did not consider these two
issues simultaneously. We show that UK IPOs underperform in the long-run, in line with
previous UK and international studies, but those where insiders are net sellers generate
substantial positive returns of 23.9% excess returns relative to size, and book-to-market
matched firms, and their Fama and French (1993) alpha coefficients are constantly positive.
In contrast, IPOs where insiders are net buyers and/or are not subject to insider trading have
negative returns. Our results hold when we use the event study methodology to analyse
short-term returns and the various methodologies to assess long-short-term returns, and when we account
28 Our results may be consistent with the disposition effect developed in the behavioural
finance literature, and they may also reflect the valuation uncertainty underlying IPOs. Since
the excess returns are not negative after the sell trades, but they are negative in both the pre-
and post-buy trade periods, our results imply that, unlike seasoned firms, the signalling role
of insider trading in the case of IPOs is weak and that insiders time their trades and sell when
they know that their IPO reached its peak, with no excess returns remaining, while they buy
to support the price but the market does not value positively such trades. Our results suggest
that in the context of IPOs, the signal of insiders is not likely to be too precise as the level of
uncertainty in the marketplace regarding the value of the IPO is high. As a result there is no
transfer of wealth from uninformed to informed investors. We also show that insider trading
in IPOs is less likely to be driven by portfolio risk diversification as the propensity to trade is
not affected by firm’s risk, the buy (sell) trades do not necessary occur in small (large) firms,
and that insider trading propensity is not affected by managerial ownership, unlike previous
evidence of Meulbroek (2000), Seyhun (1986) and Ofek and Yermack (2000), respectively.
However, we are unable to assess further the disposition effect explanation because of lack of
data and appropriate methodology. The data is also not available to assess further the
information content of insider trading, the trading of insiders before news announcements, as
in Korczak et al (2010), the impact of private equity-backed IPOs, as in Levis (2011), and the
direct link between corporate brokers in the UK and trading by insiders, and the trading by
insiders in the derivatives market to avoid the potential scrutiny by the regulators. The extent
29
References
Aboody, D., and B. Lev. 2000. Information asymmetry, R&D, and insider gains, Journal of
Finance 55 (6): 2747–2766.
Aggarwal, Reena and Pietra Rivioli, 1990, Fads in the initial public offerings market?
Financial Management 19, 45-57.
Baker, Malcolm and Jeffrey Wurgler, 2000, The equity share in new issues and aggregate
stock returns, Journal of Finance 55, 2219-2257.
Barberis, Nicolas and Richard Thaler, 2003. A survey of behavioural finance. In G.
Constantinides, M. Harris, and R. Stultz (eds), Handbook of the Economics of
Finance (pp. 1053-1123). (North Holland, Amsterdam: Elsevier Science).
Benveniste, Lawrence M, and Paul A. Spindt, 1989, How investment bankers determine the
offer price and allocation of new issues, Journal of Financial Economics 24,343-361.
Brar Guvinder, Daniel Giamouridis, and Manolis Liodakis, 2008, Predicting European
takeover targets, European Financial Management 15, 430-450.
Brau, James C., and Stanley E. Fawcett. 2006. Initial public offerings: An analysis of theory
and practice, Journal of Finance 61, 399-436.
Brav, Alon and Paul A. Gompers, 1997, The long run underperformance of initial public
offerings: evidence from venture and non-venture capital-backed companies, Journal
of Finance 52, 1791-821.
Brav, Alon, and Paul A. Gompers, 2003, The role of lockups in initial public offerings,
Review of Financial Studies 16, 1-29.
Brav, Alon, Geczy, C and Paul A. Gompers, 2000, Is the abnormal return following equity
issuance anomalous, Journal of Financial Economics 56(2), 209-49.
Brennan, Michael J., and Henry H. Cao, 1996, Information, trade, and derivative securities,
30 Carter, Richard B. and Steven Manaster, 1990, Initial public offerings and underwriter
reputation, Journal of Finance 45, 1045-1067.
Carter, Richard B., Frederick H. Dark and Ajai K. Singh, 1998, Underwriter reputation,
initial returns and the long-run performance of IPO stocks, Journal of Finance 53,
285-311.
Carter, Richard B., Frederick H. Dark, Ioannis V. Floros, and Travis R. A. Sapp, 2011,
Characterizing the risk of IPO long-run returns: the impact of momentum, liquidity,
skewness, and investment, Financial Management, 40, 1067–1086.
Cespa, Giovanni, 2008, Information sales and insider trading with long-lived information,
Journal of Finance 63, 639-672.
Chakravarty, Sugato, and John J. McConnell, 1999, Does insider trading really move stock
prices? The Journal of Financial and Quantitative Analysis 34, 191-209.
Chambers, David, and Elroy Dimson, 2009, IPO underpricing over the very long run, Journal
of Finance 64, 1407-1444.
Clarke, Jonathan, Craig Dunbar, and Kathleen M. Kahle, 2001, Long-run performance and
insider trading in completed and cancelled seasoned equity offerings, Journal of
Financial and Quantitative Analysis 36, 415-430.
Cornell, Bradford and Eric R. Sirri, 1992, The Reaction of investors and stock prices to
insider trading, Journal of Finance 47, 1031-1059.
Derrien, Francois, and Ambrus Kecskes, 2007, The initial public offering of listed firms,
Journal of Finance 62 (1), 447-479.
Eckbo, B. Espen, Ronald Masulis and Oyvind Norli, 2000, Seasoned public offerings:
resolution of ‘the new issues puzzle’, Journal of Financial Economics 56, 251-291.
Eckbo, B. Espen, and Oyvind Norli, 2005, Liquidity risk, leverage and long-run IPO returns,
31 Eckbo, B. Espen, Ronald Masulis and Oyvind Norli, 2007, Security issuance, in B. Espen
Eckbo, ed.: Handbook of Corporate Finance: Empirical Corporate Finance, 1,
233-373 (Elsevier/North-Holland, Handbooks in Finance Series).
Espenlaub, Susan, Alan Gregory and Ian Tonks, 2000, Re-assessing the long term
performance of UK Initial Public Offerings, European Financial Management 6,
319-42.
Espenlaub, Susane, Mark Goergen. and Arif Khurshed, 2001, IPO lock-in agreements in the
UK, Journal of Business Finance and Accounting, 28(9) 1235-1278.
Fama, Eugene and Kenneth R. French, 1993, Common risk factors in the returns on stocks
and bonds, Journal of Financial Economics 33, 3-56.
Fama, Eugene, F., 1998, Market efficiency, long-term returns, and behavioral finance,
Journal of Financial Economics 49, 283-306.
Fidrmuc, Jana, Mark Goergen and Luc Renneboog, 2006, Insider trading, news release and
ownership concentration, Journal of Finance 61, 2931-2973
Field, Laura C. and Gordon Hanka, 2001, The expiration of IPO share lockups, Journal of
Finance 56, 471-500.
Finn, Frank and Ron Higham, 1988, The performance of unseasoned new equity
issues-cum-stock exchange listings in Australia, Journal of banking and Finance 12, 333-351.
Goergen, Marc, Arif Khurshed and Ram Mudambi, 2007, The long run performance of UK
IPOs: can it be predicted? Managerial Finance 33(6), 401-419.
Gompers, Paul and Josh Lerner, 1999, An analysis of compensation in the U.S. venture
capital partnership, Journal of Financial Economics 51, 3-44.
Grossman, Sanford J., and Joseph E. Stiglitz. 1980. On the impossibility of infromationally
32 Hillier, David, and Andrew Marshall, 2002, Are trading bans effective? Exchange regulation
and corporate insider transactions around earnings announcements, Journal of
Corporate Finance 8, 393–410.
Hirshleifer, David, 2001, Investor psychology and asset pricing, Journal of Finance 56,
1533-1597
Hoque, Hafiz and Meziane Lasfer, 2011, Why do insiders change their ownership during IPO
lockup arrangements?Working paper, Cass Business School, London.
Houge, Todd, Tim Loughran, Xuemin Sterling Yan and Gerry Suchanek, 2001, Divergence
of Opinion, Uncertainty, and the Quality of Initial Public Offerings, Financial
Management 30, No. 4, 5-23
Huddart, Steven and Bin Ke, 2007. Information Asymmetry and Cross-Section Variation in
Insider Trading, Contemporary Accounting Research 24, 195-232
Ibbotson, Roger G., 1975, Price performance of common stock new issues, Journal of
financial economics 2, 235-272.
Jain, Bharat .A. and Omesh Kini, 1994, The post issue operating performance of IPO firms,
Journal of Finance 49, 1699-726.
Jenkinson, Tim and Alexandar Ljungqvist, 2001, The Theory and Evidence on How
Companies Raise Equity Finance (Oxford: Oxford University Press).
Jensen, Michael and William Meckling, 1976, Theory of the firm: Managerial behavior,
agency cost and ownership structure, Journal of Financial Economics 3, 306-360.
Jenter, Dirk, 2005, Market timing and managerial portfolio decisions, Journal of Finance 60,
1903-1949.
Jiang Xiaoquan and Mir A. Zaman, 2010, Aggregate insider trading: Contrarian beliefs or
superior information, Journal of Banking and Finance 34, 1225-1236
Kaustia, Markku, 2004, Market-wide impact of the disposition effect: evidence from IPO