Rochester Institute of Technology
RIT Scholar Works
Theses Thesis/Dissertation Collections
7-30-2012
White-light optical vortex coronagraph
Prachyathit Kanburapa
Follow this and additional works at:http://scholarworks.rit.edu/theses
This Thesis is brought to you for free and open access by the Thesis/Dissertation Collections at RIT Scholar Works. It has been accepted for inclusion in Theses by an authorized administrator of RIT Scholar Works. For more information, please [email protected].
Recommended Citation
WHITE-LIGHT OPTICAL VORTEX CORONAGRAPH
by
Prachyathit Kanburapa
B.E. Chulalongkorn University
(2010)
A thesis submitted in partial fulfillment of the requirements for the degree of Master of Science in the Chester F. Carlson Center for Imaging Science
of the College of Science Rochester Institute of Technology
July 30, 2012
Signature of the Author
Accepted by
CHESTER F. CARLSON
CENTER FOR IMAGING SCIENCE
COLLEGE OF SCIENCE
ROCHESTER INSTITUTE OF TECHNOLOGY
ROCHESTER, NEW YORK
CERTIFICATE OF APPROVAL
M.S. DEGREE THESIS
The M.S. Degree Thesis of Prachyathit Kanburapa has been examined and approved by the
thesis committee as satisfactory for the thesis requirement for the Master of Science degree
Dr. Grover Swartzlander, Thesis Advisor
Dr. Zoran Ninkov, Committee
Dr. Mishkatul Bhattacharya, Committee
Abstract
An optical vortex is characterized by a dark core of destructive interference in a light
beam. One of the methods commonly employed to create an optical vortex is by using a
computer-generated hologram. A vortex hologram pattern is computed from the
interference pattern between a reference plane wave and a vortex wave, resulting in a
forked grating pattern. In astronomy, an optical vortex coronagraph is one of the most
promising high contrast imaging techniques for the direct imaging of extra-solar planets.
Direct imaging of extra-solar planets is a challenging task since the brightness of
the parent star is extremely high compared to its orbiting planets. The on-axis light from
the parent star gets diffracted in the coronagraph, forming a “ring of fire” pattern,
whereas the slightly off-axis light from the planet remains intact. Lyot stop can then be
used to block the ring of fire pattern, thus allowing only the planetary light to get through
to the imaging camera. Contrast enhancements of 106 or more are possible, provided the
vortex lens (spiral phase plate) has exceptional optical quality.
By using a vortex hologram with a 4 µm pitch, and an f/300 focusing lens, we
were able to demonstrate the creation of a “ring of fire” using a white light emitting diode
as a source. A dispersion compensating linear diffraction grating of 4 µm pitch was used
to bring the rings together to form a single white light ring of fire. To our knowledge, this
is the first time a vortex hologram based OVC has been demonstrated, resulting in a
well-formed white light ring of fire. Experimental results show measured power contrast of
1/515 when HeNe laser source was used as a light source and 1/77 when using a white
Acknowledgements
This thesis would not have been possible without help and support of all the people
around me who always kind and willing to give their time to contribute a valuable
assistance in the completion of this thesis.
First and foremost, I would like to express my sincerest gratitude to my thesis
advisor, Dr. Grover Swartzlander, for his supervision and guidance from the start to the
very end of this thesis. He gave me tremendous knowledge and experience, which make
me grow, become stronger and ready to face all the challenge to come in future.
I would like to also thank Thomas Grimsley and Dr. Alan Raisanen for their
helpful advice and support in the early stage of the hologram fabrication. I would like to
thank Dr. Stefan Preble for his help in the final hologram fabrication at Cornell
University. I would like to thank Sydor Optics for helping me cutting the hologram into
pieces. I would like to thank Rattana Mayteekriengkrai for helping me drawing many
beautiful figures. I would like to thank Dr. Waleed S. Mohammed for his help in the
programming code used to create the hologram. I would also like to give a special thank
to Dr. Zoran Ninkov and Dr. Mishkatul Bhattacharya for being my thesis defense
committee. And lastly, I would also like to thank all the professors, faculty staffs and all
my fellow students at Center of Imaging Science, Rochester Institute of Technology for
Table of Contents
Abstract ... iii
Acknowledgements ... iv
Table of Contents ... v
List of Figures ... vi
List of Tables ... viii
Chapter 1 Introduction ... 1
Chapter 2 Background ... 3
Chapter 3 Theory ... 8
Chapter 4 Vortex Hologram Generation ... 12
Chapter 5 Experiment ... 20
5.1. Experiment I: HeNe Laser Input source (λ=633nm) ... 20
5.2. Experiment II: White light source ... 22
Chapter 6 Results and Analysis ... 27
6.1. Laser source ... 27
6.2. White light source ... 29
6.3. Walk-off problem analysis ... 35
6.3.1 Grating equation ... 36
6.3.2 Normal incident walk-off ... 36
6.3.3 Walk-off analysis in the vortex coronagraph system ... 40
Chapter 7 Conclusion ... 43
List of Figures
Fig 3.1 Simple optical vortex coronagraph configuration ... 9
Fig 4.1 Vortex hologram intensity plot (m=2) ... 13
Fig 4.2 Vortex hologram (m=2) in binary version ... 13
Fig 4.3 The dots illustrate points forming one of the black stripe, GDS file format
requires coordinates forming a polygon to represent each stripe of the pattern. The task is
to write a programming code to find all the points forming all the stripes pattern. ... 14
Fig 4.4 The example of how the coordinates of the stripe boundary are computed
and stored, first loop, Matlab function fzero is implemented on the vortex pattern at fixed
y-value, points recorded shown in black dots: (x1,-10), (x2,-10) …. (x12,-10) ... 16
Fig 4.7 10mm x 10mm Vortex mask GDS file zoom in at the center ... 18
Fig 4.8 The actual vortex hologram pattern limited by the laser writing machine
resolution (resolution = 0.5µm) ... 19
Fig 5.1 Pretest white-light coronagraph optical setup (Laser source) M is for
mirror, L for Lens and H for the vortex hologram. L1 and L2 together form a beam
expander, L3, L4, L5 and L6 are 1 inch diameter, f/300 achromatic doublets. H1 is the
charge 2 vortex hologram whereas H2 is the normal grating. Both grating has 4µm spatial
period. ... 21
Fig 5.2 Optical setup of the white light coronagraph experiment first step;
aligning using Laser, AP for aperture, V for vortex hologram and L for Lens ... 23
Fig 5.3 The optical setup of the white light coronagraph experiment second step;
Fig 6.1 Broadband optical vortex coronagraph four lenses (L1, L2, L3 and L4) are
achromatic doublet (f=300mm D=1inch). V0 and V2 are vortex hologram of charge zero
and two respectively ... 27
Fig 6.2 Images of ring of fire taken at (a) first image plane (L3), (b) Lyot stop, the
dashed circle inside the ring of fire shows the pinhole size (d=0.5mm) in the power
measurement ... 29
Fig 6.3 (a) Dispersed rings of fire in the first image plane of the pupil. (b) The
white light ring of fire at the second image of the pupil. (c) The re-imaged pupil in the
same plane as image (b) with the vortex lens axis displaced from optical axis. ... 30
Fig 6.4 “Ring of fire” image from an astronomy camera, the yellow circle shows
the area where the radial plot was taken. ... 31
Fig 6.5 Normalized integrated intensity verses radius in pixel plot (a) Laser source
at the first image plane (L3 plane in Fig 6.1), (b) Laser source at the Lyot stop plane (L4
plane in Fig 6.1) and (c) White light source at the Lyot stop plane ... 32
Fig 6.6 Schematic drawing of the vortex hologram ... 35
Fig 6.7 Amplitude grating ... 36
Fig 6.8 Schematic drawing depicting the ray diagram for the normal incident
monochromatic light source for the chrome pattern in the front (upper) and in the back
(lower) face ... 37
Fig 6.9 Schematic drawing depicting the ray diagram for the normal incident
polychromatic light source for the chrome pattern in the front (upper) and in the back
List of Tables
Table 6.1 The power ratio of the ring of fire pattern calculated at the plane L2 and
the Lyot stop plane, Pv is the power measured when the 0.5mm diameter pinhole is
placed in front of the power meter, PT is the total power measured when the pinhole is
removed and P0 is the ambient power measured when the laser is turned off. ... 28
Table 6.2 The power ratio of the ring of fire pattern calculated at the plane L3 and
the Lyot stop plane of the white light source case, Pv is the integrated density within the
0.5mm diameter circle at the core of the ring of fire, PT is the integrated density within
2.5mm diameter circle covering the whole ring of fire and P0v is the background
integrated density computed using 0.5mm diameter circle coverage area in the region
outside the ring of fire (average from ten locations) ... 34
Table 6.3 Beam center and beam diameter results from the ray tracing simulation
F (B) indicates chrome pattern on Front (Back) face. Thus, FF means both holograms has
chrome pattern on front face. The first and second letter indicates the vortex hologram
and the grating orientation respectively. ... 42
Chapter 1
Introduction
Optical vortices are ubiquitous in nature [1] and can be generated in the laboratory. The
topic is currently gaining interest in research due to the advancement in micro-fabrication
techniques. Optical vortices may be identified as a dark core of zero magnitude due to the
destructive interference of coherent light beam. The OV beam has a helicoid wavefront
and has undefined phase at its core (phase singularity). Optical vortices can be created in
several ways; most commonly used techniques are Diffractive Optical Elements (DOE),
and Computer Generated Holography (CGH).
Due to the unique characteristics of the optical vortices, researchers find many
useful applications of optical vortices. Examples are optical tweezers [2], optical spatial
filter [3], high-resolution fluorescence microscopy [4], quantum entanglement [5], and of
interest in this thesis, extra-solar planet detection [6-9].
In astronomy the optical vortex coronagraph [6,7] is one of the most promising
techniques for the direct observation of low luminance companions such as earthlike
exoplanets [8,9]. Contrast enhancements of 106 or more are possible, provided the vortex
lens (spiral phase plate) has exceptional optical quality [10]. In this thesis, we used
vortex hologram with a 4 µm pitch, and an f/300 focusing lens to demonstrate the
creation of a “ring of fire” using a white light emitting diode as a source. A dispersion
compensating linear diffraction grating of 4 µm pitch was used to bring the rings together
to form a single white light ring of fire. Previously, white light vortices have been
formed with such holographic pairs [11,12]. To our knowledge, this is the first time a
vortex hologram based OVC has been demonstrated, resulting in a well-formed white
This thesis is organized as follows; Chapter 2 provides backgrounds and literature
review of the optical vortex coronagraph. Chapter 3 presents the optical theory of the
optical vortex coronagraph. The creation of the computer generated vortex hologram is
discussed in Chapter 4. In Chapter 5, the experiment of the designed white light optical
vortex coronagraph is illustrated. The results of the experiment are shown and discussed
Chapter 2
Background
Vortices are characterized by the swirling motion around a center of a fluid. In nature,
vortices appear as whirlpools, tornadoes, hurricanes, toroidal vortices produced by
dolphin or humpback whales, and many more. In optics, vortices occur as a light with
dark core of zero intensity due to the destructive interference at the center of the beam,
the phase of this beam has a spiral profile hence the name optical vortices.
The essential feature of optical vortices is the spiral phase profile given in
cylindrical coordinates by
φ
{
r,θ,z}
=mθ (2.1)
where m is an integer called the topological charge
The phase of an optical vortex beam is singular at the center because it is
undefined hence the term “phase singularity”. The phase increases from 0 to integer
multiple (m) of 2π around one circle of the vortex. Due to the spiral phase profile, an
optical vortex beam propagates with a helical wave front.
In 1974, Nye and Berry shows in the first comprehensive benchmark paper about
optical vortices [13] that a scatter wave train from rough surface contains dislocation
much like found in an imperfect crystal. They found theoretically and experimentally that
these phase defects could have a form of edge, screw and mixed edge-screw dislocations.
Further experiment reported that controllable net optical vortices could be generated by
an interference of only three plane waves [14].
Optical vortex can be created in various ways such as computer generated
Beijersbergen et. al. showed experimentally the use of an astigmatic mode
converter [15] to transforms a Hermite-Gaussian mode (HG0l) to a Laguerre-Gaussian
mode (LG0l) which is basically an optical vortices with a topological charge m=l. The
converter comprises of two cylindrical lenses with an exploitation of Gouy phase.
Another way to create optical vortices is to use diffractive optical elements [16].
Optical vortex DOE is typically a glass etched such that its thickness increases
azimuthally in a spiral pattern (sometimes called spiral phase plate) so that the phase can
be described by Eq. (1). Light beam that is transmitted through an optical vortex DOE
gain azimuthal phase variation results in phase singularity at its core. This technique is
found to be more expensive due to the fabrication challenge than other methods.
The creation of optical vortices that is the most versatile and cheap is by using
computer-generated holograms. The vortex hologram pattern can be generated from the
interference pattern of a vortex beam and a reference beam. The employment of a
spherical [17] and a plane wave [18,19] reference beam has been reported. Using a
spherical wave reference beam generate a spiral shape hologram pattern whereas using a
plane wave reference beam generates a forking pattern. The creation of the vortex
hologram will be described in more detail in Chapter 4.
So far we discussed about what essentially is an optical vortices, in what form it
occurs in nature and how can we created them in a laboratory, the following will be about
the applications of an optical vortices.
Unique properties of optical vortices allow researchers to realize applications in
various fields. Optical vortices have been found applications in optical trapping [20]. The
the wavefronts of the focused beam, many new kinds of optical traps become realized. This is
where the optical vortex plays a role. When beam is modified to have a helicoids wavefront,
the beam no longer focuses at a point but instead it converges to from a ring of light. While
the reflecting, absorbing or low dielectric value objects tend to be damaged or repel by a
focusing of light, the optical vortex has dark focus and thus applicable to these objects.
Another main feature of the optical vortex tweezers is that the ring-like optical traps exert
both forces and torques on the object, which can be applied to study the photon spin and
orbital angular momentum in the field of quantum mechanics [21].
Recent research by Vladlen G. Shvedov et al. shows that the optical vortex can be
applied to the optical manipulation of 1000 times higher manipulation distance in which they
call a “Giant Optical Manipulation”. In this research, instead of using the weak radiation
pressure force like in conventional optical tweezers, the more powerful photophoretic force,
which is a radiometric force, is used. This approach is based on using the optical vortex beam
to hold the light absorbing particles at the center of the beam and in the meantime the effect
of the stochastic nature of the radiation force is minimized. The ring of the beam acts as an
optical vortex pipeline to constrain the particle to move along the optical axis and the thermal
force exert on the particle push the particle to move along the pipeline. The experimental
setup is shown in Fig.6. The moving distance of the particle as far as 1.5m has been reported
[22].
An application of optical vortices in astronomy is for the direct imaging of the planet,
which resides near its parent star in a search for an earth-like planet. Since the brightness of
parent star is extremely high (approximately 107 times higher than its planets in infrared and
1010 in visible), the adjacent planet is very difficult to detect. To tackle this problem, the ultra
high contrast imaging is required for this application, several optical schemes have been
The configuration of an optical vortex coronagraph is similar to the Lyot coronagraph
scheme [28] where in the optical vortex coronagraph, the occult disk is replaced by an optical
vortex lens. Both systems have the Lyot stop at the exit pupil to filter out undesired light.
While Lyot coronagraph scheme suffers from the leakage of light through the Lyot stop,
optical vortex coronagraph theoretically rejects all the on-axis light thus has zero leakage.
Contrast enhancement better than 104 has been reported at 4λ/D angular separation [29].
Using an optical vortex lens in coronagraph configuration results in a striking
“ring of fire” diffraction pattern much like a solar eclipse, where there is a pitch black
circle surrounded with a circular ring of light. The theoretical explanation of the ring of
fire pattern will be described in detail in the next chapter.
A typical optical vortex coronagraph configuration can operate under a highly
monochromatic light source. Numerous applications can be further realized once the
broadband operation of an optical vortex lens is fully explored. Swartzlander proposed a
vortex lens design scheme for generating an optical vortex across a bandwidth as large as
140nm by using two adjacent glass materials having single or multiple helicoids
interfaces [30]. Leach and Padgett employed a dispersion compensating glass prism to
recombine dispersed vortices created from a spatial light modulator in order to observe
chromatic effects near a white light vortex [11]. Mariyenko et. al. applied similar
configuration to Leach and Padgett to achieve optical vortex in femtosecond pulses which
naturally have a large band width. The objective of the creation is to investigate “the
influence of optical orbital angular momentum on intense-field ionization processes”. In
their experimental setup, the vortex is created via computer-generated hologram and the
In this thesis, we employed similar concept of creating white light optical vortex
as Leach and Padgett, and Mariyenko et al. to the optical vortex coronagraph
configuration to demonstrate experimentally for the first time to our knowledge a white
Chapter 3
Theory
The Fourier transform (FT) is a remarkable tool in an analysis of imaging systems. Here
we shall adopt the Fourier transform in the analysis of the optical vortex coronagraph
system.
In most of the optical systems, optical components are circularly symmetric in
2-D. A mathematical tool that is more suitable in the analysis of a circularly symmetric
function is the Hankel transform or the Fourier-Bessel transform [31].
If we have an input light field represents by a function f[x,y] in front of a Fourier
transform lens, the light field at the distance f behind the lens can be expressed by the
Fourier transform of the input function:
[
]
{
}
[
]
( )∫ ∫
∞ ∞ − ∞ ∞ − + −= f x ye dxdy
y x f T
F. . , , i2πξx ηy (3.1)
where x,y represents spatial coordinates in front of the lens and ξ,η is the inverse spatial
coordinates at the FT plane.
For the 2-D circularly symmetric system f[x,y] can be rewritten as f(r)1(θ), the
function varies only in r direction and is constant in θ direction. The Fourier transform of
the circularly symmetric system can be conveniently converted to the zero order Hankel
transform [31] given by:
[ ]
{
}
=∫
∞( )
[
]
=Η{
( )
}
0 0 0 2 2 , .
.T f x y f r rJ r dr f r
F π π ρ (3.2)
where r represents radial spatial coordinates in front of the lens and ρ is the radial inverse
spatial coordinates at the FT plane.
[ ]
{
}
∫
( )
[
]
{
( )
}
∞ Η = = 0 2 2 , ..T f x y f r rJ r dr f r
F π ν π ρ ν (3.3)
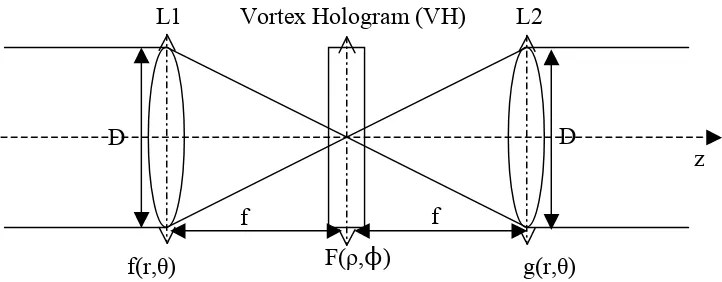
The simple OVC configuration (Fig 3.1) composes of two FT lens separated by a
distance 2f and at a distance f from both lens, there is a vortex hologram which in this
case we adopt the vortex hologram with a topological charge (m) of 2. Here we will
prove mathematically that given a uniform circular plane wave as an input f(r,θ), the
[image:18.612.120.481.286.427.2]output field g(r,θ) will be a ring of fire pattern.
Fig 3.1 Simple optical vortex coronagraph configuration
The incoming light beam to the system is assumed to be a plane wave thus, the
field at L1 is basically a pupil function of a lens which is a cylindrical function with a
diameter D given by:
(
)
⎟ ⎠ ⎞ ⎜ ⎝ ⎛ = D r CYL rf ,θ (3.4)
The light field at the plane VH can then be computed from the zeroth order
Hankel transform of the cylindrical function:
f(r,θ) F(ρ,φ) g(r,θ)
Vortex Hologram (VH)
L1 L2
z
D D
[
]
∫
∞ ⎟ ⎠ ⎞ ⎜ ⎝ ⎛ = ⎭ ⎬ ⎫ ⎩ ⎨ ⎧ ⎟ ⎠ ⎞ ⎜ ⎝ ⎛ Η 0 00 2 rJ 2 r dr
D r CYL D
r
CYL π π ρ
(3.5)
or equivalently,
[
]
∫
= ⎭ ⎬ ⎫ ⎩ ⎨ ⎧ ⎟ ⎠ ⎞ ⎜ ⎝ ⎛ Η 2 / 0 00 2 2
D dr r rJ D r
CYL π π ρ
(3.6)
Let u=2πrρ, dr=du/2πρ, substitution gives:
[ ]
∫
= ⎭ ⎬ ⎫ ⎩ ⎨ ⎧ ⎟ ⎠ ⎞ ⎜ ⎝ ⎛ Η ρ π πρ πρ π D du u J u D r CYL 0 0 0 2 2 2(3.7)
Rearranging the terms gives:
[ ]
∫
= ⎭ ⎬ ⎫ ⎩ ⎨ ⎧ ⎟ ⎠ ⎞ ⎜ ⎝ ⎛ Η ρ π πρ D du u uJ D r CYL 0 0 2 0 2 1(3.8)
By using the finite integral formula [32],
( )
( )
∫
= x x xJ dr r rJ 0 1 0(3.9)
The expression of Eq. (3.8) becomes,
[
π ρ]
ρ J D D D r CYL 1 0 2 = ⎭ ⎬ ⎫ ⎩ ⎨ ⎧ ⎟ ⎠ ⎞ ⎜ ⎝ ⎛ Η(3.10)
which in fact can also be written as a scaled sombrero function:
(
ρ)
πD SOMB D D r CYL 4 2 0 = ⎭ ⎬ ⎫ ⎩ ⎨ ⎧ ⎟ ⎠ ⎞ ⎜ ⎝ ⎛ Η
(3.11)
The field at the VH plane can then be computed by multiplying the expression in
Eq. (3.10) with the vortex phase function Eq. (2.1):
(
)
(
)
[
π
ρ
]
ρ
φ
φ
ρ
im D J DF 1
2 exp
, =
The field at the L2 plane can then be computed from the inverse Fourier transform
of F(ρ,ϕ) and the equivalent mth order hankel transform:
g r
(
,θ)
=F.T.{
F(
ρ,θ)
}
=( )
−i 2exp
(
imθ)
Hm{
F(
ρ,φ)
}
(3.13) where m is a topological charge of the vortex hologram.
Rewrite the Hankel transform in Eq. (3.13) to an integral form:
g r,θ
(
)
=( )
−i mexp(
imθ)
2πρJm[
2πρr]
D2ρJ1
[
πDρ]
dρ0 ∞
∫
(3.14)
Taking ρ independent terms out of the integral and substitute m=2:
g r,
(
θ)
=( )
−i 2πDexp(
i2θ)
J2[
2πρr]
J1[
πDρ]
dρ0 ∞
∫
(3.15)
An integral of this form can be proved to have the following expression [32]:
( )
( )
[
]
[
]
[
]
∫
∞ − − > = < = 0 1 1 ; 0 ; 2 1 ; α β α β β α β α β β α ν ν νν x J x dx J
(3.16)
Employing the expression in Eq. (3.16) to Eq. (3.15) gives the final expression:
(
)
(
)
[
]
[
]
⎪⎩ ⎪ ⎨ ⎧ < > = 2 / ; 0 2 / ; 4 2 exp , 2 2 D r D r r D i rg θ θ
(3.17)
which is essentially a ring of fire pattern of radius D. From Eq. (3.17), the field is zero
Chapter 4
Vortex Hologram Generation
The vortex hologram is the intensity of the interference pattern between plane wave and a
vortex wave. Plane wave tilted by an angle ψ with respect to an optical axis is
represented by,
𝐸
! =𝑒𝑥𝑝
𝑖2𝜋𝑥
Λ (4.1)
where Λ=!"#$! is the spatial period of the plane wave in transverse axis and will also
appear as a spatial period of the interference pattern.
Vortex wave with a topological charge m is,
𝐸! =exp −𝑖𝑚𝜃 (4.2)
where 𝜃 = 𝑎𝑟𝑐𝑡𝑎𝑛 !!
The intensity of the interference between plane wave (Ep) and vortex wave (Ev) is
then represented by,
𝐼 = 𝐸!+𝐸! !
(4.3)
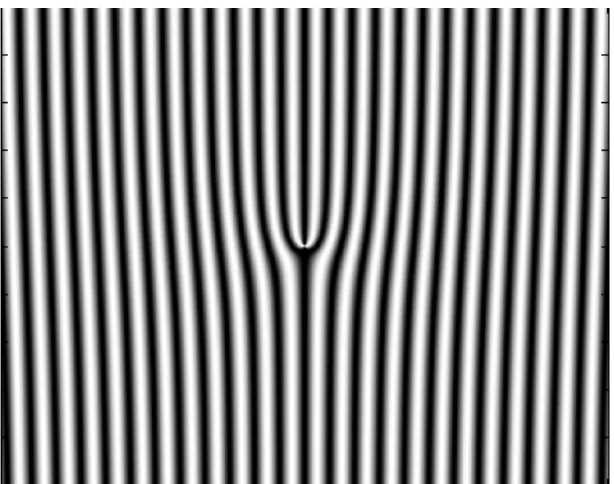
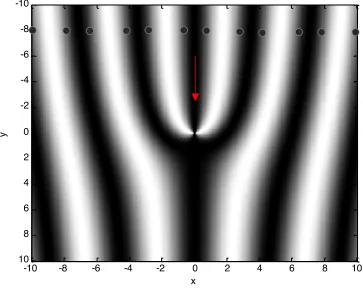
The intensity pattern is plotted as shown in Fig 4.1 for the case m=2. The fork
shape in the center of the profile is the characteristic of the vortex hologram.
In the fabrication of the mask, the pattern has to be in binary, either letting the
light through or completely blocking the light. Thus, the actual printed pattern will appear
Fig 4.1 Vortex hologram intensity plot (m=2)
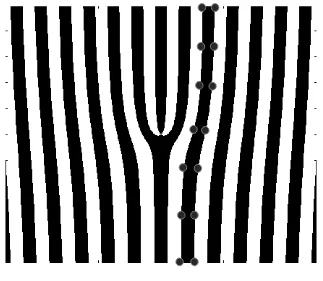
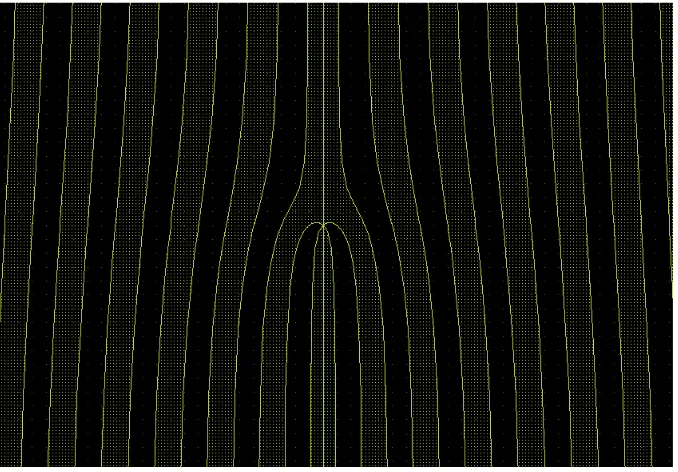
[image:22.612.153.463.402.652.2]To create a Graphic Data System (GDS) file representing this hologram, we have
to specify coordinates forming a polygon for all the stripes (Fig 4.3), either black or
white. Larger number of coordinate points will results in more detail of a pattern. Matlab
was used to calculate all the coordinates representing all the stripes to be interpreted into
[image:23.612.145.468.234.515.2]GDS file format. Next, we will explain how the code was written to accomplish this.
Fig 4.3 The dots illustrate points forming one of the black stripe, GDS file format
requires coordinates forming a polygon to represent each stripe of the pattern. The task is
to write a programming code to find all the points forming all the stripes pattern.
The programming procedure is described as follows. First, the pattern calculated
process is done in order to make use of the fzero built-in function in Matlab. The function
fzero can find the exact transition points of the pattern. The x-coordinate of the transition
points along the horizontal line is recorded line by line along the y-direction (for-loop in
y-direction).
Fig 4.4 and Fig 4.5 shows the first two iteration of the code where fzero is
implemented line by line and the transition point coordinates are recorded. Once the loop
runs through all the y value, we will have all the transition point and then we connect
these points to form a polygon representing all the stripes by writing the coordinates to
the ASCII text file. The precision of the polygon approximating the actual stripes is
determined by the precision in the y-direction sampling. Since the size of the mask is
10mm and the grating period is 4µm, a large amount of memory to store the coordinates
to achieve a decent resolution of the desired pattern is required. However, this problem
can be solved by customizing the y-sampling interval such that the sampling rate is high
near the core of the vortex and is low further away from the center. The text file is then
translates to the GDS file via Owlvision software. The resulting GDS file is shown in Fig
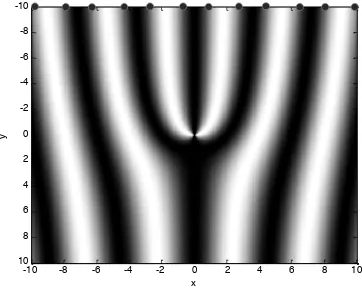
Fig 4.4 The example of how the coordinates of the stripe boundary are computed and
stored, first loop, Matlab function fzero is implemented on the vortex pattern at fixed
y-value, points recorded shown in black dots: (x1,-10), (x2,-10) …. (x12,-10)
x
y
-10 -8 -6 -4 -2 0 2 4 6 8 10
-10
-8
-6
-4
-2
0
2
4
6
8
Fig 4.5 The example of how the coordinates of the stripe boundary are computed and
stored, second loop, Matlab function fzero is implemented on the vortex pattern at fixed
y-value, points recorded shown in black dots: (x1,-8), (x2,-8) …. (x12,-8), the loops repeat
like this for all values of y. x
y
-10 -8 -6 -4 -2 0 2 4 6 8 10
-10
-8
-6
-4
-2
0
2
4
6
8
Fig 4.6 10mm x 10mm Vortex mask GDS file
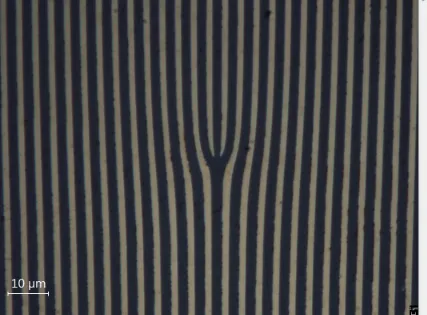
[image:27.612.139.478.424.660.2]The vortex hologram GDS file was then sent to the DWL2000 laser lithography
machine (0.6µm resolution). A chrome pattern (1mm x 1mm) was printed on the 2mm
thick fused silica. Fig 4.8 shows the actual 100x microscopic image of the vortex
[image:28.612.94.521.212.527.2]hologram at a center.
Chapter 5
Experiment
The experiment part can be divided into two steps. First, we pretest the performance of
the fabricated vortex hologram and the designed coronagraph system by using HeNe
Laser as a light source. Second, we switched to our main concern, to experiment the
system with the broadband source which in this project, we used white light emitting
diode (LED) as a light source.
5.1. Experiment I: HeNe Laser Input source (
λ
=633nm)
To predetermine the workability and the performance of the setup designed, HeNe Laser
was used as an input light source. The setup is shown in Fig 5.1.
To approximate a plane wave, the HeNe laser first is passed to the beam expander
consists of lens L1 and L2 generating approximately uniform circular collimated red laser
beam. The mirror M1 then reflects the collimated laser beam to the focusing lens L3
where the pinhole of a diameter 1mm is placed in front of it. The role of the pinhole is to
reduce the size of the incoming beam hence the airy disk size is increased according to
𝑟= 1.22𝜆𝑓/𝐷 (5.1)
where r is the airy disk radius and f and D is the focal length and diameter of the lens L3
respectively.
For the 1mm diameter input beam, focused airy disk has 183μm diameter
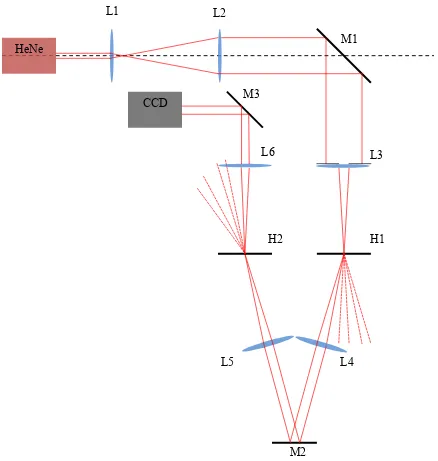
Fig 5.1 White-light optical vortex coronagraph optical setup (Laser source) M is for
mirror, L for Lens and H for the vortex hologram. L1 and L2 together form a beam
expander, L3, L4, L5 and L6 are 1 inch diameter, f/300 achromatic doublets. H1 is the
charge 2 vortex hologram whereas H2 is the normal grating. Both grating has 4µm spatial
period. HeNe
CCD
L1 L2
L3
L4 L5
M1
M2 M3
H1 H2
At the distance f behind L3 is the 4µm period vortex hologram of charge 2 (H1),
the focused beam is diffracted into multiple orders. For this experiment we interest in
only the first mode (n=+1) only, lens L4 is then placed in alignment with the first order
diffracted beam at a distance f to separate and collimate the desired order. Lens L4 and
L5 functionality is basically to relay the desired order beam, also note that the distance
between L4 and L5 is 2f. Lens L5 focus the beam to the vortex hologram of charge 0 or
equivalently a diffraction grating of the same period as H1. Again, the beam is diffracted
into several orders and for this time, the opposite diffraction order (n=-1) is selected.
5.2. Experiment II: White light source
In the previous section, we demonstrate experimentally the operation of the designed
optical vortex coronagraph under the monochromatic source. For this section white LED
will be used as a light source to the coronagraph system. The schematic drawing of the
setup are shown in Fig 5.2 and Fig 5.3. The experimental procedure can be divided into
two steps. First, HeNe Laser was used to align the coronagraph system (Fig 5.2) and
second, white LED was switched on instead of Laser (Fig 5.3) and the images were
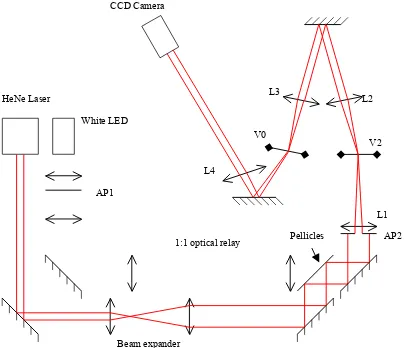
Fig 5.2 Optical setup of the white light coronagraph experiment first step; aligning using
Laser, AP for aperture, V for vortex hologram and L for Lens Pellicles
Beam expander
1:1 optical relay AP1
AP2 V2 V0
HeNe Laser
White LED
CCD Camera
L1 L2 L3
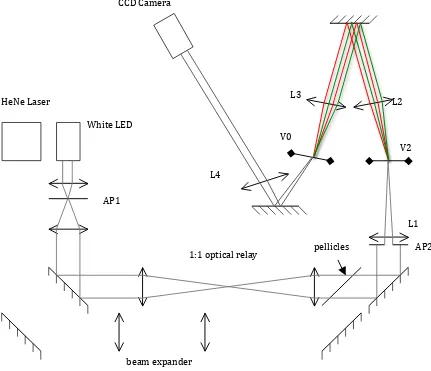
Fig 5.3 The optical setup of the white light coronagraph experiment second step; using
the white light LED, AP for aperture, V for vortex hologram and L for Lens
The first step is similar to the previous section where we have a laser beam
expanded and sent to the coronagraph system except that now we introduce the pellicles
to the system. Note that before aligning the coronagraph system, we have to make sure
that the pellicles are in the right orientation where both white LED light going through
the pellicles and the Laser reflecting from the pellicles are aligned with each other. The
reason for this is that the power of the collimated planar white LED light is extremely
pellicles
beam expander
1:1 optical relay AP1
AP2 V2 V0
HeNe Laser
White LED
CCD Camera
L1 L2 L3
L4
low which makes the alignment of the coronagraph by the white LED light alone become
extremely difficult therefore, red Laser was used to align the system prior to the using of
the white LED light.
The plane wave white LED light was created by first focusing the collimated LED
to the 25μm diameter pinhole (AP1). The light coming out of the pinhole represents a
point source, which was then collimated using another lens giving the close
approximation of the collimated planar white light. Due to the existence of the pellicles,
1:1 optical relay was introduced to relay the desired beam to the telescope objectives
(AP2).
One thing in the consideration of the design of the setup was the fact that the light
source is a polychromatic LED source and the design must be made such that the
collimated white LED at the plane AP2 has a substantial spatial coherence. In this case,
the coherence area of the beam must be at least of a circle with diameter of 1mm (the
same size as the diameter of AP2). The coherence area can be calculated from:
𝑠= 𝜆
𝜃 (5.2)
where θ is the angular size of the pinhole as seen from the center of the collimating lens,
therefore the equation can be rewritten as follow:
𝑠 =1.22𝜆𝑓
𝑑 (5.3)
We chose the collimating lens of focal length (f) 60mm to ensure considerable
amount of light to be collected, using the smallest λ in the visible region of 0.4μm and the
pinhole to be 29.28μm. In this setup, we use the AP1 pinhole diameter size of 25μm to
Chapter 6
Results and Analysis
For the ease of an explanation, the experimental setup is simplified to the diagram shown
in Fig.12. The alignment system of the setup is ignored, showing only the planar white
[image:36.612.98.555.200.361.2]light input to the optical vortex coronagraph system.
Fig 6.1 Broadband optical vortex coronagraph four lenses (L1, L2, L3 and L4) are
achromatic doublet (f=300mm D=1inch). V0 and V2 are vortex hologram of charge zero
and two respectively
6.1. Laser source
For the monochromatic light source the ring of fire pattern can be observed at both L2
and Lyot stop (L4) plane (refer to Fig 6.1). The “ring of fire” images taken from the CCD
camera are shown in Fig 6.2.
To assess the performance of the setup and the vortex mask fabricated, power
ratio (η) is calculated from the following equation:
𝜂 = 𝑃!−𝑃!
where Pv is the measured power inside the ring of fire, PT is the measured total power and
P0 is the ambient power measured when the laser source is turned off.
The power is measured and the contrast power ratio is calculated at two locations
L2 and L4 planes.
The results are shown in Table 6.1. Pv was measured using power meter by
placing 0.5mm diameter pinhole at the center of the ring of fire. PT was measured in the
exact same condition except the pinhole was removed. And P0 is the ambient power
measured. The pinhole size is also illustrated as a dashed circle in Fig 6.2.
Pv PT P0 η
L3 1.20 nW 1.10 µW 3.5±0.7 pW 1/9174
[image:37.612.84.533.319.407.2]Lyot stop 0.175 nW 91.0 nW 3.5±0.7 pW 1/514.6
Table 6.1 The power ratio of the ring of fire pattern calculated at the plane L2 and the
Lyot stop plane, Pv is the power measured when the 0.5mm diameter pinhole is placed in
front of the power meter, PT is the total power measured when the pinhole is removed and
P0 is the ambient power measured when the laser is turned off.
The power ratio decreased from around nine thousandth at the first image plane
(L3) to only five hundredth at the Lyot stop. This result suggests that the optical relay
decreases the performance of the coronagraph significantly. The images of the ring of fire
Fig 6.2(b) is 10 times longer than for Fig 6.2(a) so the brighter background intensity is
observed in Fig 6.2(b).
[image:38.612.111.508.161.337.2](a) (b)
Fig 6.2 Images of ring of fire taken at (a) first image plane (L3), (b) Lyot stop, the dashed
circle inside the ring of fire shows the pinhole size (d=0.5mm) in the power measurement
6.2. White light source
To demonstrate the visible spectrum dispersion and recombination, the images of the
rings of fire were recorded using Nikon D50 digital camera at both the plane of lens L3
(see Fig 6.3(a)) where the light is dispersed, and at the plane of L4 where a white light
image of the ring of fire or pupil are formed (see Fig. 6.3(b) and (c)). The color images
have a yellow hue because the blue band of the LED is strongly diffracted out of the
system. The white light pupil shown in Fig. 6.3(c) is formed when the center of the
vortex lens is displaced from the centroid of the focal spot. The black hole in the center
of the ring of fire is indicative of high contrast afforded by this device across a broad
band of wavelengths.
1mm 0.5mm 1mm
(a)
(b) (c)
Fig 6.3 (a) Dispersed rings of fire in the first image plane of the pupil. (b) The white light
ring of fire at the second image of the pupil. (c) The re-imaged pupil in the same plane as
(b) with the vortex lens axis displaced from optical axis.
More accurate image was then taken using astronomy camera SBIG SME402 as
shown in Fig 6.4. The yellow circle indicates the area which the normalized integrated
[image:39.612.114.496.71.508.2]laser source case. In theory, the profile of the radial plot should be a sharp edge from zero
to the maximum value at the edge of the black hole inside the ring of fire. However, the
all result shows the gradually increasing in intensity. The error is due to the imperfect
alignment, optical quality and the mask fabrication error. As expected, the radial plot
from the laser case in the first image plane (Fig 6.5(a)) appears to be the closest to the
theory, since the probability of error is less than the results taken from the final Lyot stop
[image:40.612.168.483.290.528.2]plane.
Fig 6.4 “Ring of fire” image from an astronomy camera, the yellow circle shows the area
where the radial plot was taken.
Fig 6.5 Normalized integrated intensity verses radius in pixel plot (a) Laser source at the
first image plane (L3 plane in Fig 6.1), (b) Laser source at the Lyot stop plane (L4 plane
in Fig 6.1) and (c) White light source at the Lyot stop plane
To quantify the performance of the white light coronagraph system, the power
contrast is calculated the same way reported in the earlier section where the Laser source
is used. The power ratio (η) is the ratio between the power inside the black hole and the
total power. For this experiment, we placed a 0.5mm diameter pinhole at the center of the
ring of fire and recorded the power using the power meter. However, due to the low
power of the white light the signal to noise ratio is too low for the power recorded to be
meaningful unlike the Laser case where the power is extremely higher.
To circumvent the power problem, instead of direct power measurement we then
opted to calculate the power ratio from the image taken using the astronomy camera. The
pixel size of the camera is 9μm, pixels covering circle of diameter 500/9 ≈ 56 pixels at
the core of the black hole are used as a 0.mm diameter circular area for the integrated
density when the pinhole is placed (Pv) to be calculated (The integrated density was
calculated using imageJ software built-in function and note that the same notation P is
used in this case only to conform with the previous result from the laser case. Thus, P in
this case does not represent power but rather the integrated density). The total integrated
density (PT) was calculated in a similar ways as Pv but instead using larger computed
circular area (d=2.5mm). P0v denotes the background power for this case because it was
calculated using the same circular area as the Pv calculation (d=0.5mm). The value
reported is the average value of the computed background integrated density from the
randomly selected ten locations outside the ring of fire. Thus, the power ratio calculated
𝜂 = 𝑃!−𝑃!
𝑃!−!!!!!!
!
(6.2)
where Av and AT represents the calculated circular area in the calculation of Pv and PT
which is 0.5mm and 2.5mm respectively.
The calculated results are shown in comparison with the laser source as shown in
Table 6.2. Note that for the white light case, the power ratio is not calculated at plane L3
since in this case light are dispersed and the ring of fire appears as a bar instead. At the
Lyot plane on the other hand, dispersed light is brought back together and the power ratio
can be calculated to be 1/76.7 which is in agreement with the intuition, when the white
light is used, numerous source of errors are prone to happen such as chromatic aberration
and the misalignment of the compensation grating.
HeNe laser light source
Pv PT P0 η
L3 1.20 nW 1.10 µW 3.5±0.7 pW 1/9174
Lyot stop 0.175 nW 91.0 nW 3.5±0.7 pW 1/514.6
White LED light source
Pv PT P0v η
L3* -‐ -‐ -‐ -‐
Lyot stop 766021 38197035 267861 1/76.7
[image:43.612.83.529.396.630.2]*In the white light case, the ring of fire at L3 plane is dispersed forming a bar as shown in Fig 6.2(a) hence the power contrast at this plane is not calculated
Table 6.2 The power ratio of the ring of fire pattern calculated at the plane L3 and the
0.5mm diameter circle at the core of the ring of fire, PT is the integrated density within
2.5mm diameter circle covering the whole ring of fire and P0v is the background
integrated density computed using 0.5mm diameter circle coverage area in the region
outside the ring of fire (average from ten locations)
6.3.
Walk-off problem analysis
One significant concern owing to the imperfection of an attempt to bringing the dispersed
beam back together using the diffraction grating with the same period as the vortex
hologram is the walk-off problem. In this case, the holograms are 2mm thick fused silica
printed with chrome pattern on one side (Fig 6.6). The concern is deciding on which way
the hologram should be faced with the incoming beam for both vortex hologram and the
[image:44.612.192.386.443.614.2]grating to minimize the walk-off.
6.3.1 Grating equation
Fig 6.7 Amplitude grating
The grating equation can be derived from the constructive interference condition in which
the intensity peak occurs when the Optical Path Difference (OPD) is equal to the integer
multiple (N) of the wavelength of the light (λ). According to Fig 6.7 the condition can be
written as:
𝑛!𝑥!+𝑛!𝑥! = 𝑁𝜆 (6.3)
𝑛!𝑠𝑖𝑛𝜃!+𝑛!𝑠𝑖𝑛𝜃! =𝑁𝜆 (6.4)
6.3.2 Normal incident walk-off
For the grating that is a printed pattern on glass with some defined thickness, walk-off
minimize the effect of it. In this section, we will theoretically analyze both light impinge
on front and back face for the normal incident to the grating surface case.
6.3.2.1
Monochromatic light
For the front face incident, at the grating, equation (6.4) can be rewritten as (consider
only the +1 order diffraction):
𝑛!𝑠𝑖𝑛𝜃! =𝜆 (6.5)
𝜃! =𝑎𝑟𝑐𝑠𝑖𝑛
𝜆
[image:46.612.186.503.254.634.2]𝑛! (6.6)
Fig 6.8 Schematic drawing depicting the ray diagram for the normal incident
monochromatic light source for the chrome pattern in the front (upper) and in the back
And at the refraction interface, Snell’s law is applied:
𝑛!𝑠𝑖𝑛𝜃! =𝑛!𝑠𝑖𝑛𝜃! (6.7)
Substitute equation (6.7) into equation (6.6) gives:
𝜃! =𝑎𝑟𝑐𝑠𝑖𝑛
𝜆
𝑛! (6.8)
And for the back face incident case, light impinge to the refraction surface at a
right angle thus, there is no angle change in the first interface, we just have to use the
grating equation at the grating interface:
𝑛!𝑠𝑖𝑛𝜃! =𝜆 (6.9)
and again we have the same equation as for the first case:
𝜃! =𝑎𝑟𝑐𝑠𝑖𝑛
𝜆
𝑛! (6.10)
It can be concluded that, in both light impinging from the front and the back of
the grating cases, light coming off from the grating will have the same angle. The only
difference to these two cases is that the light coming off is displaced by a distance:
6.3.2.2
Polychromatic light
Fig 6.9 Schematic drawing depicting the ray diagram for the normal incident
polychromatic light source for the chrome pattern in the front (upper) and in the back
(lower) face
Here red and green beam represents the polychromatic light. Note that the derivation of
the output angle is the same as in the previous section of the monochromatic source
interesting value we could compute from the polychromatic source case is the
displacement difference between the red and green beam dh, which is given by:
𝑑ℎ= ℎ!−ℎ! =𝑡∙ 𝑡𝑎𝑛𝜃!!−𝑡𝑎𝑛𝜃!! (6.12)
where
𝜃!! = 𝑎𝑟𝑐𝑠𝑖𝑛 𝜆!
𝑛! (6.13)
𝜃!! = 𝑎𝑟𝑐𝑠𝑖𝑛
𝜆!
𝑛!
(6.14)
It could be observed that when light incident on the front face of the grating,
spectrum of light coming off from the grating appear as though they are not originating
from the same point due to the walk off inside a dispersing material. Orienting the grating
such that the chrome pattern is on the back face can eliminate this effect.
6.3.3 Walk-off analysis in the vortex coronagraph system
Previous section deals with the walk-off problem for the normal incident case in
particular. However, in the actual vortex coronagraph optical system of interest, light
incident on the grating with an angle and the system comprises of two such grating as
well as the other optical components that take part in the analysis. To circumvent the
complication, the more convenient ray tracing analysis is adopted. Note that the vortex
coronagraph system has the maximum angle subtending the optical axis of around 8
degrees, which ensure that the system is in the paraxial regime. This approach is
The ray tracing simulation was done using all four combinations of the grating
orientation possible; Front-Front (FF) means the vortex hologram having the grating
chrome pattern on the front face facing the incoming beam, Front-Back (FB), Back-Back
(BB) and Back-Front (BF) similarly. The simulation was done according to the actual
setup where the optical axis is aligned with red wavelength (633nm).
The table summarizing the simulation results is shown in Table 6.3. We simulated
two input beams of two wavelength; red beam (λ=633nm) and green beam (λ=550nm).
Since the optics was setup to align with red wavelength, red beam experiences little to no
deviation from the walk-off problem. Only the change is the beam size is observed on the
order of one-hundredth of millimeters. Of more important is how the green beam shifted
from the red beam, shown in red in Table 6.3 are the shift of the center of the beam of the
green beam with respect to where it should be (fully overlap with red beam) without the
walk-off problem. Here we can see that the lowest shift occurs in the FB case (13µm),
which is the vortex hologram front face and the normal grating back face. FF, BB, and
Table 6.3 Beam center and beam diameter results from the ray tracing simulation F (B)
indicates chrome pattern on Front (Back) face. Thus, FF means both holograms has
chrome pattern on front face. The first and second letter indicates the vortex hologram
and the grating orientation respectively.
The ray tracing results quite contradict with the preliminary analysis of the single
grating, where the light incident on back face result in lower deviation. This is because,
unlike the first grating where the incident beam is almost perpendicular to the grating, the
light incident to the second grating has high angle and the walk-off problem is
unavoidable and has a prominence effect regardless of the face of the grating impinged
upon. Therefore, to cancel this effect, instead of minimizing the walk-off in the first
Chapter 7
Conclusion
In conclusion, we were able to demonstrate for the first time the creation of a broadband
“ring of fire pattern” using a vortex hologram and an f/300 focusing lens. The optical
vortex coronagraph configuration was adopted with an addition of a dispersion
compensation grating to recombine the dispersed light beams.
To analyze the coronagraph performance quantitatively, we calculated the power
contrast ratio which is a ratio between the light power inside the ring of fire’s dark core
and the total power of the whole ring of fire. The power contrast ratio at the Lyot stop
plane when using white LED source was approximately 1/77 whereas, when using laser
source the power contrast was 1/517. The inferior performance when using white light
source is due to the chromatic aberrations, optical alignment imperfection, optics quality,
Bibliography
[1] G. A. Swartzlander, Jr. and G. Gbur, “Singular optical phenomena in nature,” Proc.
SPIE 7057 (The Nature of Light: Light in Nature II, C. Katherine, Editor),
705703-705703-9 (2008).
[2] K. T. Gahagan and G. A. Swartzlander Jr., “Optical vortex trapping of particles,”
Opt. Lett., Vol.21, No.11 (1995).
[3] Grover A. Swartzlander, Jr., “Peering into darkness with a vortex spatial filter,”
Opt. Lett., Vol.26, No.8 (2001).
[4] V. Westphal and S. W. Hell, "Nanoscale resolution in the focal plane of an optical
microscope," Phys. Rev. Lett. 94, 143903 (2005).
[5] H. H. Arnaut and G. A. Barbosa, “Twin photons with angular-momentum
entanglement: Phase matching,” Phys. Rev. Lett. 85, 286 (2000)
[6] D. Mawet, P. Riaud, O. Absil, and J. Surdej, "Annular Groove Phase Mask
Coronagraph," The Astrophys. J. 633, 1191 (2005).
[7] G. Foo, D. M. Palacios, and G. A. Swartzlander, Jr., “Optical vortex coronagraph,”
Opt. Lett. 30, 3308–3310 (2005).
[8] G. A. Swartzlander, E. L. Ford, R. S. Abdul-Malik, L. M. Close, M. A. Peters, D.
M. Palacios, and D. W. Wilson, “Astronomical demonstration of an optical vortex
coronagraph,” Opt. Express16(14), 10200–10207 (2008).
[9] D. Mawet, E. Serabyn, W. J. Kent, and L. Pueyo, “Improved high-contrast imaging
with on-axis telescopes using a multistage vortex coronagraph,” Opt. Lett.36, 1506–
[10] G. A. Swartzlander, Jr., “Broadband nulling of an optical vortex phase mask,” Opt.
Lett., 30, 2876-2878 (2005).
[11] J. Leach and M. J. Padgett, “Observation of chromatic effects near a white-light
vortex,” N. J. Phys. 5, 1–7 (2003).
[12] I. Mariyenko, J. Strohaber, and C. Uiterwaal, "Creation of optical vortices in
femtosecond pulses," Opt. Express 13, 7599-7608 (2005).
[13] J.F. Nye and M. V. Berry, “Dislocations in wave trains,” Proc. R. Soc. London Ser.
A 336, 165-190 (1974).
[14] J. Masajada and B. Dubik, “Optical vortex generation by three plane wave
interference,” Opt. Comm. 198, 21-27 (2001).
[15] M.W. Beijersbergen, L. Allen, H.E.L.O. van der Veen, and J.P. Woerdman,
“Astigmatic laser mode converters and transfer of orbital angular momentum,” Opt.
Comm. 96, 123-132 (1996).
[16] M.W. Beijersbergen, R.P.C. Coerwinkel, and J.P. Woerdman, “Helical-wavefront
laser beams produced by a spiral phase plate,” Opt. Comm. 112, 321-327 (1994).
[17] V. Yu. Bazhenov, m.V. Vasnetsov, and M.S. Soskin, “Laser beams with screw
dislocations in their wavefronts,” Pis’ma Zh. Eksp. Teor. Fiz. 52, 1037-1039 (1990)
[JETP Lett. 52, 429-431 (1990)].
[18] N.R. Heckenberg, R. McDuff, C.P. Smith, and A.G. White, “Generation of optical
phase singularities by computer-generated holograms,” Opt. Lett. 17, 221-223
[19] Alicia V. Carpentier, H. Michinel, J. R. Sulgueiro, D. Olivieri, “Making an optical
vortices using computer-generated holograms,” American Journal of Physics,
Vol.76, Issue 10, 916-921 (2008).
[20] K. T. Gahagan, G. A. Swartzlander Jr., “Optical vortex trapping of particles,” Opt.
Letters 21, 11 (1995).
[21] D. G. Grier, “A revolution in optical manipulation,” Nature 424, p.810-816 (2003).
[22] V. G. Shvedov et al., Giant optical manipulation Phys. Rev. Lett. 105, 118103
(2010).
[23] O. Guyon, C. Roddier, J. E. Graves, F. Roddier, S. Cuevas, C. Espejo, S.Gonzalez,
A. Martinez, G.Bisiacchi, and V. Vuntesmeri, “The Nulling Stellar Coronagraph :
Laboratory Tests and Performance Evaluation,” PASP 111, 1321-1330 (1999).
[24] R. Galicher, O. Guyon, M. Otsubo, H. Suto, and S. Ridgway, “Laboratory
Demonstration and Numerical Simulations of the Phase-Induced Amplitude
Apodization,” PASP 117, 411–420 (2005).
[25] A. Chakraborty, L. Thompson, and M. Rogosky, "10-7 contrast ratio at 4.5λ/D: New
results obtained in laboratory experiments using nano-fabricated coronagraph and
multi-Gaussian shaped pupil masks," Opt. Express 13, 2394-2402 (2005).
[26] D. Mawet, P. Riaud, J. Baudrand, P. Baudoz, A. Boccaletti, O. Dupuis and D.
Rouan, “The four quadrant phase-mask coronagraph: white light laboratory results
with an achromatic device,” A&A 448, 801-808 (2006).
[27] Grover A. Swartzlander Jr., “The optical vortex coronagraph,” J. Opt. A: Pure Appl.
[28] M. B. Lyot, “A study of the solar corona and prominences without eclipses,” Mon.
Not. R. Astron. Soc. 99, 580 (1939).
[29] G. A. Swartzlander, Jr., E. L. Ford, R. Abdul-Malik, J. Kim, L. Close, M. A. Peters,
D. Palacios and D. Wilson, “Advancements of the optical vortex coronagraph,”
Proc. SPIE 6693 (Techniques and Instrumentation for Detection of Exoplanets III,
Daniel R. Coulter, Editor), 669311-17 (2007).
[30] Grover A. Swartzlander, Jr., “Achromatic optical vortex lens,” Opt. Lett., 30, 13,
(2006).
[31] R. Easton, Fourier Methods in Imaging, Wiley (2010)
[32] I. S. Gradshteyn and I. M. Ryzhik, Tables of Integrals, Series and Products 7th