Rochester Institute of Technology
RIT Scholar Works
Theses Thesis/Dissertation Collections
6-5-2013
Integration technologies for implantable
microsystems
Dean Johnson
Follow this and additional works at:http://scholarworks.rit.edu/theses
This Dissertation is brought to you for free and open access by the Thesis/Dissertation Collections at RIT Scholar Works. It has been accepted for
inclusion in Theses by an authorized administrator of RIT Scholar Works. For more information, please [email protected].
Recommended Citation
Integration Technologies For
Implantable Microsystems
by
Dean G. Johnson
A Dissertation Submitted in Partial Fulfillment of the Requirements for the Degree of Doctorate of Philosophy in Microsystems Engineering
Department of Electrical Engineering Kate Gleason College of Engineering
Rochester Institute of Technology Rochester, NY
June 5, 2013
Author: _________________________________________________________________ Microsystems Engineering Program
Certified by: _____________________________________________________________ David A. Borkholder, Ph.D. Professor of Microsystems Engineering
Approved by: ____________________________________________________________ Bruce W. Smith, Ph.D. Director of Microsystems Engineering Program
Committee
Approval:
Bruce W. Smith, Ph.D. Date
Director of Microsystems Engineering Ph.D. Program
David A. Borkholder, Ph.D. Date
Dissertation Committee Chairperson Chief Advisor
Denis Cormier, Ph.D. Date
Professor of Microsystems Engineering Committee Member
Lynn Fuller, Ph.D. Date
Professor of Microsystems Engineering Committee Member
Sergey Lyshevsky, Ph.D. Date
A
BSTRACT
Kate Gleason College of Engineering Rochester Institute of Technology
Degree: Doctor of Philosophy Program: Microsystems Engineering
Name of Candidate: Dean G. Johnson
Title: Integration Technologies for Implantable Microsystems
Microsystems targeted for implantation require careful consideration of power,
thermals, size, reliability, and biocompatibility. The presented research explored
appropriate integration technologies for an implantable drug delivery system suitable for
use in mice weighing less than 20 grams. Microsystems technology advancements
include in situ pump diaphragm formation; integrated, low volume microfluidic coupling
technologies; and incorporation of a low voltage, low-power pump actuation with a
zero-power off state. Utility of the developed integration technologies have been tested
through in vitro reliability and validation experiments. A four-chamber peristaltic pump
was created using micromachining (e.g. thin film deposition and Si etching) and direct
write techniques. A novel phase change material based actuator was designed and
fabricated to deflect deformable diaphragms into and out of four pump chambers while
the diaphragms isolated the pumped fluid from the working material. Polyimide capillary
tubing with 140-μm OD was integrated in-plane and acted as fluidic interconnects to a
drug supply and to the pharmaceutical delivery site. Parylene C conformal coating and
the design for gap occlusion provided sealed, flexible tubing connections to the
micropump. The per chamber actuation power of 10.1 mW at 0.083 Hz resulted in fluid
D
EDICATION
At times our own light goes out and is rekindled by a spark from another person. Each of us has cause to think with deep gratitude of those who have lighted the flame within us.
Albert Schweitzer
I dedicate this dissertation to my outrageously loving and supportive wife, Kristen. She
is the spark that rekindles my light. Without her understanding and inspiration I would
A
CKNOWLEDGMENT
No one can whistle a symphony. It takes a whole orchestra to play it. H.E. Luccock
In working on this project, I have received support and encouragement from many
people. Dr. David Borkholder has been a mentor and his guidance has made this an
enriching experience. I would like to thank my dissertation committee of Dr. Denis
Cormier, Dr. Lynn Fuller, Dr. Sergey Lyshevski, Dr. Mustafa Abushagur, and Dr. Bruce
Smith for their support and feedback, which helped move me past roadblocks and kept
me focused.
I thank my fellow students; Ivan Puchades, Jirachai Getpreechasawas, Sundar
Balasubramanian, Cory Cress, Anuj Datar, Karthik Narayanan, Jing Ouyang, and
Zhianming Zhou. The faculty and staff of the SMFL, Sean O’Brien, John Nash, Rich
Battaglia, Bruce Tolleson, Scott Blondell, Tom Grimsley, Dave Yackoff, Dr. Alan
Raisanen, and Dr. Karl Hirschman were instrumental in supporting the work needed to
complete my research. For their work with my cannulae and the mouse model I wish to
thank Dr. Robert D. Frisina and Dr. Xiao Xia Zhu. For help with the Parylene C
deposition model I thank Dr. Steven Weinstein, Dr. Karuna Koppola, and Dr. Masoumeh
Haghpanahi. I also wish to thank Dr. Luane Davis Haggerty and the faculty, staff, and
students of NTID for introducing me to Deaf culture.
I would like to thank my children, Katie and Adam. They do not know what they had to
put up with but I thank them regardless. My parents, Marian Johnson and Dr. Richard
Johnson, showed me that it is never too late to further your education and that all things
C
ONTENTS
List of Illustrations __________________________________________________________ ix
List of Tables _________________________________________________________ xiii
Chapter 1 Introduction _____________________________________________________ 1
1.1. Auditory Dysfunction Therapy Development _____________________________________ 2
1.1.1. Site-Directed Delivery ___________________________________________________________ 3 1.1.2. Mouse Model System: Benefits and Challenges ________________________________________ 3
1.2. Micropumps in Biological Systems _____________________________________________ 5
1.2.1. Use of Implantable Micropumps for Auditory Dysfunction Therapies _______________________ 6 1.2.2. Types of Micropumps ____________________________________________________________ 7 1.2.3. Material Selection for Implantable Micropump Components _____________________________ 10
1.3. Objectives _________________________________________________________________ 11
Chapter 2 Fluidic Interconnects _____________________________________________ 14
2.1. In-Plane Biocompatible Microfluidic Interconnects for Implantable Microsystems ____ 14
2.1.1. Interconnect Concept ___________________________________________________________ 17 2.1.2. Parylene C Deposition Model _____________________________________________________ 21 2.1.3. Test Device Fabrication _________________________________________________________ 26 2.1.4. Testing_______________________________________________________________________ 28 2.1.5. In-Plane Interconnect Conclusion __________________________________________________ 32
2.2. Micro-molded Cannulae for Intracochlear Infusions in Small Rodents ______________ 34
2.3. Interconnect Summary ______________________________________________________ 41
Chapter 3 Flow Control ____________________________________________________ 42
3.1. Hydrodynamics ____________________________________________________________ 43
3.2. Fixed Geometry Valves ______________________________________________________ 47
3.3. Peristalsis _________________________________________________________________ 51
3.4. Conclusion ________________________________________________________________ 53
Chapter 4 Biocompatible Flow Path: Micropump Diaphragms and Channels ______ 54
4.1. Overall Concept (Hard Mask, Diaphragm Framework) ___________________________ 56
4.2. Design ____________________________________________________________________ 57
4.2.1. Chamber Dimensions ___________________________________________________________ 57 4.2.2. Pump Fluidics and Diaphragm Mechanics ___________________________________________ 59 4.2.1. Cross Hatch Pattern (size / frequency) ______________________________________________ 63 4.2.2. Anchors ______________________________________________________________________ 64
4.3. Fabrication _______________________________________________________________ 65
4.4. Diaphragm Deflection And Long Term Test ____________________________________ 67
4.5. Conclusion ________________________________________________________________ 69
Chapter 5 Actuation Mechanism ____________________________________________ 71
5.1. Actuation Types ____________________________________________________________ 71
5.2. Thermal Actuation _________________________________________________________ 75
5.3. Validation of COMSOL Model for Thermal Analysis _____________________________ 76
5.4. COMSOL Model for Air, Wax, and Gallium ____________________________________ 81
5.4.1. Thermopneumatic (Air) _________________________________________________________ 84 5.4.2. Phase Change (Wax) ____________________________________________________________ 85 5.4.3. Exothermic Phase Change (Gallium) _______________________________________________ 86
5.5. Pachygraphical Fabrication of Actuation Devices ________________________________ 89
5.5.1. Materials _____________________________________________________________________ 89 5.5.2. Resistors _____________________________________________________________________ 90 5.5.3. Gallium ______________________________________________________________________ 90
5.6. Test Structure Fabrication ___________________________________________________ 92
Chapter 6 Micropump System Component Integration __________________________ 95
6.1. Fabrication ________________________________________________________________ 96
6.2. Integration _______________________________________________________________ 100
6.3. Testing ___________________________________________________________________ 101
6.4. Conclusion _______________________________________________________________ 106
6.5. Future Work _____________________________________________________________ 107
References ________________________________________________________ 109
Appendix A Parylene C Deposition Model _____________________________________ 116
List of Illustrations
Figure 1-1: Image of murine cochlea for size comparison 4
Figure 1-2: External, wearable, and implantable micropump examples 5
Figure 1-3: Diagram of commercially available implantable osmotic micropump 6
Figure 1-4: Drawing of diaphragm based micropump 7
Figure 1-5: Drawing of gas boundary based micropump 8
Figure 1-6: Drawing of rotary gear based micropump 8
Figure 1-7: Schematic diagram of double charge layer leading to Electro-Osmotic flow 9
Figure 1-8: Schematic Diagram of an electrohydrodynamic pump 10
Figure 1-9: Schematic of a four-chamber peristaltic pump concept 13
Figure 2-1: Out-of-plane fluidic interconnects formed with deep reactive ion etching 15
Figure 2-2: Press-in interconnect with three glass layers 15
Figure 2-3: Press-in PDMS interconnect 16
Figure 2-4: In-plane fluidic interconnect concept 18
Figure 2-5: Potential voids resulting from Parylene C deposition 18
Figure 2-6: Photograph and schematic of Parylene deposition tool 20
Figure 2-7: Measured thickness of Parylene C along the 50-µm wide channel 20
Figure 2-8: Diagram of different molecular interactions within a tapered channel 21
Figure 2-9: Drawing of cross-section (edge view) of characterization device 23
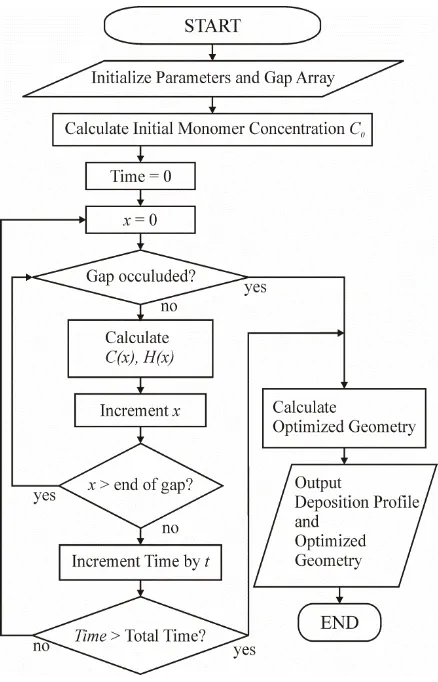
Figure 2-10: Flowchart for the MATLAB simulation of the Parylene C deposition 25
Figure 2-11: Interconnect fabrication process 26
Figure 2-13: Drawing of alignment fixture used to aid insertion 27
Figure 2-14: Optical image of cross-section of Parylene C deposition into interconnect 29
Figure 2-15: Simulation of Parylene C deposition compared to experimental data 29
Figure 2-16: Drawings of leak test set-up 30
Figure 2-17: Drawings of Pull test set-up 31
Figure 2-18: SEM of the side of the microfluidic chip 33
Figure 2-19: Drawings of cannula insertion stops presented in literature 34
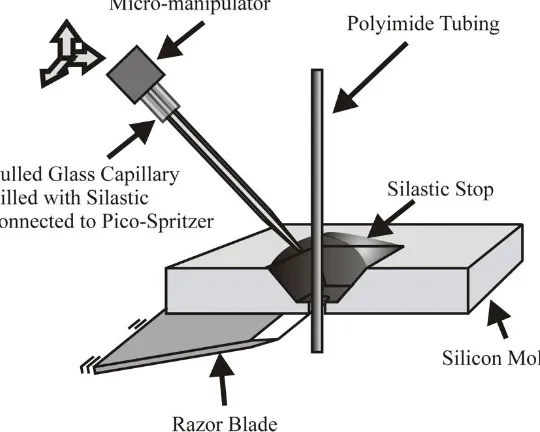
Figure 2-20: Polyimide micro-tubing was inserted through the silicon mold 35
Figure 2-21: Cross-sectional view of the silicon mold fabrication process 36
Figure 2-22: SEM of micro-cannula showing critical dimensions 38
Figure 2-23: Cannulae adhesion measurement setup 39
Figure 2-24: Illustration of cannula insertion into the murine cochlea 40
Figure 2-25: Histological images showing cannula placement 40
Figure 3-1: Diagram of available valve types 43
Figure 3-2: Variation in flow pattern for flow over a cylinder 48
Figure 3-3: Graph of Reynolds number vs. Channel Area 49
Figure 3-4: Drawing of out-of-plane passive check valves 51
Figure 3-5: Sequence of actuation to effect directional pumping 52
Figure 4-1: Techniques for forming Diaphragms 55
Figure 4-2: Three phases of a generic diaphragm pump chamber 56
Figure 4-3: Hard mask and framework concept for in situ diaphragm formation 56
Figure 4-4: Drawing of diaphragm pump chamber 58
Figure 4-5: Pressure drop per cm along rectangular microchannels 60
Figure 4-6: Diagram of parameters for diaphragm deflection 61
Figure 4-7: Graph of the derived deflection diaphragms 63
Figure 4-8: Drawing of the cross-section of a 4 µm diameter Parylene C anchor 64
Figure 4-9: Micrographs of TEOS SiO2 patterned for Channel etching 65
Figure 4-11: Illustration of cross-section of test fixture for testing diaphragm deflection 66
Figure 4-12: Membrane deflection images and graph 67
Figure 4-13: Drawing of the long- term test set-up 68
Figure 4-14: SEM images Parylene C Diaphragm 69
Figure 4-15: SEM image showing fluidic chamber under Parylene C Membrane 69
Figure 5-1: Drawing of Magnetohydrodynamic micropump 72
Figure 5-2: Schematic diagram of double charge layer leading to Electro-Osmotic flow 73
Figure 5-3: Illustration of cross-section of phase-change material actuated peristaltic pump 74
Figure 5-4: Drawing of heater plenum and pump-chamber 76
Figure 5-5: Graph showing the air temperature and power v plenum volume 78
Figure 5-6: Schematic of MATLAB model to simulate thermal dissipation 79
Figure 5-7: Graph of Simple Heat Dissipation Model 81
Figure 5-8: Overlapping heat cycles to achieve peristalsis in four-chamber pump 82
Figure 5-9: Drawing of a single actuator from COMSOL model 83
Figure 5-10: Heat calculations from COMSOL simulation 83
Figure 5-11: Volumetric expansion of wax 84
Figure 5-12: Graph of heating/cooling cycles for two wax-filled chambers 85
Figure 5-13: Phase diagram of Gallium Indium alloys 86
Figure 5-14: Graphs of thermal cycle and heat pulse signals 87
Figure 5-15: Images of micro-contact molded gallium ingots 90
Figure 5-16: Images of micro-contact mold process 90
Figure 5-17: Cross-sectional diagram of Gallium actuator over diaphragm chamber 91
Figure 5-18: Current source circuit 92
Figure 6-1: Drawing of a four-chamber peristaltic pump concept 94
Figure 6-2: Micropump fabrication process 96
Figure 6-3: Fabrication process for peristaltic pump 97
Figure 6-4: Photograph of pump with plena and capillary tubing 98
Figure 6-6: Schematic drawing of peristaltic heater control circuit 101
Figure 6-7: Heater current control signals 102
Figure 6-8: Experimental setup for gallium thermal actuation peristaltic pump 103
Figure 6-9: Time-lapse photographs of the fluid front passing over a ruler 103
Figure 6-10: Pumped Fluid Volume for the Four Chambers of the Pump 104
Figure 6-11: Graph of pump rate by actuation frequency compared to calculated values 105
Figure 6-12: Hot wire anemometry 107
Figure A-1: Experimental setup to measure Parylene C deposition in straight channels 116
Figure A-2: Drawing of the tapered channel system 117
Figure A-3: Model data compared with measured thicknesses for 5 mtorr deposition 119
List of Tables
Table 1-1: Implantable Micropump Design Targets __________________________________________ 12
Table 2-1: Flow Regimes _______________________________________________________________ 22
Table 2-2: Parameters used to determine the mean free path, the Diffusion Constant, Flux, and C0 _____ 22
Table 2-3: Simulation Variables and Constants ______________________________________________ 26
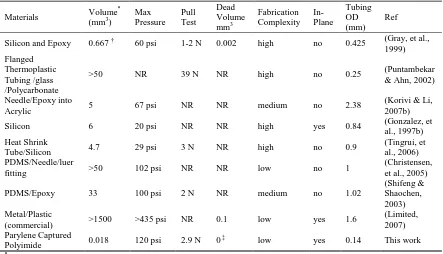
Table 2-4: Comparison of Microfluidic Interconnect Devices ___________________________________ 32
Table 3-1: Laminar vs. Turbulent flow by Reynolds number ranges ______________________________ 45
Table 3-2: Variables to Determine Reynolds number, Re ______________________________________ 48
Table 3-3: Actuation Sequence to Achieve Peristalsis _________________________________________ 51
Table 4-1: Fluid Resistance and ∆P by Fluidic Feature for Various Flow Rates ____________________ 59
Table 4-2: Calculation of Compression Ratio, , and Pressure Change, PD _______________________ 60
Table 4-3: Constants used to calculate the Diaphragm Deflection _______________________________ 62
Table 5-1: Micropump Actuation Mechanisms ______________________________________________ 72
Table 5-2: Parameters for calculating the heat and energy for thermopneumatic actuation ___________ 78
Table 5-3: Calculated Values for Thermopneumatic Actuation __________________________________ 79
Table 5-4: Calculated Efficiency of Actuation Material by Flow Rate ____________________________ 89
Chapter 1
Introduction
The problems of deafness are deeper and more complex, if not more important, than those of blindness. Deafness is a much worse misfortune. For it means the loss of the most vital stimulus--the sound of the voice that brings language, sets thoughts astir and keeps us in the intellectual company of man.
Hellen Keller
Advanced hearing loss and deafness therapies that improve auditory function will
require carefully timed and dosed, site-directed delivery of multiple therapeutic
compounds throughout an extended test period. Deafness research involving
intracochlear delivery of therapeutic agents has been limited to acute experiments with
syringes and infusion pumps, and chronic, single compound experiments with
implantable osmotic pumps. Syringe and osmotic pumps have proven effective for
baseline lab investigations in animal models (Brayden, Oudot, & Baird, 2010; Sefton,
1987), but lack the flexibility required for more sophisticated therapy development. A
review of intracochlear drug delivery mechanisms by (Borkholder, 2008) concludes that
these animal studies have shown significant variability in treatment effectiveness and
impact to cochlear function with the drug delivery profile a prominent factor impacting
success. An implantable micropump, which provides a means of controlling flow rates
and durations, will allow for the required delivery profile flexibility. In this work,
integration technologies have been developed to enable the low implant volume and low
1.1.
Auditory Dysfunction Therapy Development
Damage to the cochlea or to nerves leading from the inner ear to the brain causes
sensorineural hearing loss (SNHL). According to the American
Speech-Language-Hearing Association, SNHL rarely responds to current medical or surgical therapies.
SNHL accounts for 90% of permanent hearing loss and is therefore the most common
type affecting approximately 10% of the population and more than half of those over
65 years (URMC, 2012). Hearing loss is the primary communication disorder, is one of
the top three chronic medical conditions in the elderly, and is a major factor determining
function in these older adults (NIDCD, 2012).
Current treatments for hearing loss include cochlear implants or hearing aids, which
address the symptom by amplifying sound, but they do not address the biological basis
for the hearing loss and have limited efficacy. There are many bases for hearing loss,
such as hair cell damage from age, noise damage, or medications, and each cause may
require individualized targeted therapy. Many groups are working hard to find these
biological bases, which will lead to the use of gene, stem cell, and pharmaceutical based
therapies for auditory dysfunction. Gene based therapies have the potential to not only
ameliorate but even cure some forms of auditory dysfunction. These therapies may be
delivered through systemic application (e.g. oral or injections), or site directed delivery.
Systemic approaches have disadvantages such as requiring large amounts of
compounds to deliver small amounts to target areas, effects on non-target systems, and
difficulty in controlling dose profile (dose profile can be affected or controlled by
metabolism and/or blood circulation). The work of (Nuxoll & Siegel, 2009) concludes
that success of therapeutic treatments require site directed delivery along with ‘proper
temporal presentation’. Site directed therapies use only what is needed at the target site
and allow the delivery system to control the dose profile, improving efficacy and
reducing systemic side effects. By targeting the cochlea, auditory hair cells have been
successfully regrown in guinea pigs via intracochlear Atoh1 gene infusion (Izumikawa et
al., 2005). This experiment highlights the importance of site directed delivery of
1.1.1. Site-Directed Delivery
The site-directed delivery of curative agents with controlled dose profiles has had an
important impact on the quality and success of disease treatment (Borkholder, 2008).
(Akil et al., 2012) have used gene therapy to restore hearing to deaf mice, a mouse model
of congenital deafness in humans. Delivery was accomplished with microinjections into
the cochlea either via an apical cochleostomy, or through the round window membrane.
This study shows the potential benefits of site-directed delivery for deafness research.
Therefore, therapy development for deafness research will likely require delivery directly
to the cochlea. The optimization of these therapies will involve delivery of multiple
agents with flow rates and durations optimized for maximum effect. This can be
accomplished only with animals tethered to a syringe as described in (Carson et al., 2002;
Sclafani & Glendinning, 2003) or with an implantable pump technology, which allows
user control of rate and duration of delivery. Implantable pumps have the advantage of
allowing the animals to recover, providing the ability to perform chronic studies, whereas
the syringe pumps allow only acute studies.
1.1.2. Mouse Model System: Benefits and Challenges
Researchers primarily use rats, chinchillas, and guinea pigs for inner ear research
(Swan, Mescher, Sewell, Tao, & Borenstein, 2008). The main benefit of using these
animal models is their larger size as they are easily handled and surgical approaches to
access the cochlea are routine, and the larger cochlear volumes make fluidic access
easier.
Two of the benefits of using the mouse model are that its genome is fully mapped and
transgenic mice are available to model human disease in a controlled model system for
therapy development. Transgenic technology has enabled researchers to study gene
function and to model human diseases, enabling the in vivo study of the effect of various
genes on auditory function. For example (Schütz et al., 2010) studied human bilateral
middle/high-frequency hearing loss by using transgenic mice and have used transgenic
mice to replicate mutation in the GJB2 and GJB6 genes, the most common cause of
prelingual deafness in humans not associated with a syndrome. Inbred mouse strains have
been identified as models of deafness and presbycusis, hearing loss that occurs gradually
anomaly that causes deafness in humans allows researchers to target this type of deafness
with gene therapy.
The capacity to study diseases that affect humans in transgenic and mutant animals
make the mouse a more desirable animal model than larger animals, such as the guinea
pig. However, due to the very small size of the mouse inner ear, 620 nL perilymph
volume (Thorne et al., 1999), developing effective, controlled infusion systems for in
vivo hearing therapy studies is quite challenging. Surgical approaches and fluidic
interfacing with the mouse cochlea as in (Kawamoto, et al., 2001) are difficult due to the
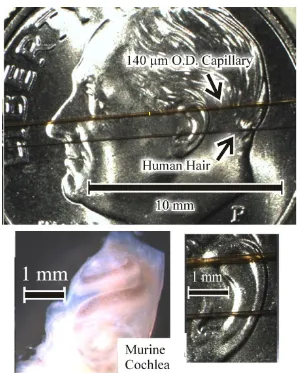
small size of the cochlea (see Figure 1-1).
[image:18.612.174.471.277.650.2]The challenges with using the small mouse model for auditory dysfunction therapy
Figure 1-1: Image of murine cochlea for size comparison.
development include the difficulty in precisely interconnecting the delivery system with
the small fluid chambers in the cochlea, avoiding damage to residual hearing, and
providing low flow rates into these chambers so that the delivered fluid does not
overwhelm the compliance of the inner ear causing damage leading to hearing loss. The
low flow rate delivery of fluid required to avoid hearing damage can be accomplished via
micropumps.
1.2.
Micropumps in Biological Systems
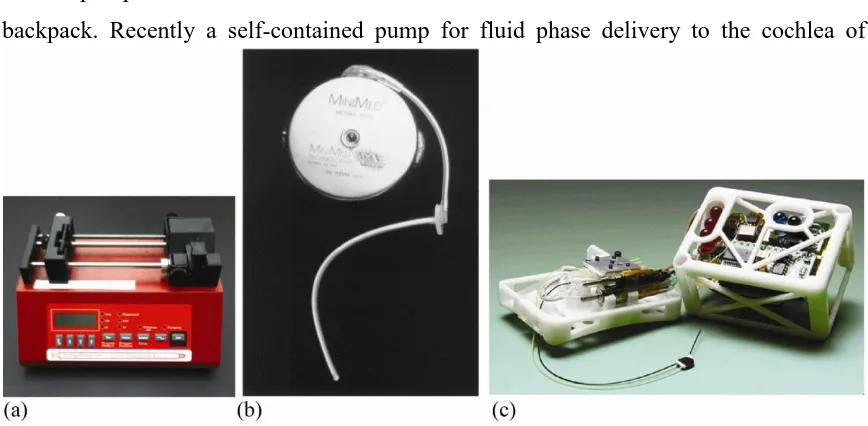
Micropumps used in biological systems can be categorized by their placement
relative to the animal. Figure 1-2 shows three types of micropumps, external devices (a),
implantable (b), and wearable (c). External devices are attached only by the cannulae and
any wiring required for monitoring the animals. Devices in this class, which includes
syringe pumps, are often quite large and have power requirements, which may necessitate
that the device be plugged into the building’s power supply. One of the main limits of the
external devices is that it can reduce the length of time an experiment is run as the animal
must be sedated or held during the infusion.
Wearable pumps are still external to the animal but the fluid reservoir, controls, power,
and the pump itself are attached to the animal and are either mounted to the head or in a
[image:19.612.107.541.431.644.2]backpack. Recently a self-contained pump for fluid phase delivery to the cochlea of
Figure 1-2: External, wearable, and implantable micropump examples.
(a) Photograph of syringe pump available from New Era (New Era Pump Systems, Inc. Farmingdale, NY)
(b) Implantable insulin pump available from MiniMed (Medtronic, Northridge CA, USA), this device measures 8.1 cm diameter x 1.9 cm thick.
guinea pigs has been developed (Fiering et al., 2009) but the reported size of 83.6 cm3 is
much too large for implantation into mice who are typically less than 10 cm long. The
size of this device is even too large for a mouse backpack.
Implantable micropumps are also self-contained with the entire device being implanted
in vivo, with either subcutaneous or intraperitoneal implantation. In large animals the
pump, electronics, and fluid reservoir may be implanted at a single location with drug
delivered to the target site through a long cannula. In smaller animals, the reservoir and
pump may need to be implanted in separate locations due to size restrictions. In these
cases, the sub-systems are connected via cannulae. Implantable micropumps have been
used successfully in humans for system wide delivery of a variety of pharmaceutical
agents including insulin and other therapeutic compounds (Sefton, 1987).
Implantable pumps approved for human use utilize compressed Freon gas (Abe et al.,
1990), osmotic pressure (Eckenhoff, 1981), or solenoids (Carlson, Bair, & Gaona, 1982)
for pumping but are too large for use in small animal models (Dash & Cudworth, 1998).
Osmotic pumps are commonly used for inner ear drug delivery research.
1.2.1. Use of Implantable Micropumps for Auditory Dysfunction Therapies
Reviews of inner ear drug delivery methods, (Pararas, Borkholder, & Borenstein, 2012;
Swan, et al., 2008) report that only osmotic pumps are currently in use for auditory
applications. Commercially available osmotic pumps, such as the Alzet osmotic pumps
(DURECT Corporation, Cupertino, CA) have been used widely in murine research. The
principle by which osmotic
pumps work is straight forward,
therefore the pumps can be
simple. A concentration of
sodium chloride inside the
pump’s semipermeable outer
membrane pulls fluid into the
device causing it to expand. This
in turn pressurizes an inner
flexible reservoir pushing fluid
Figure 1-3: Diagram of commercially available
implantable osmotic micropump.
out of the pump through a flow moderator to the delivery portal (see Figure 1-3).
Implantable osmotic pumps have two major shortcomings: they are single use devices
and cannot be refilled, and the manufacturer sets their pump rate. These single use
devices provide a fixed flow rate over a known duration, and lack user-control of the
pump rate. As stated above in Section 1.1.1, development of disease treatments requires
controlled dose profiles; therefore osmotic pumps will be of limited utility. External
devices will also have limited utility due to the restrictions on the length of the
experiments and wearable devices currently in use are still too large for use with the
mouse model. Since no current implantable pump meets the requirements for
subcutaneous implantation in the mouse model for variable rate chronic experimentation,
a new micropump is needed to meet this unique set of criteria.
1.2.2. Types of Micropumps
Micropumps can be divided into two groups based on the means of transferring
momentum to the pumped fluid: mechanical displacement and dynamic
(non-mechanical). Mechanical displacement pumps transfer momentum to the fluid with a
periodic change of the volume in a fluid filled chamber while dynamic pumps act on the
fluid directly relying on specific properties of the fluid. The momentum transfer in
mechanical microelectromechanical systems (MEMS) micropumps can be carried out via
deformable diaphragms (Feng & Kim, 2005; Nisar, et al., 2008; Ok Chan & Konishi,
2007), gas boundary (Rahman, et al., 2000), or with rotary motion (Ghalichechian,
Modafe, Beyaz, & Ghodssi, 2008;
Waldschik & Buttgenbach, 2010).
Diaphragm based pumps
consists of an inlet and outlet, a
pump chamber covered with a
flexible diaphragm, and an
actuation mechanism above the
diaphragm (see Figure 1-4).
Momentum is transferred from the
actuation mechanism to the fluid
[image:21.612.283.541.503.626.2]in the underlying chamber via the
diaphragm. The diaphragms are
made to reciprocate to move fluid
out of the diaphragm chamber.
Valves at inlet and outlet are
required to control fluid flow
directionality.
Gas boundary based pumps
operate in a similar fashion to the
diaphragm based pumps in which
the diaphragm is replaced with a
gas/liquid boundary (see
Figure 1-5). A heater above the
pump chamber expands a gas bubble into the underlying pump chamber. This moving
boundary moves the fluid out to the fluid port. Valves at the inlet and outlet are required
to control fluid directionality as in the diaphragm based pumps.
Rotary gear based micropumps consist of two meshing gears, a gear housing with gear
hubs, and a fluidic channel directing the fluid to and from the meshing gears (see
Figure 1-6). The gears drag fluid along the outer walls of the gear housing pushing it
through the pump channel.
Microscale rotary pumps are
complex and prone to failure with
frictional forces being the limiting
factor to their reliability (Meng,
Zhang, Huang, Li, & Chen, 2009).
Diaphragms offer greater flexibility
for the selection of actuation
mechanism over gas boundary and
rotary pumps and will allow for a
less complex fabrication process.
Figure 1-5: Drawing of gas boundary based
micropump.
(a) Top figure shows cooled heater, (b) when heated, a gas bubble forms and expands into the pump chamber forcing fluid out. Valves can be used to control the directionality of the flow. Gas boundary based pump. Adapted from (Rahman, Ahmed, Zhao, & Gong, 2000)
Figure 1-6: Drawing of rotary gear based micropump.
A variety of dynamic pumps,
electrohydrodynamic (EHD)
micropumps, have been used
for fluid delivery. For example:
electrophoretic (L. Chen, Lee,
Choo, & Lee, 2008);
electrolytic (Daniel A. Ateya,
Ashish A. Shah, & Susan Z.
Hua, 2004); electro-osmotic
(Prakash, Grissom, Rahn, &
Zydney, 2006; Seibel, Scholer,
Schafer, & Bohm, 2008); and
EHD injection pumps, utilizing
ion-drag pumping, (C.-L. Chen
et al., 2007) have been presented.
Electoosmotic pumps rely on the effects of a double charge layer in the microchannels
(see Figure 1-7). Negative ions are drawn to the channel surface forming the inner layer
and positive ions in the fluid diffuse towards the negative charge forming the diffuse
layer. A voltage applied along the length of the channel moves the ions in the diffuse
layer from the anion to the cation dragging bulk liquid by viscous forces.
Electrohydrodynamic ion-drag pumps consist of pairs of permeable electrodes
(emitter/collector) in contact with the fluid to be pumped. Electrons are emitted from one
electrode dragging the fluid via frictional forces. The pumping force of the device can be
increased with repeated patterns of emitter/collector electrodes along the wall of the
channel (see Figure 1-8).
These dynamic actuators place specific requirements on the pumped fluid and therefore
are not often used in drug delivery systems where these conditions cannot be met. For
example, electrohydrodynamic (EHD) pumps; electrophoretic (L. Chen, et al., 2008),
electrolytic (D. A. Ateya, A. A. Shah, & S. Z. Hua, 2004), and electro-osmotic (Prakash,
et al., 2006) require the use of dielectric liquids. This puts a severe restriction on the
compounds the pump is capable of delivering. EHD injection pumps require fluids with
Figure 1-7: Schematic diagram of double charge layer leading to Electro-Osmotic (EO) flow.
specific permittivity and conductivity (C.-L. Chen, et al., 2007), which again limits the
delivered fluids.
Since dynamic actuators restrict the materials that may be pumped, only mechanical
pumps will be considered. Of the mechanical pumps discussed, diaphragm, gas boundary,
and rotary, diaphragm offers the most options for low-complexity construction; therefore
a diaphragm pump will be used for fluid motivation for this implantable micropump.
1.2.3. Material Selection for Implantable Micropump Components
The basic elements of the presented micropump are the cannulae, cannula stops, flow
channels, pump chambers and diaphragms, actuation unit, and the substrate. The function
of these elements needs to be considered when determining the material to use for
constructing each. Some elements require flexibility, some need rigidity, some the ability
to be formed in a complimentary metal-oxide semiconductor (CMOS) like process, some
by molding.
All material chosen for an implantable system must either be biocompatible or it has to
be isolated from the biological system. Rather than test the micropump for
biocompatibility, the presented microsystem achieves biocompatibility by using only
biocompatible materials where there is contact between the biological system and the
device. Many materials are already classified as biocompatible, so choosing these
materials is an obvious first step for an implantable micropump. These include polyimide,
Silastic®, and Parylene C. Materials that may have issues with biocompatibility and are
therefore candidates for encapsulation in other biocompatible materials include
UV-curable resin, silicon, and aluminum.
Figure 1-8: Schematic Diagram of an electrohydrodynamic (EHD) pump.
Cannulae are biocompatible flexible tubing strong enough to resist kinking. Polyimides
are high temperature engineering polymers developed by DuPont. Compared to most
other organic or polymeric materials, polyimides exhibit an exceptional combination of
thermal stability (>500°C), mechanical toughness, and chemical resistance. They can be
used for fluidic interconnects between modules, cannulae for intracochlear infusions,
stress buffers, and are commercially available as micro-tubing (Microlumen, Tampa, FL).
Cannula insertion stops need to be formed around the end of the polyimide tubing with
a biocompatible material. Silastic®, Medical Grade Elastomer MDX4-4210, is a moldable
two-part silicone with a tensile strength of 650 psi. Silastic® is easily mouldable to fit
many needs. Probes have used Silastic® to bundle and insulate electrodes to deliver
charge to cochlear neurons (Richardson et al., 2009). Polymers have also been formed
using injection molding techniques for porous implants (Hongbin, Krampe, Schlicht, &
Wintermantel, 2009).
Parylene C (chlorinated poly-para-xylylene) can provide a pseudo-conformal, pin-hole
free coating. It coats in a near conformal manner due to its long mean free path (MFP)
~1 mm (Mori & Mizutani, 1992). This makes it a good encapsulation material and there
are available adhesion promoters and inhibitors so it can be made to adhere selectively.
The substrate for the micropump needs to be easily engineered and machined through
common CMOS/MEMS processes. Silicon meets these requirements and can be used
unencapsulated without fear of contamination.
1.3.
Objectives
The commercially available osmotic pumps are limited to use for one-time infusions at
constant rate set by the manufacturer. The smallest of the Alzet pumps recommended for
use in the mouse model has an implant volume of 500 mm3. The size of the presented
pump with actuation, therefore, was constrained to less than 500 mm3.
Pump rate and backpressure requirements were taken from those used in the literature.
(Z. Chen, Mikulec, McKenna, Sewell, & Kujawa, 2006) reported an infusion rate of
1 µL/hour (16 nL/min) to the cochlea in the mouse via a basal turn cochleostomy.
(Borkholder, 2008) reported infusion rates of 16 nL/min and 32 nL/min via basal turn
endolymphatic pressure in guinea pigs of 2.5 mm Hg to 4 mm Hg (0.33 kPa to 0.53 kPa)
(Inamoto, Miyashita, Akiyama, Mori, & Mori, 2009) was used as an estimate for the
pressure in the mouse model cochlea (no measurements have been done to date in mice).
At a minimum, therefore, the pump will need to be able to pump against the 0.53 kPa
of backpressure plus the pressure drop in the fluidic system at a rate between 1 nL/min
and 100 nL/min. The diaphragm and pump chamber dimensions were designed for
low-flow-rate pumping (1 nL/min to 100 nL/min) against a backpressure of 5 kPa (to allow
for pumping in other biological systems). An implantable, variable flow micropump
platform has been developed, using MEMs technologies, specifically for intracochlear
drug delivery in the mouse model for deafness therapy research. This micropump will
enable chronic, calibrated delivery of therapeutic agents that is not possible with existing
pump technologies. Needs for this application diverge from those commonly pursued in
MEMS based micropumps, specifically: accurate delivery of therapeutic agents at nL/min
flow rates; interface to target biological structures; a non-reactive, non-water absorbing,
biocompatible flow path; and system form factor consistent with subcutaneous
implantation in mice. Implantation requires low power, low-voltage to protect the animal
in cases of insulation failure. Table 1-1 lists the design targets that will enable the
creation of this micropump.
Figure 1-9 is a conceptual drawing of an implantable system incorporating these
technologies. To address these unique requirements, several key integration technologies
have been developed: low-volume in-plane fluidic interconnects (Chapter 2),
micro-molded cannula stops (Chapter 2), flow control (Chapter 3), in situ pump diaphragm
formation over Parylene C coated fluidic micro chambers and channels (Chapter 4), and
integration of a low voltage, low-power actuation mechanism (Chapter 5). The final
chapter discusses pump integration, testing, and future work.
Table 1-1: Implantable Micropump Design Targets
Characteristic Design Target for Presented Micropump
Device volume < 500 mm3
Flow rate range 1 nL/min to 100 nL/min.
Back pressure 5 kPa
.
Figure 1-9: Schematic of a four-chamber peristaltic pump concept.
Integration of cannula stops, interconnects, microfluidic channels, micropump, and actuation mechanism will be described in this work. Pump chip designed to be
Chapter 2
Fluidic Interconnects
Civilization grew in the beginning from the minute that we had communication -- particularly communication by sea that enabled people to get inspiration and ideas from each other and to exchange basic raw materials.
Thor Heyerdahl
Implantable microfluidic systems for inner ear dysfunction therapy research require
fluidic coupling to the inner ear. For the pump technologies being considered here, there
are two varieties of interconnects. The first is the interconnect to the implantable
microsystem via a cannula and the second is the interconnect of the cannula to the murine
cochlea or other targeted biological system.
2.1.
In-Plane Biocompatible Microfluidic Interconnects for
Implantable Microsystems
In space-constrained applications such as implantation into the human mastoid cavity,
or subcutaneous implantation in small animals, the form factor and volume of the fluidic
interconnects is of critical importance. Coupling to microfluidic systems is generally
achieved with fluidic ports formed with hard polymers, metal, or silicon or by coupling
into soft polymers like polydimethylsiloxane (PDMS).
Examples of silicon and hard polymers are described by (Gray, et al., 1999) who
present interconnect technologies using deep reactive ion etching (DRIE) of silicon along
with silicon fusion bonding (SFB) and anodic bonding to create multilevel fluidic chips.
The process utilized a stack of three silicon wafers and an additional glass layer (see
Figure 2-1). The top wafer was patterned with DRIE and bonded to a second wafer,
micromachining before a
final SFB. A layer of glass
is anodically bonded to the
bottom wafer forming the
microfluidic channels. The
capillary tubing,
out-of-plane, is held in place with
either a plastic press fitting
or by the use of adhesive.
(Puntambekar & Ahn,
2002) presented a press-in
out-of-plane interconnect
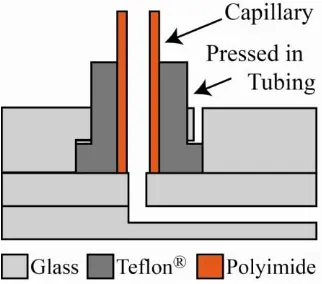
with three layers of glass (see Figure 2-2). Two layers of drilled glass are bonded together
using direct glass-glass fusion bonding. A third etched glass layer is bonded to form
microchannels. The device was heated to 583K (310 ºC), Teflon® tubing pressed into the drilled interconnect, with a solid insert keeping the tubing open. The plastic tube spreads
into the widened bottom of the inlet hole forming a
flange. Other examples of fluidic ports formed with
hard polymers, metal, or silicon include those
presented by (Gonzalez, Collins, & Smith, 1997a;
Korivi & Li, 2007a; Tingrui, Baldi, & Ziaie, 2006).
Soft polymer interconnects using similar
structures have been presented by (Christensen,
Chang-Yen, & Gale, 2005; Shifeng & Shaochen,
2003) (see Figure 2-3). Holes are punched
vertically or horizontally into a layer of PDMS
with a punch of the same diameter as the tubing to
be held. The diameter of the punched hole is
smaller than the punch due to the flexibility of the
[image:29.612.371.532.405.547.2]PDMS such that the tubing is held in place.
Figure 2-1: Out-of-plane fluidic interconnects formed with deep reactive ion etching.
Top wafer is patterned with DRIE, SFB to second wafer, which is then ground and etched, a final SFB and DRIE are performed on the bottom wafer. Anodic bonding of a glass layer on the bottom forms the fluidic channels. Adapted from (Gray et al., 1999)
Figure 2-2: Press-in interconnect with three glass layers.
Direct glass-glass fusion bonding is used to form microchannels. Device
heated to 310 ºC, Teflon® tubing
pressed into etched interconnect, with solid insert keeping its form during pressing. The plastic tube spreads into the widened bottom of the inlet
hole (flanged). Adapted from
For medical implant
applications, additional coupling
structures and out-of-plane
approaches add unacceptable
volume. In-plane interfaces offer
the potential to significantly
reduce overall fluidic interconnect
volume but often require complex
processing (Gonzalez, Collins, &
Smith, 1997b) or are incompatible
with small diameter tubing (<150 µm OD) (Limited, 2007). Coupling approaches relying
on adhesives (epoxies and elastomers) can result in either blocked capillaries (Gray, et
al., 1999) or gap formation and dead volumes depending on the material viscosity and
gap widths.
Existing microfluidic interconnect technologies fail to reliably meet the combined
space and biocompatibility requirements of implantable microsystems that are needed for
many clinical applications and for use in small animal model systems such as mice. A
method for coupling fine capillary tubing to microfluidic channels is needed to provide
low-volume biocompatible interconnects exiting in-plane with the pump.
Here a robust interconnect technology is presented requiring only a single mask level
and deposition of Parylene C (chlorinated poly-para-xylylene) onto room temperature
surfaces to capture small diameter capillary tubing. Parylene C provides the requisite
controlled deposition of a sealing material into the small spaces between the capillary and
microfluidic channel. It is an attractive material for biomedical fluidic interconnects due
to its biocompatibility and chemical resistance (Licari, 2003). Parylene C has been used
for conformal coating (Cosens, 1983), pore-filling (Cale, Bae, Jezewski, & Senkevich),
microchannel formation (Hong-Seok, Yong, & Hesketh, 2004), and channel penetration
(Broer & Luijks, 1981; Grytsenko & Tolstopyatov). Polyimide, USP Class VI compliant,
has been used for implants as medical probes (Metz, Bertzch, Bertrand, & Renaud, 2004),
and microchannels (Lacour et al., 2008) and is well suited as small diameter tubing for
use as cannulae (Komaromy, Varner, de Juan, Acland, & Aguirre, 2006) in the implanted
Figure 2-3: Press-in PDMS interconnect.
microsystems targeted in this work. This section presents the interconnect concept,
modeling, fabrication, and testing with emphasis on added interconnect volume, dead
volume, resistance to leakage from internal pressure, and robustness to applied force on
the extending capillary. Characterization of Parylene C deposition into channels was used
in conjunction with equations describing molecular flow and diffusion to spatially model
monomer concentration and polymer deposition within tapered channels. This model,
implemented in MATLAB, permitted rapid optimization of channel geometries for full
gap filling without voids at the tubing / channel interface. This approach was significantly
faster and less computationally intensive than the traditional Monte-Carlo simulations to
predict Parylene penetration into trenches and crevices (Bowie & Zhao, 2004; McVittie
et al., 1991; Tolstopyatov, Yang, & Kim, 2002).
Device fabrication is described with testing on several designs bracketing the predicted
optimum channel dimensions. Testing includes measurement of deposited Parylene C and
void characterization along the length of the interconnects, burst / leakage pressure, and
pull-strength. These results, along with overall interconnect volume, dead volume, and
fabrication complexity, are compared against commercial and other research devices.
2.1.1. Interconnect Concept
The microfluidic interface consists of capillary tubing inserted in-plane into the
widened end of an on-chip microchannel. The tubing is held in place with a deposition of
Parylene C, which polymerizes into the space between the capillary tubing and the
microchannel and effectively secures the tubing. The gap between the capillary and the
microchannel walls is designed to be tapered such that the entire gap will be filled with
the polymer before occluding. The entire device is simultaneously encapsulated in
Parylene C, enhancing device biocompatibility. Figure 2-4 is an illustrative diagram of
the interconnect concept showing the capillary tubing coupled directly to a microchannel
in a glass-covered silicon wafer. The long mean-free path of Parylene C during
deposition (20 °C, 42 mtorr) allows penetration into micro-gaps resulting in a
pseudo-conformal coating with deposition thickness decreasing with depth inside the micro-gaps
(Broer & Luijks, 1981; Ramachandran, Junk, Koch, & Hoffmann, 2007). The channel
shape was designed to leverage this effect such that the narrow region at the tip of the
the potential for dead volumes. Continued Parylene C deposition filled the space between
the capillary tubing and the microchannel, effectively securing the tubing in place. A
model of this polymerizing deposition was created to design the interconnect channels
with optimal width and taper for complete fill without creation of voids and dead
volumes.
Figure 2-5 is a drawing of capillary tubing inserted 500 µm into the channel and shows
the two types of voids that may occur with this design. The first (void type 1) results from
a channel taper that is too broad
and occludes at the
tubing/microchannel interface
leaving a void at the channel
entrance. This void is not in
contact with the fluid flow path
and would not contribute to
dead volume, but could affect
pull-strength or burst tests. The
second (void type 2) results
from a channel taper that is too
narrow and occludes at the
channel entrance resulting in
dead volume at the
Figure 2-4: In-plane fluidic interconnect concept.
(a) 140 µm OD polyimide tubing is inserted 500 µm into tapered channel end, 215 µm wide at opening. (b) Top view showing designed gap taper in red. Parylene C will fill this gap while encapsulating the entire device. not drawn to scale.
© 2011 IEEE. Reprinted, with permission, from (Johnson, et al., 2011)
Figure 2-5: Potential voids resulting from Parylene C deposition.
Gap between polyimide tubing and Si microchannel provides an opportunity for void formation. Voids of type 1 result from a taper angle that is too large and requires additional polymer deposition. Voids of type 2 result from a taper angle that is too small and creates dead volume. The 70-µm gap between the channel wall and the tube at the channel entrance is typical for the interconnects.
tubing/microchannel interface. Dead volume is a concern for implantable microfluidic
systems for drug delivery where precise measurement of delivered fluids is important and
fluid exchange may be required. Unswept volumes, areas of stagnation within the flow
path, are not as critical as dead volume for these applications and fabricated
interconnects.
This simple processing method can provide a low volume, low dead volume
interconnection between the capillary tubing and the microchannel while encapsulating
the entire device with a biocompatible, chemical resistant material. Unswept volumes are
minimal, being dictated by the wall thickness of the capillary tubing.
Two types of devices were created to develop and verify the deposition model. The
first were characterization devices used to test very narrow straight channels and
consisted of glass and silicon that were fabricated with isotropically etched constant
width channels (50 µm). The glass and Si were clamped together to enable easy
separation for deposition thickness measurement. The deposition of Parylene C into these
narrow constant-width channels was characterized to gain an understanding of the
deposition profile and used to develop a heuristic model.
The Parylene C was deposited into the narrow characterization channels, using a
deposition system fabricated locally at Rochester Institute of Technology (see
Figure 2-6), the silicon and glass were separated, and the thickness of the deposited
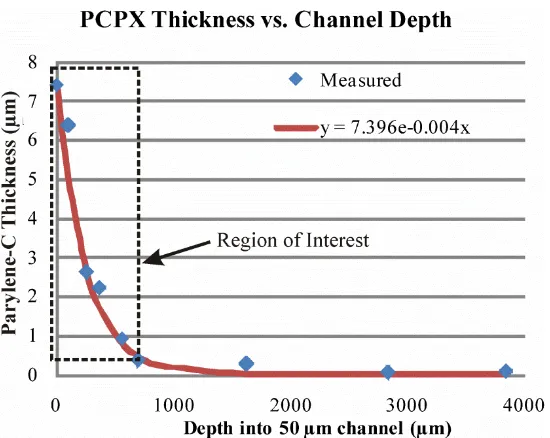
polymer was measured with a profilometer. Characterization of Parylene C channel
penetration (see Figure 2-7) demonstrated a reduction in deposition thickness with depth
into the channel consistent with results presented by (Broer & Luijks, 1981) for 56-µm
channels. This initial characterization data indicated that constant width channels would
not be completely filled with polymer, and that channels with tapered ends would need to
be designed to facilitate tubing capture and gap occlusion. The second device type
contained tapered channels that more closely mimicked the geometry of the interconnects
Figure 2-6: Schematic and photograph of Parylene deposition tool. Parylene C dimer (loaded into the evaporator) is evaporated (at up to 175 °C) into the furnace where it is cracked into monomers. The monomer flows into the room temperature deposition chamber. Pressure is maintained during deposition by controlling the heat of the evaporator, increasing the temperature when the chamber pressure drops and lowering the temperature when pressure becomes too high.
Figure 2-7: Measured thickness of Parylene C along the 50-µm wide channel.
Shown with exponential curve fit y = 7.396x10-0.004x
2.1.2. Parylene C Deposition Model
A model was developed to simulate the deposition of the Parylene C inside the tapered
channels. The behavior of the Parylene C monomers is dependent on the type of
interactions within the interconnect gap as shown in Figure 2-8. The monomers can (a)
interact with other monomers or (b) with the gap walls. They can adsorb directly on the
channel walls, (c) polymerize to an existing polymer at the adsorption site, or (d)
continue to migrate along the surface until they arrive at another polymerization site. The
sticking coefficient, 1/N, is the probability that a monomer striking the wall will lead to
adsorption, where N is the average number of wall strikes a monomer experiences before
being permanently adsorbed.
The governing equations for polymer deposition in tapered channels will depend on the
transport regime of monomers in the system. The Knudsen number, which is the ratio of
the mean free path to the characteristic length in the system, characterizes the monomer
transport as shown in Table 2-1. For low Knudsen numbers, the mean free path of the
monomer is much smaller than the dimensions of the system and intermolecular
interactions predominate. High Knudsen numbers indicate wall / molecule interactions
will predominate. In this work, the characteristic length is defined by the width of the
gaps around the polyimide tubing. The mean free path, calculated using (2-1) and the
Figure 2-8: Diagram of different molecular interactions within a tapered channel.
(a) Monomer-monomer interaction (b) Monomer-wall
parameters for this deposition configuration in Table 2-2, is 1.47 mm.
(2-1)
The openings in this work are less than 100 µm, Kn > 14.7, therefore the transport of
the Parylene C monomer is in the free molecular regime, Knudsen flow, where
intermolecular collisions may be ignored. This result agrees with the work by (Broer &
Luijks, 1981), which states that the deposition due to molecular flow dominates that of
viscous flow for a system of similar dimensions and pressures. The long mean free path
of Parylene C at the deposition pressure of 42 mtorr (10 mtorr Parylene C partial
pressure) makes interactions between molecules a rare event and does not affect the
deposition equations. This, along with a low-sticking coefficient, allows the monomers to
penetrate deeply into the channels before adsorbing onto the walls.
The spaces between the capillary tubing and the hemispherical microchannels are
roughly triangular as seen in Figure 2-9 and the deposition is modeled as a one
dimensional diffusion problem. A diffusion coefficient is calculated using the same form
factor as a Knudsen coefficient (2-2) with an empirical fitting coefficient, B, determined
Table 2-1: Flow Regimes
Knudsen Number Regime
Kn < 0.01 Continuum Flow
0.01 < Kn < 0.1 Slip Flow
0.1 < Kn < 3 Superposition of Viscous Flow and Molecular Flow
Kn >> 3 Molecular Flow
Adapted from (Tolstopyatov, et al., 2002)
Table 2-2: Parameters used to determine
the mean free path, the Diffusion Constant, Flux, and C0
Symbol Quantity Value/Units
kb Boltzmann constant 1.38E-23 J/K
T Temperature 473 K *
Pm Pressure 5.6 Pa (42 mtorr)
D Diameter of monomer 7.5E-10 m (0.75 nm) †
R Universal gas constant 8.3145 J/mol K
M Molecular weight of monomer 137.59 kg/kmol ‡
m Weight of a single monomer 1.38x10⁻²⁵ kg ‡
PP Partial pressure of Parylene C 10 mtorr
* Temperature of gas in deposition chamber (surface temperature is 293 K) †
Approximated by using the largest reported diameter of Benzene (Gulley & Buckman, 1999), the basis of all Parylenes
experimentally. This allows predictions for similar geometries under varying conditions.
(2-2)
The derivation of the equation for the concentration along the length of the channel,
C(x, t), is a straightforward application of Fickian diffusion as in (2-3), which defines
how the monomers travel along the gap.
(2-3)
The initial conditions (@ x = 0, C = C0; @ x = L, ∂C/∂x = 0; @ t = 0, C = 0) are used to
derive the formula for the concentration along the channel, C(x) in (2-4).
(2-4)
(2-5)
The monomer flux into the walls, (x, t), shown in (2-5), is based on an approximation
using a homogeneous Maxwell distribution for the particle velocity distribution function
(Ramachandran, et al., 2007).
The number of monomers striking the wall in time per unit area, MSA, is shown in
(2-6).
D=B 8RT
pM 2 2 ) , ( ) , ( x t x C D t t x C
0 4 ) 1 2 ( 0 0 ) 1 2 ( 2 ) 1 2 ( sin 4 ) , ( 2 2 2 n t L n D n x L n e C C t x C 2 ) , ( ) ,(x t C x t kBT
Figure 2-9: Drawing of cross-section (edge view) of characterization device.
Figure shows the channel and Parylene C. First order one-dimensional model uses the
Parylene C monomer concentration, C(x, t), to determine the deposition thickness, H(x), along
the channel axis. (b) Deposited film thickness, H(x), is equal on all surfaces for a given depth
Multiplying (2-6) by the surface area of the channel walls at x, Ptdx, provides the total
number of monomers striking the channel walls, MS, as in (2-7), where Pt is the perimeter
of the triangular cross-section.
(2-7)
The sticking coefficient, 1/N, determines the deposition of the monomers that strike the
walls. This has been reported to be from (10-4 to 10-5) (Bowie & Zhao, 2004) or
(10-3 -104) (Tolstopyatov, et al., 2002). After the model was developed, the sticking
coefficient was adjusted to match the measured deposition profile (1/N = 2x10⁻⁵). The
number of monomers striking the wall (2-7) was multiplied by the sticking coefficient,
1/N, to determine the number of monomers adsorbed by wall segment dx in time , as
shown in (2-8).
2 ) ( ) ( 0 T k dt x C N Ptdx x M B
D
(2-8)
The deposited film thickness, H(x), can be derived from the density of the monomers in
the film, , the surface area of the wall, Ptdx, and the number of deposited monomers,
MD(x), as in (2-9).
Ptdx x M x H D ) ( )
( (2-9)
Substituting (2-8) into (2-9) leads to (2-10), the equation for the thickness of the
Parylene C film, H(x).
(2-10)
2.1.2.1. Experimental Setup
A simulation was written in MATLAB (MathWorks, Natick, Massachusetts) using
(2-4) and a discrete version of (2-9) to model the penetration and polymerization of the
Parylene C, into the narrowing spaces used for the presented interconnects. The equation
2 ) ( ) ( 0 T k dt x C Ptdx x M B
S
2 ) ( 1 ) ( 0 T k dt x C N x H B
(2-6) 2 ) , ( ) , ( ) , ( 0 0 T k dt t x C dt t x t x M Bfor the concentration of the monomer at the entrance of the tapered channel can be
derived from the ideal gas law and is shown in (2-11).
(2-11)
PP is the partial pressure of the Parylene C monomer, T is the deposition temperature,
and R is the ideal gas constant (see Table 2-2). Using (2-11) and Avogadro’s number, the
initial concentration at the gap opening is calculated to be C0 = 2.04 x10¹⁷ monomers/L.
The simulation was used to optimize the width profile of the proposed tapered channel
by simulating the deposition of Parylene C into the gap between the channel walls and
the polyimide tubing. Figure 2-10 shows the programmatic flow of the discrete
MATLAB simulation. The variables and constants used for the deposition simulation are
shown in Table 2-3. The simulation was
used to optimize the width profile of the
proposed tapered channel by simulating
the deposition of Parylene C into the gap
between the channel walls and the
polyimide tubing.
The input to the simulation is an array
containing the widths of the space
between the polyimide tubing and the
channel wall. Intermediate results of the
simulation are arrays of the polymer
thicknesses and the resulting gap widths
along the channel axis. The simulation
was run iteratively to refine the
intermediate results until the resulting
gap widths were all zero. This provides
an optimized taper geometry that
indicated that the input width profile
would fill completely with polymer. The
channel profile was then used with the RT
[image:39.612.321.540.304.645.2]P C0 P
Figure 2-10: Flowchart for the MATLAB simulation of the Parylene C deposition.
Gap occlusion is detected if the deposition at
the entrance, H(x = 0), is half of the channel
tubing diameter and the isotropy of the Si etch to design the mask for the tapered
interconnect channels. The resultant design was used to experimentally verify the model
results through characterization of deposited Parylene C volume along the length of the
tapered channel.
2.1.3. Test Device Fabrication
Interconnect devices were fabricated as shown in Figure 2-11 for use with polyimide
capillary tubing (140 µm OD, Microlumen, Tampa, FL). This creates the tapered gap
between the tubing and channel designed by the model to be filled fully with Parylene C.
An aluminum hard mask was used to pattern the channels in the surface of the Si with an
isotropic etch (Drytek Quad SF6: 130 sccm, O2: 10 sccm, Pressure: 30 mtorr, RF power:
130 Watts) to a depth of 140 µm. Once the hard mask was removed in a wet etch, the
wafers were diced and treated in a piranha clean. Borofloat glass (Addis