ISSN: 2278-3075, Volume-8, Issue-9S, July 2019
An Insight into Machine Learning Techniques for
Predictive Analysis and Feature Selection
Deepti Aggarwal, Vikram Bali, Sonu Mittal
Abstract - Predictive analysis comprises a vast variety of statistical techniques like “machine learning”, “predictive modelling” and “data mining” and uses current and historical statistics to predict future outcomes. It is used in both business and educational domain with equal applicability.This paper aims to give an overview of the top work done so far in this field. We have briefed on classical as well as latest approaches (using“machine learning”) in predictive analysis. Main aspects like feature selection and algorithm selection along with corresponding application is explained. Some of the most quoted papers in this field along with their objectives are listed in a table. This paper can give a good heads up to whoever wants to know and use predictive analysis for his academic or business application.
Index Terms:Classification, Clustering, Feature Selection, Machine Learning, Predictive Analysis,Regression
I. INTRODUCTION
Predictive analytics is driven by predictive modelling. Predictive analytics use machine learning algorithms [2][3] and hence both go hand-in-hand. Predictive models can be trained on a data set to respond to a new set of data or values. These outcomes may be the possible changes in the market or may be behaviour of a customer. It helps to estimate the future occurrences on the basis of past occurrences. Predictive analytics is frequently used for security, marketing, risk, operations and fraud detection [15][16][20].The two types of predictive models are: 1) Classification models, used for predicting class membership 2) Regression models, used for predicting a number. The predictive models consist of algorithms, which are used to perform data mining and statistical analysis to determine the patterns and trends in data.
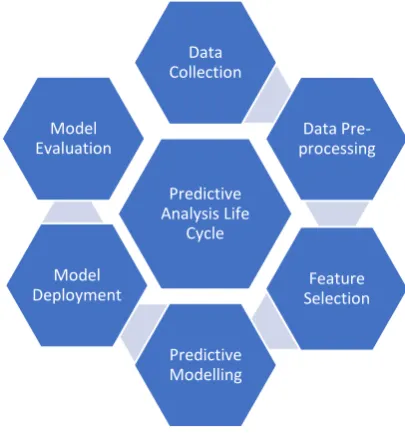
The life cycle for predictive analysis is shown in fig. 1. The first step is to collect the data on which modelling has to be done. The data pre-processing includes data cleaning and data integration. The influential features are then selected out the total features using feature selection algorithms. The model is constructed using one or more machine learning algorithms and deployed. The resultant models are then evaluated based on multiple performance metrics.
Revised Manuscript Received on July 02, 2019.
Deepti Aggarwal, Research Scholar, School of Computer and System Sciences, Jaipur National University, Jaipur, India, [email protected]
Dr. Vikram Bali, Professor & Head, Department of Computer Science and Engineering, JSS Academy of Technical Education, Noida, India, [email protected]
Dr. Sonu Mittal, Associate Professor, School of Computer and System Sciences, Jaipur National University, Jaipur, India,
[image:1.595.322.525.156.373.2]Fig. 1: Predictive analysis life cycle
II. RELATED WORK
Cai et al.discussed various methods and evaluation parameters for feature selection, that are widely applied in various classification and clustering machine learning problems[1].Sheikhpoursurveyed “semi-supervised feature selection methods” and presented two taxonomies of these based on two different perspectives that represented the hierarchical structure of “semi-supervised feature selection methods”[6]. Chandrashekar and Sahin demonstrated the applicability of techniques used for feature selection and provided a brief introduction to variable elimination which can be applied to a wide array of machine learning problems and also talked about Wrapper, Filter and Embedded methods[17].
Miao and Niu applied feature selection algorithms on machine learning problems and found that “unsupervised feature selection algorithms” improves the performance of clustering algorithms[10]. Liu et al.proposed “a new statistical measure named as LW-index which could replace the expensive cross-validation scheme to evaluate the feature subset. Then, a new feature selection method, which is the combination of the proposed LW-index with Sequence Forward Search algorithm (SFS-LW), is presented in this paper”[8].
Qiu et al.presented a literature survey of the latest advancements and learning methods in the field of “machine learning” for “big
data processing”. The authors investigated the
Predictive Analysis Life
Cycle Data Collection
Data Pre-processing
Feature Selection
Predictive Modelling Model
An Insight Into Machine Learning Techniques For Predictive Analysis And Feature Selection connections between machine learning and “signal
processing techniques for big data processing”[11]. Landset et al. discussed the merits and demerits of three different processing paradigms and also compared the engines that implement them[12].
Lykourentzou et al. proposed a dropout prediction method for e-learning courses using “feed-forward neural networks”, “support vector machines” and “probabilistic ensemble simplified fuzzy ARTMAP”[19]. Ruchika Malhotra compared the performance of different machine
learning techniques and statistical techniques and concluded that the machine learning techniques can predict software fault proneness[14].
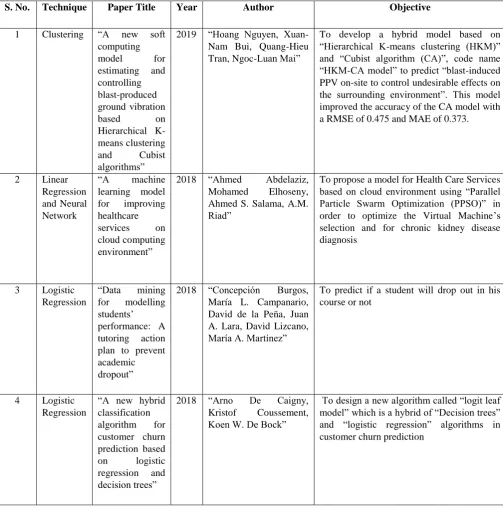
[image:2.595.47.551.203.717.2]The work related to predictive modelling, along with their objective and techniques involved are summarized in Table I.
Table I: Summarization of papers based on different machine learning techniques
S. No. Technique Paper Title Year Author Objective
1 Clustering “A new soft computing
model for
estimating and controlling blast-produced ground vibration
based on
Hierarchical K-means clustering
and Cubist
algorithms”
2019 “Hoang Nguyen, Xuan-Nam Bui, Quang-Hieu Tran, Ngoc-Luan Mai”
To develop a hybrid model based on “Hierarchical K-means clustering (HKM)” and “Cubist algorithm (CA)”, code name “HKM-CA model” to predict “blast-induced PPV on-site to control undesirable effects on the surrounding environment”. This model improved the accuracy of the CA model with a RMSE of 0.475 and MAE of 0.373.
2 Linear Regression and Neural Network
“A machine learning model for improving healthcare services on cloud computing environment”
2018 “Ahmed Abdelaziz, Mohamed Elhoseny, Ahmed S. Salama, A.M. Riad”
To propose a model for Health Care Services based on cloud environment using “Parallel Particle Swarm Optimization (PPSO)” in order to optimize the Virtual Machine’s selection and for chronic kidney disease diagnosis
3 Logistic Regression
“Data mining for modelling students’ performance: A tutoring action plan to prevent academic dropout”
2018 “Concepción Burgos, María L. Campanario, David de la Peña, Juan A. Lara, David Lizcano, María A. Martínez”
To predict if a student will drop out in his course or not
4 Logistic Regression
“A new hybrid classification algorithm for customer churn prediction based on logistic regression and decision trees”
2018 “Arno De Caigny, Kristof Coussement, Koen W. De Bock”
ISSN: 2278-3075, Volume-8, Issue-9S, July 2019 5 Clustering “Cloud based
framework for diagnosis of diabetes mellitus using K-means clustering”
2018 “Shakeel, P.M., Baskar, S., Dhulipala”
To compare the efficiency of different clustering techniques in order to diagnose which gender and age group are mostly affected by diabetes.
6 Decision Tree
“A new hybrid classification algorithm for customer churn prediction based on logistic regression and decision trees”
2018 “Arno De Caigny, Kristof Coussement, Koen W. De Bock”
To propose a hybrid algorithm, “the logit leaf model (LLM)”, based on “Decision trees” and “Logistic regression” for customer churn prediction.
7 Logistic Regression
“Early detection of university students with potential difficulties”
2017 “Anne-Sophie Hoffait, Michaël Schyns”
To design the prediction algorithms with high accuracy using “random forest”, “logistic regression” and “artificial neural network” algorithms.
8 Clustering “Trainable Weka
Segmentation: a machine
learning tool for microscopy pixel
classification”
2017 “Ignacio
Arganda-Carreras, Verena
Kaynig, Curtis Rueden,
Kevin W Eliceiri,
Johannes Schindelin,
Albert Cardona, H
Sebastian Seung”
To introduce the “Trainable Weka Segmentation (TWS), a machine learning tool that leverages a limited number of manual annotations in order to train a classifier and segment the remaining data automatically”. This tool provides clustering schemes that can be customized to employ user-designed image features or classifiers.
9 Linear Regression
“Comparison of Machine Learning methods applied to the estimation of
manufacturing cost of jet engine
components”
2016 “Jean-Loup Loyer, Elsa Henriques,
MihailFontul, Steve Wiseall”
To compare the performance of five statistical models for the prediction of manufacturing cost of jet engine components, during the early design phase. The results proved “Gradient Boosted Trees” and “Support Vector Regression” to be very efficient techniques
10 Decision Tree
“Towards the integration of multiple
classifier pertaining to the Student's performance prediction”
2016 “Mrinal Pandey, S. Taruna”
To propose integrated multiple classifiers for predicting students’ academic performance using “Decision Tree”, “K-Nearest Neighbour” and “Aggregating One-Dependence Estimators (AODE)”
11 Logistic Regression
“Using Machine Learning Algorithms for Breast Cancer Risk Prediction
2016 “Hiba Asri, Hajar Mousannif, Hassan Al Moatassime, Thomas Noel”
An Insight Into Machine Learning Techniques For Predictive Analysis And Feature Selection
and Diagnosis” show that Support Vector Machine gives the
highest accuracy of 97.13%
12 Neural Network
“An empirical framework for defect prediction using machine learning
techniques with Android
software”
2016 “Ruchika Malhotra” To predict defective classes using 18 machine-learning techniques. “The proposed framework has been applied to seven application packages of well known, widely used Android operating system viz. Contact, MMS, Bluetooth, Email, Calendar, Gallery2 and Telephony”.
13 Decision Tree
“Wrapper Feature Subset Selection for Dimension Reduction
Based on
Ensemble Learning Algorithm”
2015 “RattanawadeePanthong, AnongnartSrivihok”
To perform optimization based on ensemble algorithms namely “Bagging” and “AdaBoost” by subset evaluations which are performed using two classifiers: “Decision Tree” and “Naïve Bayes”. “This study shows that the search technique using SFS based on the bagging algorithm using Decision Tree obtained better results in average accuracy (89.60%) than other methods”
14 Clustering “Randomized Dimensionality Reduction fork-Means
Clustering”
2015 “C. Boutsidis, A.
Zouzias, M. W.
Mahoney and P.
Drineas”
To present feature extraction methods based on random projections and fast approximate SVD factorizations alongwith the feature selection method for k-means clustering
15 Logistic Regression
“A comparative analysis of machine
learning
techniques for student retention management”
2010 “DursunDelen” To develop an analytical model to predict and explain the reasons behind attrition of fresher students
16 Neural Network
“Dropout prediction in e-learning courses through the combination of machine
learning techniques”
2009 “IoannaLykourentzou, IoannisGiannoukos, Vassilis Nikolopoulos, George Mpardis, Vassili Lo “
To implement dropout prediction for e-learning courses using “feed-forward neural networks”, “support vector machines” and “probabilistic ensemble simplified fuzzy ARTMAP.”
17 Neural Network
“An
investigation of machine
learning based prediction systems”
2000 “Carolyn Mair,
GadaKadoda, Martin Lefley, Keith Phalp, Chris Schofield, Martin
Shepperd, Steve
Webster umos”
To compare different machine learning methods to build software effort prediction systems by applying the techniques to a dataset of 81 software projects. The results proved Artificial Neural Network to be the most accurate technique
III. MACHINE LEARNING TECHNIQUES Machine learning technique basically works by training an algorithm on a large data set, also called training set, which has known output[11][12]. Later the algorithm is tested on a test set to get the results[19][14]. Machine learning
approach can be classified as supervised learning and unsupervised learning.
A. Linear Regression
Linear regression is a supervised machine learning algorithm that is used to model a target value based on the given inputs. It is normally used for forecasting and finding the relation between dependent and independent variables. If the input variable is u and the output variable is v, the relation between these two variables can be depicted using
a linear equation v= α1 + α2.u
ISSN: 2278-3075, Volume-8, Issue-9S, July 2019
best fit line. For this purpose, the cost function is the Root Mean Square Error(RMSE), which minimizes the difference between the actual value of v and the predicted value of v.
Gradient descent is normally used to minimize RMSE. The output in case of linear regression is continuous.
B. Logistic Regression
Logistic regression is a supervised classification algorithm that is used to classify the data according to the given input features[4][18]. Unlike linear regression the output values in case of logistic regression is discrete. E.g. to classify whether it will rain or not. Based on the classification category, logistic regression can be classified into three different types:
Binomial classification: In Binomial classification, the class(target) variable can have two possible values like “yes” vs “no”, “0” vs “1”, “pass” vs “fail”, “up” vs “down” etc.
Multinomial classification: In multinomial classification, the class(target) variable can have more than two values like the different type of food “Chinese” vs “Italian” vs “Indian” vs “Asian” vs “Continental”.
Ordinal classification: In ordinal classification, the class(target) variable has the ordered categories like feedback categories “Excellent” vs “Good” vs “Average” vs “Poor”. The basic difference between linear regression and logistic regression is that linear regression is used for prediction and logistic regression is used for classification. Just like linear regression, logistic regression also uses a linear equation for classification purpose. The cost function used for logistic regression is called the “sigmoid function” or “logistic function”, which returns a probability value between 0 and 1. This function maps the predicted values to probabilities
Unlike the straight line in linear regression, logistic regression has an S-shaped curve that may take a real-value number and map it into a value between 0 and 1
C. Clustering
Clustering is an unsupervised machine learning algorithm that is used to group the data points based on their traits. The data points in one cluster will have similar features whereas data points in different clusters should have different properties/features. Clustering is normally used to extract some information from the given data set by applying the different clustering algorithms. The two most popular algorithms used for clustering algorithms are:
K-means clustering: It is a partitioning based iterative clustering algorithm in which the data points are partitioned into k clusters. The aim is to find the local maxima in each iteration. The number of clusters are randomly initialized and each data point is assigned to a cluster in 2D space. The centroid of each cluster is computed and each data point is
assigned to the closest cluster centroid. This iteration goes on till no more improvements are possible and we reach the global optima.
Hierarchical clustering: As the name suggests, this algorithm follows a tree like structure. The clusters at one level are formed based on the cluster in the previous level. The two possible approaches in hierarchical clustering are:Top-down approach and Bottom-up approach
For big data handling, k-means clustering is better than hierarchical clustering. The time complexity of K-means is O(n) whereas the time complexity of hierarchical clustering is O(n2). The results in case of hierarchical clustering can be reproduced, but in K-means clustering, the results may differ because of the random choice of clusters during initialization. K-means clustering performs better when the shape of clusters is circular or spherical. The number of clusters needs to be known prior whereas in hierarchical clustering, the number of clusters are determined by interpreting the dendrogram
D. Conjoint Analysis
Conjoint analysis is used to build a model for predicting customer’s preference. It is an advanced technique for market research analysis in order to take insight of how the customer makes complex choices. Trade-offs are required for making choices on daily basis, that one may not even realize. Some daily life decisions such as, “what type of oil should I buy?” or “which area should I look for booking a house?” all contain several elements which ultimately helps in formulating a decision. Conjoint analysis is one of the most preferred models in identifying customer’s preferences during the process of purchasing process and converting into a quantitative measurement. The two most important types of conjoint analysis are:
Choice-based Conjoint (CBC) Analysis: CBC analysis is one of the most popular types of conjoint analyais because it asks customers to imitate the purchasing pattern as per the real market, like which products they will choose based on certain criteria on features and price.
Adaptive Conjoint Analysis (ACA): ACA is normally used where the number of features/attributes are much more than that can be handled by CBC analysis. It gives better performance for segmentation research and product design, but not for the price.
E. Neural Networks
A neural network is a complex architecture of many layers of interconnected units[5][19]. Each unit represents a complex function of the input value. It takes input from the previous step and gives output, which is connected to the unit in the next step. Each such unit is called a neuron, and the complete architecture is called a Neural Network (NN). The parameters of the functions in each unit are learned as part of the training step of
An Insight Into Machine Learning Techniques For Predictive Analysis And Feature Selection
[image:6.595.310.547.54.298.2]There is one input layer and one output layer. The design of input and output layers is application specific. For example, in a sentimental analysis, the input can be the sentence or paragraphs to be analysed. The output could be a classifier, which classifies it as neutral, negative or positive. It could be designed for ranking (viz. from 1 to 5) on various aspects like anger or happiness. The inner layers are called hidden layers. In fig. 2, there is one hidden layer. The input and hidden layer each have 4 units.
Fig. 2: Neural Network
A typical NN can be made of several hidden layers, and several units in each hidden layer. A NN is useful because each unit (neuron) in every layer very slightly affects the outcome of the overall output. During the training steps of a NN, it learns very complex features of a given problem. Each unit (neuron) in each layer can affect the overall outcome only extremely slightly. But when that outcome passes through several layers of neurons, the effect is compounded and gives very accurate results. The outcomes of the NN are so accurate that scientists are not sure how NN are able to learn such complex features.
F. Decision Trees
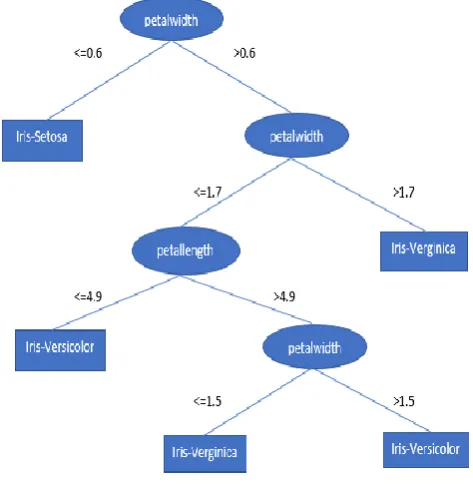
[image:6.595.49.296.167.279.2]Decision tree is a supervised machine learning tool used for predictive modelling. It can be used for classification as well as regression tasks[7]. Another name for decision trees is CART(Classification and Regression Trees). It is a tree like structure that can be used to visually represent the flow of decision making. It is one of the simplest machine learning algorithms. The rules in decision trees are in the form of if-then-else statements. The rules get complex as we go deep in the tree and the deeper the tree, fitter the model. The nodes represent the place where we pick a feature and ask a question; the edges represent the answers to that question; and the leaf nodes represent the actual output or target label. E.g. Fig. 3 shows an example of decision tree for classifying whether a flower is Sentosa, versicolor or Iris-Verginica based on petal width and petal length.
Fig.3: Decision Tree
The most important point in working with a decision tree is to choose the root node, which is called as feature selection. The two most popular feature selection methods are: Information gain and Gini Index. The major advantage of decision tree is its simplicity, less computation and it can handle both continuous and categorical variables.
On the other side, Decision trees are not appropriate for estimation tasks, they are prone to errors in classification problems where there are many classes and a small data set. They can also be computationally expensive to train.
IV. FEATURE SELECTION
With the availability of huge data sets, feature selection as a pre-processing step to machine learning is highly effective in removing unimportant and redundant data, improving result comprehensibility and increasing learning accuracy[9][13]. Feature selection is a technique in which the most influential features/attributes from a data set are selected for predictive analysis[1]. The irrelevant and redundant features are eliminated from the dataset and a subset of features is kept. Some supervised machine learning algorithms have built-in feature selection like Random Forests and Regularized Regression. Feature selection can be supervised or unsupervised or a combination of both[6][17]. The two most commonly used feature selection methods are:
Variance Thresholds: Variance thresholds eliminate those features whose values remain almost same in every observation (i.e. their variance falls below a threshold). Such features
ISSN: 2278-3075, Volume-8, Issue-9S, July 2019
95% of observations are for women who are 40-year-old, then the features 'Age' and 'Gender' can be easily eliminated without any major loss of information[21][10]. Normalization of features is a very important step because variance is dependent on scale. Intuition is the base for applying variance thresholds: features that remain same do not add much information to the data. It is a relatively safe and easy way for dimensionality reduction. It can be implemented easily in Python/R programming language
Correlation Thresholds: Correlation thresholds remove the highly correlated features (i.e. the features whose value change similarly to other's). These features do not add much to the information. E.g , if you had a weather dataset with 'Temperature (Celsius)' and 'Temperature (Fahrenheit)' as different features, one of these can be safely removed. The question arises which one of these features should be removed. For this purpose, all pair-wise correlations need to be calculated. Then, if the correlation> threshold, then the feature, that has greater mean absolute correlation with rest of the features, should be removed.Intuition is the base for applying correlation thresholds also: features that do not change much gives redundant information[22][8]. The tricky part is that the threshold value needs to be set manually because if the threshold is set very low, the useful information may be dropped. So, the algorithms with built-in feature selection method are a better choice. It can be implemented easily in Python / R programming language.
V. CONCLUSION
Predictive analysis is a process that overlaps with machine learning and both go hand-in-hand. This paper tells about the various supervised and unsupervised machine learning algorithms used for predictive analytics.The two most commonly methods used for feature selection are also discussed.
ACKNOWLEDGEMENT
The authors are highly grateful to the Principal, Management and Department of Computer Science and Engineering of JSS Academy of Technical Education, Noida, Uttar Pradesh to provide complete support in carrying out the research work and writing this paper.
REFERENCES
1. Jie Cai, Jiawei Luo, Shulin Wang, Sheng Yang, “Feature selection in machine learning: A new perspective”, Neurocomputing, Volume 300, 2018, Pages 70-79, ISSN 0925-2312, https://doi.org/10.1016/j.neucom.2017.11.077 2. Concepción Burgos, María L. Campanario, David de la Peña,
Juan A. Lara, David Lizcano, María A. Martínez, “Data mining for modeling students’ performance: A tutoring action plan to prevent academic dropout”, Computers & Electrical Engineering, Volume 66, 2018, Pages 541-556, ISSN 0045-7906, https://doi.org/10.1016/j.compeleceng.2017.03.005.
3. Ajmer Singh, Rajesh Bhatia, Anita Singhrova, “Taxonomy of machine learning algorithms in software fault prediction using object oriented metrics”, Procedia Computer Science, Volume 132, 2018, Pages 993-1001, ISSN 1877-0509, https://doi.org/10.1016/j.procs.2018.05.115.
4. Arno De Caigny, Kristof Coussement, Koen W. De Bock, “A
new hybrid classification algorithm for customer churn prediction based on logistic regression and decision trees”, European Journal of Operational Research, Volume 269,
Issue 2, 2018, Pages 760-772, ISSN 0377-2217,
https://doi.org/10.1016/j.ejor.2018.02.009.
5. Aggarwal D., “Sentiment Analysis: An insight into
Techniques, Application and Challenges”, International Journal of Computer Science and Engineering, Volume 6,
Issue 5, 2018, pages 697-703,
https://doi.org/10.26438/ijcse/v6i5.697703
6. RaziehSheikhpour, Mehdi Agha Sarram, Sajjad Gharaghani, Mohammad Ali ZareChahooki, “A Survey on semi-supervised feature selection methods”, Pattern Recognition, Volume 64, 2017, Pages 141-158, ISSN 0031-3203, https://doi.org/10.1016/j.patcog.2016.11.003.
7. Anne-Sophie Hoffait, Michaël Schyns, “Early detection of university students with potential difficulties”, Decision Support Systems, Volume 101, 2017, Pages 1-11, ISSN 0167-9236, https://doi.org/10.1016/j.dss.2017.05.003. 8. Chuan Liu, Wenyong Wang, Qiang Zhao, Xiaoming Shen,
Martin Konan, “A new feature selection method based on a validity index of feature subset, Pattern Recognition Letters,
Volume 92, 2017, Pages 1-8, ISSN 0167-8655,
https://doi.org/10.1016/j.patrec.2017.03.018.
9. S. Sasikala, S. Appavu alias Balamurugan, S. Geetha, “Multi
Filtration Feature Selection (MFFS) to improve
discriminatory ability in clinical data set”, Applied Computing and Informatics, Volume 12, Issue 2, 2016, Pages
117-127, ISSN 2210-8327,
https://doi.org/10.1016/j.aci.2014.03.002.
10. Jianyu Miao, LingfengNiu, “A Survey on Feature Selection”, Procedia Computer Science, Volume 91, 2016, Pages
919-926, ISSN 1877-0509,
https://doi.org/10.1016/j.procs.2016.07.111.
11. Junfei Qiu, Qihui Wu, Guoru Ding, Yuhua Xu and
Shuo Feng, “A survey of machine learning for big data processing”, EURASIP Journal on Advances in Signal Processing, 2016:67, https://doi.org/10.1186/s13634-016-0355-x
12. Sara Landset, TaghiM. Khoshgoftaar, Aaron N. RichterEmail author and Tawfiq Hasanin, “A survey of open source tools for machine learning with big data in the Hadoop ecosystem”,
Journal of Big Data, 2015, 2:24,
https://doi.org/10.1186/s40537-015-0032-1
13. RattanawadeePanthong, AnongnartSrivihok, ”Wrapper
Feature Subset Selection for Dimension Reduction Based on Ensemble Learning Algorithm”, Procedia Computer Science, Volume 72, 2015, Pages 162-169, ISSN 1877-0509, https://doi.org/10.1016/j.procs.2015.12.117.
14. Ruchika Malhotra, “A systematic review of machine learning techniques for software fault prediction”, Applied Soft Computing, Volume 27, 2015, Pages 504-518, ISSN 1568-4946, https://doi.org/10.1016/j.asoc.2014.11.023.
An Insight Into Machine Learning Techniques For Predictive Analysis And Feature Selection
https://doi.org/10.1016/j.csbj.2014.11.005.
16. T. Vafeiadis, K.I. Diamantaras, G. Sarigiannidis, K.Ch. Chatzisavvas, “A comparison of machine learning techniques for customer churn prediction”, Simulation Modelling Practice and Theory, Volume 55, 2015, Pages 1-9, ISSN 1569-190X, https://doi.org/10.1016/j.simpat.2015.03.003. 17. Girish Chandrashekar, FeratSahin, “A survey on feature
selection methods”, Computers & Electrical Engineering, Volume 40, Issue 1, 2014, Pages 16-28, ISSN 0045-7906, https://doi.org/10.1016/j.compeleceng.2013.11.024.
18. DursunDelen, “A comparative analysis of machine learning techniques for student retention management”, Decision Support Systems, Volume 49, Issue 4, 2010, Pages 498-506, ISSN 0167-9236, https://doi.org/10.1016/j.dss.2010.06.003.
19. IoannaLykourentzou, IoannisGiannoukos, Vassilis
Nikolopoulos, George Mpardis, VassiliLoumos, “Dropout prediction in e-learning courses through the combination of machine learning techniques”, Computers & Education, Volume 53, Issue 3, 2009, Pages 950-965, ISSN 0360-1315, https://doi.org/10.1016/j.compedu.2009.05.010.
20. Carolyn Mair, GadaKadoda, Martin Lefley, Keith Phalp, Chris Schofield, Martin Shepperd, Steve Webster, “An investigation of machine learning based prediction systems”, Journal of Systems and Software, Volume 53, Issue 1, 2000,
Pages 23-29, ISSN 0164-1212,
https://doi.org/10.1016/S0164-1212(00)00005-4.
21. Witten, I.H., Frank, E., Trigg, L., Hall, M., Holmes, G. &Cunningham, S.J. (1999), “Weka: Practical machine learning tools and techniques with Java implementations”, (Working paper 99/11). Hamilton, New Zealand: University of Waikato, Department of Computer Science.
22. Hall, M. A. & Smith, “Practical feature subset selection for machine learning”,Computer Science ’98 Proceedings of the 21st Australasian Computer Science Conference ACSC’98, Perth, 4-6 February, 1998, Pages 181-191, Berlin: Springer.
AUTHORS PROFILE
Deepti Aggarwal has received her B. Tech.(CSE) from MDU, Rohtak, M.Tech.(CSE) from Rajasthan Vidyapeeth, Udaipur and pursuing Ph.D. from Jaipur National University, Jaipur. She has overall teaching experience of more than 18 years and currently working as Assistant Professor at JSS Academy of Technical Education, Noida since 2005. She has 4 papers in international journals and conference. She has written a book on ‘Computer Organisation’. Her area of interest is machine learning, data mining, operating system and compiler design.
Dr. Vikram Bali has received his B.Tech (CSE) from REC, Kurukshetra, M.E. (CSE) from NITTTR, Chandigarh and Ph.D from Banasthali Vidyapith, Rajasthan. He has more than 18 years of rich academic experience. He is a Professor & Head of Department (CSE) at JSS Academy of Technical Education, Noida. He is life time member of Indian Society for Technical Education (ISTE), Computer Society of India (CSI) and Institution of Engineers (IE). He has contributed 21 Research papers in International Journal and 7 Research papers in National Conferences/ proceedings and Edited Books. He has also attended Faculty Enablement programme organised by Infosys and NASSCOM. He has been the member of board of studies of different Indian Universities and member of organizing committee for various national and international seminar/conferences. He has written books on Fundamental of "Cyber Security and Laws", “Software Engineering" and “Operating System”. He is reviewer to many
International Journals of repute like Inderscience and IGI Global. His research interest includes Software Engineering, Cyber Security, Automata Theory, CBSS and ERP.