Physics and Astronomy Publications
Physics and Astronomy
2-2003
Optical properties and electronic structures of
single crystalline RAl3(R=Sc, Yb, and Lu)
S. J. Lee
Iowa State University
J. M. Park
Iowa State University
Paul C. Canfield
Iowa State University, [email protected]
David W. Lynch
Iowa State University, [email protected]
Follow this and additional works at:
http://lib.dr.iastate.edu/physastro_pubs
Part of the
Atomic, Molecular and Optical Physics Commons
, and the
Condensed Matter
Physics Commons
The complete bibliographic information for this item can be found athttp://lib.dr.iastate.edu/physastro_pubs/112. For information on how to cite this item, please visithttp://lib.dr.iastate.edu/howtocite.html.
Optical properties and electronic structures of single crystalline
RAl3(R=Sc, Yb, and Lu)
Abstract
The optical conductivities of single crystals of ScAl3, LuAl3, and YbAl3 were measured by spectroscopic
ellipsometry in the energy range of 1.5–5.5 eV. The conductivity spectra of all show peaks between 1.5 and 2.0
eV originating from interband transitions. Two additional peaks around at 2.9 and 4.2 eV are observed for
ScAl3, and a weak shoulder is observed around at 2.8 eV for LuAl3. Band structure, density of states, and
optical conductivity were calculated using the full-potential linear augmented plane wave method. The
calculated conductivity spectrum for ScAl3 shows peaks around at 2.7 and 4.3 eV. The distinctive feature of
the optical conductivity for ScAl3 comes from the extraordinary large Sc
d
unoccupied density of states
compared to those of Yb
d
and Lu
d
. Oxidation effects on the optical properties of the sample were studied
using a three-phase model. The calculated optical conductivity of the clean surface using the three-phase
model is larger than that of the oxidized surface.
Keywords
Ames Laboratory, spectroscopic ellipsometry, conductivity spectrum
Disciplines
Atomic, Molecular and Optical Physics | Condensed Matter Physics | Physics
Comments
This article is from
Physical Review B
67 (2003): 075104, doi:
10.1103/PhysRevB.67.075104
. Posted with
permission.
Optical properties and electronic structures of single crystalline RAl
3„
R
Ä
Sc, Yb, and Lu
…
S. J. Lee
Ames Laboratory, Iowa State University, Ames, Iowa 50011
J. M. Park, P. C. Canfield, and D. W. Lynch
Ames Laboratory and Department of Physics and Astronomy, Iowa State University, Ames, Iowa 50011
共Received 10 May 2002; revised manuscript received 19 November 2002; published 12 February 2003兲
The optical conductivities of single crystals of ScAl3, LuAl3, and YbAl3were measured by spectroscopic ellipsometry in the energy range of 1.5–5.5 eV. The conductivity spectra of all show peaks between 1.5 and 2.0 eV originating from interband transitions. Two additional peaks around at 2.9 and 4.2 eV are observed for ScAl3, and a weak shoulder is observed around at 2.8 eV for LuAl3. Band structure, density of states, and optical conductivity were calculated using the full-potential linear augmented plane wave method. The calcu-lated conductivity spectrum for ScAl3 shows peaks around at 2.7 and 4.3 eV. The distinctive feature of the optical conductivity for ScAl3comes from the extraordinary large Sc d unoccupied density of states compared to those of Yb d and Lu d. Oxidation effects on the optical properties of the sample were studied using a three-phase model. The calculated optical conductivity of the clean surface using the three-phase model is larger than that of the oxidized surface.
DOI: 10.1103/PhysRevB.67.075104 PACS number共s兲: 78.20.Ls, 75.50.Cc, 71.20.Lp
I. INTRODUCTION
The rare earth trialuminides, RAl3 (R⫽Sc, Yb, and Lu兲
have been investigated extensively because they show a va-riety of interesting physical properties: magnetism,1,2 de Haas–van Alphen 共dHvA兲,3,4thermal,5 transport,6and elec-tronic properties.7–10 They have the cubic L12 (AuCu3)
crystal structure, space group Pm3¯ m. YbAl3 has been
stud-ied more than other rare earth trialuminides because its 4 f states are near the Fermi level, which causes valence fluctua-tion phenomena.9,11,12Usually investigations of YbAl3 have
been accompanied by those of LuAl3which can be used as a reference material because its 4 f states are located well be-low the Fermi level.
The optical response, especially in the near-ir, visible, and uv regions, involves interband transitions of bound electrons from occupied states below the Fermi energy to empty states above, contributing to the peaks in the optical spectrum. The valence electronic configuration of Sc is 3d14s2, while those of Lu and Yb are 5d16s2 and 5d06s2, respectively. The optical properties of single crystals of RAl2(R⫽Yb, Lu, Ce,
Pr, Y, La兲 in the cubic Laves MgCu2 structure have been
studied using spectroscopic ellipsometry and first-principles calculations.13,14 The electronic band structures were used for investigating the origins of peaks in the optical conduc-tivity. The optical conductivities of LuAl3and YbAl3show a
similar feature in the visible region to those of LuAl2 and
YbAl2, but show a different feature in the uv region due to
different crystal structure and electronic structure.
As far as we know, no experimental and theoretical stud-ies on the optical propertstud-ies for ScAl3, LuAl3, and YbAl3
have been reported. In this paper, we report the first optical spectra for single crystals of R共⫽Sc, Yb, Lu)Al3 showing a
strong feature at about 2 eV and theoretical analysis of opti-cal properties using the full potential linearized augmented plane wave 共FP-LAPW兲method based on the local density approximation共LDA兲. Among the rare earth trialuminides R
共⫽rare earth兲Al3, the 4 f shells of YbAl3 and LuAl3are fully
occupied and that of ScAl3 is completely empty, so the
op-tical conductivities of these materials may be analyzed using the self-consistent band structure calculations based on the LDA while the other rare earth trialuminides having open 4 f shells are difficult to deal with LDA. Therefore these mate-rials are good for testing the application of LDA to the rare earth trialuminides having closed and empty 4 f shells.
Using band structure calculations employing the local density approximation method, Xu and Freeman7studied the structural stability of ScAl3 and showed that ScAl3 favors
the L12 structure rather than the D022structure. Takegahara
calculated the electronic band structure and density of states for LuAl3 using a self-consistent augmented plane wave
共APW兲method.8It was calculated that the Lu 5d states have a low density of states in the vicinity of the Fermi energy. Sakamoto et al.4 used a full-potential linearized augmented plane wave method to calculate the band structure and Fermi surface of LuAl3. The dHvA frequencies from the calculated
Fermi surfaces agreed well with the experimental values ob-tained from high-quality single crystals of YbAl3and LuAl3.
We employed the FP-LAPW method to calculate the band structure, density of states, and optical conductivity to under-stand the origin of peaks in the measured optical conductiv-ity spectra of Sc(Yb,Lu)Al3.
Single crystals exposed to air can grow an oxidation layer on the surface which could affect the optical properties of the samples. The oxidation effect on the surface of a sample was studied using a three-phase model 共air–thin oxide layer– clean sample兲. The derived optical conductivity of the clean sample by the three-phase model shows enhancement of op-tical conductivity from the oxidized sample.
II. EXPERIMENT
A. Sample preparation and characterization
Single crystals of ScAl3, YbAl3, and LuAl3 were grown
from binary melts. This growth technique can be called a PHYSICAL REVIEW B 67, 075104 共2003兲
self-flux method in that no third element is used as a flux.15 For example, single crystals of LuAl3 were grown from a
binary melt rich in aluminum. Lutetium 共Ames Laboratory, 99.99% purity兲 and aluminum shot 共Johnson-Matthey, 99.999% purity兲were packed in an alumina crucible with a ratio of Lu0.1Al0.9 共see binary phase diagram16兲. This was
then sealed in a quartz ampoule, particular care having been taken to avoid excessive attack of the quartz by the alumi-num. The sample was then heated to 1190 °C and slowly cooled to 750 °C over a period of 60 h, at which temperature the remaining liquid was decanted from the crystal of LuAl3.
The crystals grown from this technique are cubic in morphol-ogy with typical dimensions of 3⫻3⫻2 mm3. The surfaces
of the as-grown samples of Sc(Lu,Yb)Al3 were clean and
flat enough to use for optical measurements without further mechanical or chemical treatment.
X-ray powder diffraction patterns with Cu K␣ radiation were performed with crushed single crystal samples at room temperature. From these, lattice constants for ScAl3, YbAl3, and LuAl3 were determined as 4.105, 4.203, and 4.187 Å
respectively. These are similar to those in the literature, 4.103, 4.202, and 4.184 Å, respectively.4,6,17The lower limit for the detection of second phases in x-ray patterns is gener-ally a few percent for the samples.
B. Ellipsometry
The optical conductivities of the present compounds were measured using spectroscopic ellipsometry in the range 1.5– 5.5 eV共225– 827 nm兲. Spectroscopic ellipsometry18is based on the fact that the state of polarization of incident light is changed on reflection. This change is directly related to the dielectric function of the reflecting material. With rotating analyzer ellipsometry19共RAE兲one measures the complex ra-tio of the Fresnel reflecra-tion coefficients for p and s polariza-tions, defined by
˜⫽˜rp r ˜
s ⫽
冏
rrps
冏
ei⌬⫽tan⌿ei⌬, 共1兲
where rpand rsare the complex amplitude reflection coeffi-cients for p- and s-polarized light, and⌿ and⌬ express the change in amplitude and phase between p and s components of polarized light reflected from a surface. ⌿ and ⌬ are quantities directly measurable from ellipsometry.
For a bulk sample without surface overlayers, the com-plex dielectric function˜ is related to the complex reflectiv- ity ratio˜ by
˜⫽sin20⫹sin2
0tan20
冋
1⫺˜
1⫹˜
册
2
, 共2兲
where0 is the angle of incidence, 68° in this experiment. From this dielectric function,˜⫽1⫹i2, the complex
op-tical conductivity, ˜⫽1⫺i2, can be obtained by
˜⫽1⫹4˜ i
. 共3兲
The absorptive component of the optical conductivity1
is related to the imaginary part of the dielectric function 2
by 1⫽2/4. Equation 共2兲 is obtained using the
two-phase model assuming that the system consists of an isotro-pic ambient and an isotroisotro-pic semi-infinite, homogeneous solid.
III. THEORY
For the band structure calculation, the full-potential linear augmented plane wave method was used20with the inclusion of spin-orbit coupling. The spin-orbit coupling is added us-ing a second-variational step with the scalar-relativistic or-bitals as a basis.21The spin-orbit interaction lifts some of the degeneracies of the energy bands at high symmetry points or lines in k space. It couples the spin-up and spin-down states and doubles the size of the Hamiltonian matrix from that of the scalar-relativistic one-spin Hamiltonian matrix. The exchange-correlation potential was treated in the generalized gradient approximation within the local density approxima-tion. The muffin-tin sphere radii for Sc, Yb, Lu, and Al were chosen to be 2.0 a.u., respectively, with a cutoff RKmax
⫽8.0. We used the room-temperature lattice constants for ScAl3, YbAl3, and LuAl3from the x-ray powder diffraction
patterns.
In the calculation, Sc 1s, 2s, 2 p, Yb 共Lu兲1s, 2s, 2 p, 3s, 3 p, 3d, 4s, 4 p, 4d were treated as core states. For Al, 1s and 2s were treated as core states. Local orbitals 共LO兲 were employed to enhance the variational freedom in the LAPW basis functions. They are 3s, 3 p, (5s, 5 p) semicore states for Sc共Yb, Lu兲and 2 p semicore states for Al. Sc 4s, 3d, Yb 6s, Lu 6s, 5d were used as valence states. The rare earth 4 f electrons were also treated as valence electrons throughout the whole calculation. The k-integrated functions have been evaluated by the tetrahedron technique with 2000
k points in the Brillouin zone of the sc lattice. The total
energy was converged to 10⫺4 Ry. Once the self-consistent potential and charge are obtained, the real part of the optical conductivity can be calculated. In cubic systems it is neces-sary to calculate only one of the three diagonal components of the conductivity tensor. The equation used for the optical conductivity is as follows.
1xx共兲⫽
e2
3m2
兺
f ,i冕
BZd3k 2
共2兲3兩pf i兩
2f i共k兲
⫻关1⫺ff共k兲兴␦„Ef共k兲⫺Ei共k兲⫺ប…, 共4兲
where BZ denotes Brillouin zone, f (k) is the Fermi distribu-tion funcdistribu-tion, and i and f stand for the occupied initial and unoccupied final energy band states at wave vector k, respec-tively.
pf i⫽
ប i
具
f兩
x兩i
典
共5兲is the dipole matrix element between the occupied Ei(k) and unoccupied Ef(k) one-electron states. The imaginary part of the optical conductivity, 2xx(), can be obtained from the S. J. LEE, J. M. PARK, P. C. CANFIELD, AND D. W. LYNCH PHYSICAL REVIEW B 67, 075104 共2003兲
Kramer-Kronig relationship. In the optical calculation, 2000
k points in the Brillouin zone were found to be enough to get
converged value.
Electric dipole matrix elements were included in this cal-culation. The calculated optical conductivity spectra are un-broadened quantities. The electrons generally interact with other electrons. These correlated electrons are described by the quasiparticle picture using a self-energy correction. The self-energy is usually momentum and energy dependent and consists of two parts,22
⌺⫽⌺1⫹i ⌺2. 共6兲
The real part of the self-energy represents a shift of the one-electron energy of a state, while the imaginary part describes the broadening of the energy level caused by the finite life-time of a state. To consider the finite lifelife-time of the excited quasiparticle state, the theoretical optical conductivity is con-volved with an Lorentzian broadening function23 of width equal to the imaginary part of the complex self-energy which was set empirically to a constant value of⌺2⫽0.2 eV. The experimental conductivity includes a free-electron 共Drude兲 term, not included in the calculated spectra. From the energy bands and the FP-LAPW eigenvectors, we calculated the to-tal and orbito-tal projected density of states.
IV. RESULTS AND DISCUSSION
The density of states for ScAl3 is shown in Fig. 1. The solid, short-dashed, and dotted lines represent the total den-sity of states共DOS兲, Sc d, and Al p partial density of states, respectively. The noticeable peaks around at 0.9, 2.2, and 3.8 eV arise mainly from Sc d bands. Figures 2 and 3 are corre-sponding density of states for YbAl3and LuAl3. The two big
peaks in Figs. 2 and 3 are 4 f states split by the spin-orbit interaction. Occupied states between ⫺6 eV and EF are mainly from the Sc d and Al p states and their hybrids. Oc-cupied Yb s and Lu s states between⫺6 eV and EFand Al s
states between ⫺4 eV and EF are small and featureless. Contribution of these states to the measured optical conduc-tivity would be ignorable and are not included in the DOS figures.
The DOS at EF, N(EF), for ScAl3, YbAl3, and LuAl3
are 1.16, 2.05, and 1.15 共states/eV formula unit兲, respec-tively. N(EF) for ScAl3agrees well with that obtained by Xu
and Freeman7共1.16 states/eV formula unit兲. The Sc d, Yb d, and Lu d partial density of states are plotted in Fig. 4. The big peaks, especially around at 0.9, 2.2, and 3.8 eV, which are weak or are not shown for YbAl3 and LuAl3 exist for
ScAl3. These unoccupied states provide ample final states for interband transitions to occur and contribute to the peaks in the optical conductivity of ScAl3. The calculated partial
den-sity of states of LuAl3is similar to that of Takegahara. 8
[image:5.612.314.558.56.241.2]Their
FIG. 1. Density of states for ScAl3. The solid line represents the
total DOS, the dashed line represents the partial DOS for Sc d states of ScAl3, and the dotted line represents the partial DOS for Al p of
[image:5.612.54.298.57.242.2]ScAl3.
FIG. 2. Density of states for YbAl3. The solid line represents
the total DOS, the dashed line represents the partial DOS for Yb d states of YbAl3, and the dotted line represents the partial DOS for
Al p of YbAl3.
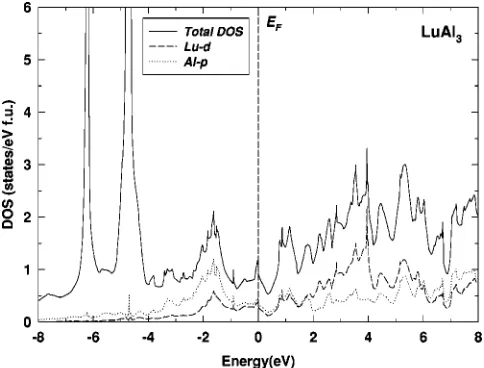
FIG. 3. Density of states for LuAl3. The solid line represents the
total DOS, the dashed line represents the partial DOS for Lu d states of LuAl3, and the dotted line represents the partial DOS for
Al p of LuAl3.
OPTICAL PROPERTIES AND ELECTRONIC . . . PHYSICAL REVIEW B 67, 075104 共2003兲
[image:5.612.317.559.500.684.2]calculation was performed by a self-consistent APW method without orbit interaction. Therefore there was no spin-orbit splitting in the 4 f states of Lu in LuAl3. No theoretical
electronic band structure for YbAl3 has been reported to our knowledge, so we could not compare our results with others. The density of states at the Fermi level in YbAl3 is nearly
twice as large as those of ScAl3 and LuAl3 because the 4 f
electron states are located close to the Fermi level. Brems-strahlung isochromat spectroscopy共BIS兲, which is the coun-terpart of x-ray photoemission spectroscopy 共XPS兲, reveals information on the unoccupied density of states. The broad peak observed around at 5.5 eV in BIS spectrum of LuAl3
共Ref. 9兲 is due to the Lu d and Al p density of states as shown in Fig. 3.
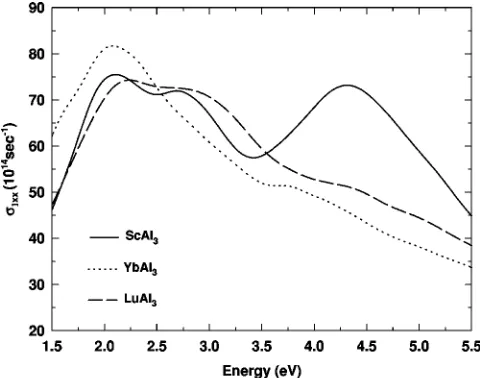
The real and imaginary parts of the optical conductivity (1xx and2xx) measured at room temperature between 1.5
and 5.5 eV for ScAl3, YbAl3, and LuAl3 are shown in Fig. 5. The complex dielectric function can be simply obtained from Eq.共3兲. There are big peaks originating from interband transitions for three compounds between 1 and 2 eV. Addi-tional peaks around 2.9 and 4.2 eV were observed for ScAl3.
Corresponding peaks were not observed for the other two compounds. A weak shoulder was observed around at 2.8 eV for LuAl3. The calculated optical conductivity spectra ob-tained from the band structures of the three compounds are shown in Fig. 6. The peaks at 2.75 and 4.3 eV in the theo-retical 1xx for ScAl3 correspond to the experimental peaks
at 2.9 and 4.2 eV. The contributions to these peaks are from occupied bands having Al p character, hybridized with Sc d bands, to the unoccupied bands having mixed Sc d and Al p character. From the band structure for ScAl3, one can find that the transitions around 4.3 eV occur near the lines R –⌫ and R –M in the irreducible Brillouin zone of the sc lattice. In real situations, there is a surface oxide overlayer of certain thickness and often unknown composition on top of a single crystal sample. To estimate the effect of the overlayer due to oxidation on the optical properties, the three-phase model 共air–overlayer–bulk single crystal13兲 was applied to
the optical conductivity of ScAl3. The oxide overlayer was
[image:6.612.54.297.59.254.2]assumed to be a transparent thin film having a constant ef-fective refractive index of 1.5. The solid line represents the optical conductivity measured immediately after the sample was prepared. The dashed line indicates the optical conduc-tivity data measured 24 h later after the measurement of the
FIG. 4. Comparison of the partial density of states of Sc d, Yb d, and Lu d.
FIG. 5. The real and imaginary parts of the complex optical conductivity spectra for ScAl3, YbAl3, and LuAl3 from
[image:6.612.317.557.506.695.2]spectro-scopic ellipsometry at room temperature.
FIG. 6. The real part of the complex optical conductivity spec-tra,1xx, for ScAl3, YbAl3, and LuAl3calculated from band
struc-tures using FP-LAPW method.
S. J. LEE, J. M. PARK, P. C. CANFIELD, AND D. W. LYNCH PHYSICAL REVIEW B 67, 075104 共2003兲
solid line. As shown in Fig. 7, the reduction of the conduc-tivity spectrum was observed due to oxidation. The dotted line shows the corrected data for the oxidized surface repre-sented by the dashed line using the three-phase model with an oxide thickness of 45 Å. Corrected data agree well with the initial measurement, represented by the solid line. The model shows that the oxide overlayer reduces the magnitude of the optical conductivity. The theoretical optical conductiv-ity obtained from the FP-LAPW is represented by the
dash-dotted line. The magnitude of the theoretical optical conduc-tivity does not agree well, especially around 4.2 eV. Surface roughness, defects, oxidation etc., could alter or reduce the magnitude of the optical conductivity. In this paper, a con-stant broadening parameter is used to account for the finite lifetime of an excited state for a simple procedure. The em-ployment of an energy-dependent broadening function would give a better agreement between theory and experiment by producing a larger broadening effect in the high-energy re-gion.
V. SUMMARY AND CONCLUSION
The optical conductivities of single crystals of ScAl3, YbAl3, and LuAl3 have been measured between 1.5 and 5.5
eV. The experimental optical conductivity spectra of single crystals agree with the calculated values obtained from the self-consistent FP-LAPW method. We considered the effect of an oxide overlayer on the optical response for ScAl3using
a three-phase model. The oxide overlayer on the sample re-duces the magnitude of the optical conductivity and smooths out some features. The difference between the electronic structure of LuAl3and YbAl3 is that the 4 f states of YbAl3
are located near the Fermi energy level while those of LuAl3 are located well below the Fermi level. The distinctive elec-tronic structure of ScAl3 proves the existence of
extraordi-nary large Sc d unoccupied partial densities of states com-pared to those of Yb d and Lu d. These Sc d unoccupied partial densities of states provide ample final states for inter-band transition from Sc p or Al p occupied states and respon-sible for the peaks in1xx of ScAl3.
ACKNOWLEDGMENTS
Ames Laboratory is operated for the U.S. Department of Energy by Iowa State University under Contract No. W-7405-Eng-82. This work was supported by the Director for Energy Research, Office of Basic Energy Science.
1A. Hiess, J. X. Boucherle, F. Givord, J. Schweizer, E. Lelievre-Berna, F. Tasset, B. Gillon, and P. C. Canfield, J. Phys.: Con-dens. Matter 12, 829共2000兲.
2C. M. Varma and Y. Yafet, Phys. Rev. B 13, 2950共1976兲. 3T. Ebihara, S. Uji, C. Terakura, T. Terashima, E. Yamamoto, Y.
Haga, Y. Inada, and Y. Onuki, Physica B 281-282, 754共2000兲. 4I. Sakamoto, G. F. Chen, S. Ohara, H. Harima, and S. Maruno, J.
Alloys Compd. 323-324, 623共2001兲.
5D. M. Rowe, G. Min, V. Kuznetsov, and S. G. K. Williams, Adv. Sci. Technol.共Faenza, Italy兲24, 793共1999兲.
6S. Ohara, G. F. Chen, and I. Sakamoto, J. Alloys Compd. 323-324, 632共2001兲.
7J.-H. Xu and A. J. Freeman, Phys. Rev. B 41, 12 553共1990兲. 8K. Takegahara, Physica B 186-188, 850共1993兲.
9S.-J. Oh, S. Suga, A. Kakizaki, M. Taniguchi, T. Ishii, J.-S. Kang, J. W. Allen, O. Gunnarsson, N. E. Christensen, A. Fujimori, T. Suzuki, T. Kasuya, T. Miyahara, H. Kato, K. Schonhammer, M.
S. Torikachvili, and M. B. Maple, Phys. Rev. B 37, 2861共1988兲. 10G. Bester and M. Fa¨hnle, J. Phys.: Condens. Matter 13, 11551
共2001兲.
11J. M. Lawrence, G. H. Kwei, P. C. Canfield, J. G. DeWitt, and A. C. Lawson, Phys. Rev. B 49, 1627共1994兲.
12J. J. Joyce, A. B. Andrews, A. J. Arko, R. J. Bartlett, R. I. R. Blyth, C. G. Olson, P. J. Benning, P. C. Canfield, and D. M. Poirier, Phys. Rev. B 54, 17 515共1996兲.
13S. J. Lee, S. Y. Hong, I. Fisher, P. C. Canfield, B. N. Harmon, and D. W. Lynch, Phys. Rev. B 61, 10 076共2000兲.
14R. J. Lange, S. J. Lee, K. J. Kim, P. C. Canfield, and D. W. Lynch, Phys. Rev. B 63, 035105共2001兲.
15P. C. Canfield and Z. Fisk, Philos. Mag. B 65, 1117共1992兲. 16Binary Alloy Phase Diagrams, 2nd ed., edited by T. B. Massalski
共The Materials Information Society, Materials Park, OH, 1992兲. 17J. F. Cannon and H. T. Hall, J. Less-Common Met. 40, 313
共1975兲.
FIG. 7. Oxide effect on the optical conductivity spectra for ScAl3. The solid line represents the optical conductivity measured
immediately after the sample was taken out of the ampoule protect-ing the sample from oxidation. The dashed line indicates the optical conductivity data measured 24 h later after the measurement of the solid line. The dotted line shows the corrected data for oxidized surface shown by the dashed line using the three-phase model with the thickness of oxidation of 45 Å. The dash-dotted line represents the theoretical optical conductivity obtained from the FP-LAPW method.
OPTICAL PROPERTIES AND ELECTRONIC . . . PHYSICAL REVIEW B 67, 075104 共2003兲
18R. M. A. Azzam and N. M. Bashara, Ellipsometry and Polarized
Light共North-Holland, Amsterdam, 1986兲.
19D. E. Aspnes and A. A. Studna, Appl. Opt. 14, 220共1975兲. 20
P. Blaha, K. Schwarz, and J. Luitz,WIEN97, A Full Potential
Lin-earized Augmented Plane Wave Package for Calculating Crystal Properties共Technical University, Wien, Austria, 1997兲; P. Blaha, K. Schwarz, P. Sorantin, and S. B. Trickey, Comput. Phys.
Com-mun. 59, 399共1990兲.
21D. D. Koelling and B. N. Harmon, J. Phys. C 10, 3107共1977兲. 22K. J. Kim, T. C. Leung, B. N. Harmon, and D. W. Lynch, J. Phys.:
Condens. Matter 6, 5069共1994兲.
23J. E. Mu¨ller, O. Jepsen, and J. W. Wilkins, Solid State Commun. 42, 365共1982兲.
S. J. LEE, J. M. PARK, P. C. CANFIELD, AND D. W. LYNCH PHYSICAL REVIEW B 67, 075104 共2003兲