Abstract: Concrete is a common construction material used in world because it can take our desired shape with minimum efforts. We know concrete is strong in compression and weak in tension and concept of adding fibers to improve strength of concrete is common in world. So for improving concrete property we add spring(helical) shaped fibers of spring length 25mm and diameter 8mm and aspect ratio 3.125 and length of plane(linear) wire 100mm and diameter 1mm so aspect ratio of plane(linear) wire is 100. Now concrete was reinforced by above mentioned spring fibers in following percentage 0%, 0.5%, 1% and 1.5% by weight of cement. A total 15 cubes of standard size 150mm×150mm×150mm and 15 cylinders of 150mm diameter, 300mm height and 15 beams of 100mm×10mm×500mm were casted and tested after 28 days by compression and split tensile and two point load method respectively for checking strength of concrete in compression, tension and flexure.
Index Terms: Compressive strength, Flexural Strength, Helical Shaped Fiber, Oriented Fiber Reinforced Concrete, , Split Tensile Strength.
I. INTRODUCTION
Reinforced cement concrete:
Reinforced concrete is a mixture of many basic compounds (cement, coarse aggregate, fine aggregate, admixture, water with reinforcement) in a fixed ratio to get desired strength. Those are used in the construction of various structures now days for removal of the old type of construction using timber, rocks etc. Due to their unavailability and cost and very laborious these materials have been replaced by concrete, the strength of which could be altered by altering the quantity of basic composition of the concrete and also adding certain additives which contribute to the strength, durability and workability of it. As the time elapses the growth of the country increases exponentially and to meet the growth of the country certain structure are to be made to sustain it for example, the construction of metro that helps in growth of a country need to be made using material that are highly durable and safe. Due to this the need of making such a concrete whose strength is very high arises but after a certain limit by changing the quantity the strength doesn’t change considerably thus the idea of mixing fibers in concrete was introduced and that helped very much in increasing the strength. In past we use stones, cow dung, mud in
.
Revised Manuscript Received on May 06, 2019
Sabir Khan, Civil engineering, JIMS Engineering Management Technical Campus, GGSIP University, Greater Noida, UP, India,
Dr. Shiv Kumar, Civil engineering, JIMS Engineering Management
construction but we cannot predict the actual strength of that member. After a long period of struggle, Romans made cement – called Pozzolana – before Christ by mixing slaked lime with a volcanic ash from Mount Vesuvius and used it to make concrete for building, the art was lost during the Dark Ages 5th century -15th century A.D. and was not revived until eighteenth and nineteenth centuries (A. D.). Marcus Vitruvius Pollio, Vitruvius, an Architect/Engineer during the golden age of Caesar Augustus (around 25 BC). In his writings around 25 BC in Ten Books on Architecture distinguished types of aggregate appropriate for the preparations of lime mortars. For the use of structural members, he recommended pozzolana, which were volcanic sand from the sandlike beds of Puteoli, brownish-yellow-gray in color near Naples and reddish brown at Rome. He specifies 1 part lime to 3 parts pozzolana for cements use in buildings.
II. OBJECTIVE
The objectives of analysis are:
To gain a better understanding of the structural behavior under the action of the applied loading.
To obtain sets of applied actions which are in equilibrium with reactions and which can be used for the design of individual structural elements.
To check compressive, tensile, flexure strength of concrete under the influence of randomly arranged spring fiber at different percentage with respect to weight of cement.
To check the compressive strength of cubes, split tensile strength of cylinder and flexural strength ofbeams
.
Fig.1 Orientation of Fibers in Cube Mould during Casting
Comparative Study of Oriented and Non
Oriented Fiber Reinforced Concrete
Comparative Study of Oriented and Non Oriented Fiber Reinforced Concrete
I. Estimation of mix ingredients
Volume of concrete 1
Taking 2% for air entrapped 1-0.02 = 0.98
Volume of cement Mass of cement / Specific gravity of cement)×(1/100)
= (372/3.15) × (1/1000) = 0.1180
Volume of water (Mass of water / Specific gravity of water) × (1/1000)
= (186/1) × (1/1000) = 0.186 Volume of total aggregates 0.98 – (0.118 + 0.186)
= 0.694
Mass of coarse aggregates (volume of total aggregate)x(volume of coarse aggregate) × (Specific gravity of coarse aggregate) ×1000
=0.694 ×0.67 × 2.74 ×1000 = 1274.04 kg
Mass of fine aggregates (volume of total aggregate)x(volume of fine aggregate) × (Specific gravity of fine aggregate) ×1000
= 0.694 ×0.33 × 2.74 × 1000 = 618.354 kg
III. TEST PERFORMED
A. Compression test
A compression test can be performed on CTM (Compression Testing Machine) by keeping the test-piece on base block and moving down the central grip to apply load. It can also be performed on a compression testing machine.
A Compression testing machine shown in Fig.2. It has two compression plates/heads. The upper head moveable while the lower head is stationary. Uniform distribution of load over the test- piece ends. A load gauge is fitted for recording the applied load.
Fig.2 COMPRESSION TESTING MACHINE
Fig.3 CUBE SPECIMEN AFTER 28 DAYS B. Split tensile test:
A Split Tensile test can be performed on CTM (Compression Testing Machine) by keeping the test-piece on base block and moving down the central grip to apply load. It can also be performed on a compression testing machine.
Fig.4 SPLIT TENSILE STRENGTH TEST IN CTM SPECIMEN:-15 Cylinder specimen of dimension: diameter
(15cm), height (30cm).
Fig.5 CYLINDER SPECIMENS AFTER 28 DAYS C. Two Point Flexure test:
Flexural test evaluates the tensile strength of concrete indirectly. It tests the ability of unreinforced or reinforced concrete beam or slab to withstand failure in bending. The results of flexural test on concrete expressed as a modulus of rupture which denotes as (MR) in MPa.
The flexural test
on concrete can be conducted using two point load
test. The configuration of the test is shown in Figure.
Fig.6 TWO POINT LOAD TEST
SPECIMEN:-15 Beam specimen of dimension (50 x 10 x 10 )
Fig.7 BEAM SPECIMEN AFTER 28 DAYS
IV. RESULTANDDISCUSSION
A TESTING OF ORIENTED FIBER REINFORCED CONCRETE SPECIMEN
1. Cube
II Compressive Strength at 0%, 0.5%, 1%, 1.5% fiber
Sr. no. % of fiber Load
(KN)
Average Load (KN)
Average Compressive Strength (N/ )
1) 0%
584 590 581
Comparative Study of Oriented and Non Oriented Fiber Reinforced Concrete
2) 0.5%
668 610 627
635 28.22
3) 1.0%
705 730 755
730 32.44
4) 1.5%
632 600 613
615 27.33
Average compressive strength of cube at 0% fiber is 26N/ 2.
In 0.5% fiber increase of 8.53% compressive strength as compare to 0% oriented fibers.
In 1% fiber 24.76% increase in compressive strength as compare to 0% and 14.95% increase in strength as compare to 0.5% oriented fibers.
In 1.5% fiber increase of 5.11% compressive strength as compare to 0% fiber and decrease of 3.15% compressive strength as compare to 0.5% and decrease of 15.75% compressive strength as compare to 1% oriented fibers.
Fig.8 GRAPH FOR COMPRESSIVE STRENGTH WITH ORIENTED FIBERS
2. Cylinder
III Tensile Strength at 0%, 0.5%.1%, 1.5% fibe
Sr. no.
% of
fiber
Load
(KN)
Average Load
(KN)
Average
Tensile Strength
(N/
)
1)
0%
165
140
145
150
2.12
2)
0.5%
180
170
190
180
2.54
3)
1.0%
140
170
170
160
2.26
4)
1.5%
160
165
170
165
2.33
26
28.22
32.44
27.33
0
5
10
15
20
25
30
35
40
45
0%
0.50%
1.00%
1.50%
COM
P
RES
S
IVE
S
T
RENG
T
H
N/m
m
2
--->
PERCENTAGE FIBRE USED --->
Average split tensile strength of cylinder at 0%
fiber is 2.12 N/
2
.
In 0.5% fiber 19.81% increase of tensile strength
as compare to 0% .
In 1% fiber 6.6% increase of tensile strength as
compare to 0% and decrease of 11.02% tensile
strength as compare to 0.5% oriented fibers.
In 1.5% fiber increase of 9.9% tensile strength as
compare to 0% and decrease of 8.26% tensile
strength as compare to 0.5% and increase of
3.09% tensile strength as compare to 1% oriented
fibers.
Fig.9 GRAPH FOR TENSILE STRENGTH WITH ORIENTED FIBERS
3. Beam
IV Flexural Strength at 0%, 0.5%.1%, 1.5% fiber
Sr. no. % of fiber Load
(KN)
Average Load (KN)
Average Flexural Strength
(N/ )
1) 0%
45 49 47
47 4.60
2) 0.5%
60 58 62
60 5.88
3) 1.0%
52 46 52
50 4.90
4) 1.5%
44 50 50
48 4.70
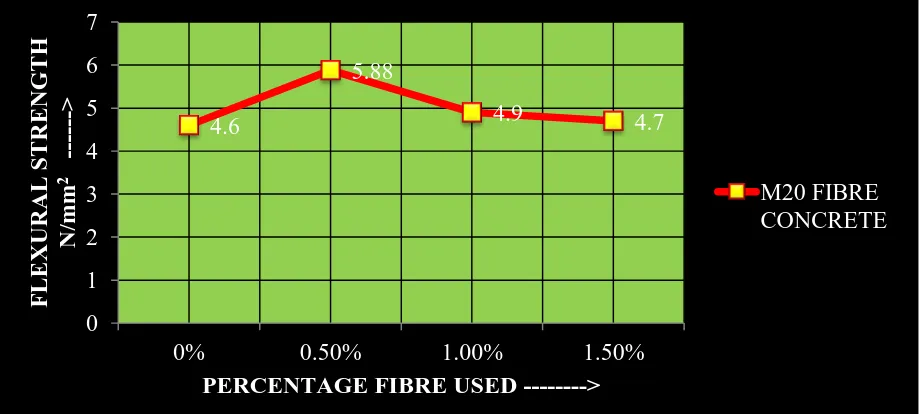
Average split flexural strength of cylinder at 0% fiber is 4.6 N/ 2.
In 0.5% fiber 27.82% increase of flexural strength as compare to 0%.
In 1% fiber 6.52% increase of flexural strength as compare to 0% and decrease of 16.66% flexural strength as compare to 0.5% oriented fibers.
In 1.5% fiber increase of 2.17% flexural strength as compare to 0% and decrease of 20.06% flexural strength as compare to 0.5% and increase
of 4.08% flexural strength as compare to 1% oriented fibers.
2.12
2.54
2.26
2.33
0
0.5
1
1.5
2
2.5
3
3.5
0%
0.50%
1.00%
1.50%
T
E
NSIL
E
S
T
RENG
T
H
N/m
m
2
--->
PERCENTAGE FIBRE USED --->
Comparative Study of Oriented and Non Oriented Fiber Reinforced Concrete
Fig.10 GRAPH FOR FLEXURAL STRENGTH WITH ORIENTED FIBERS
a. Random fiber concrete
[image:6.595.80.518.337.582.2]1. Cube
Table V Compressive Strength at 0%, 0.5%, 1%, 1.5% fiber
Sr. no. % of fiber Load
(KN)
Average Load (KN)
Average Compressive Strength (N/ )
1) 0%
617 623 620
620 27.55
2) 0.5%
665 662 653
660 29.33
3) 1.0%
758 751 756
755 33.55
4) 1.5%
635 624 631
630 28
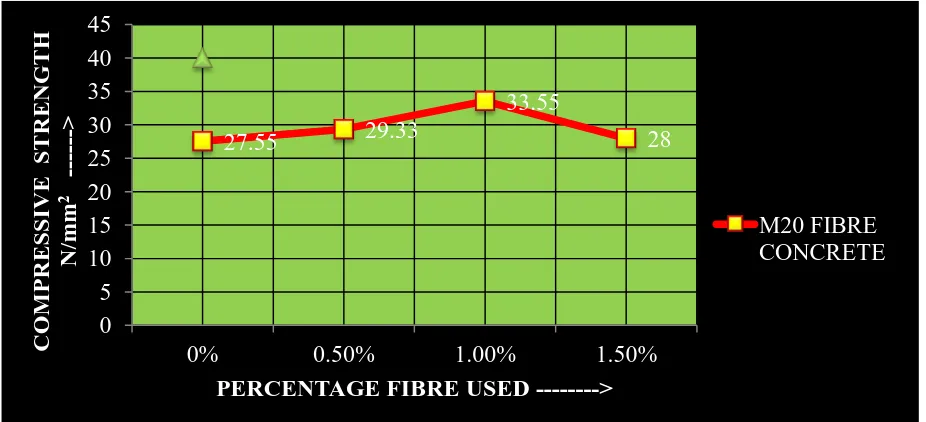
Average compressive strength of cube at 0% fiber is 26N/ 2.
In 0.5% fiber increase of 6.46% compressive strength as compare to 0% oriented fibers.
In 1% fiber 21.77% increase in compressive strength as compare to 0% and 14.38% increase in strength as compare to 0.5% oriented fibers.
In 1.5% fiber increase of 1.63% compressive strength as compare to 0% fiber and decrease of 4.53% compressive strength as compare to 0.5% and decrease of 16.54% compressive strength as compare to 1% oriented fibers.
4.6
5.88
4.9
4.7
0
1
2
3
4
5
6
7
0%
0.50%
1.00%
1.50%
F
LE
X
U
R
A
L S
TREN
G
TH
N/m
m
2
--->
PERCENTAGE FIBRE USED --->
Fig.11 GRAPH FOR COMPRESSIVE STRENGTH WITHOUT ORIENTED FIBER
[image:7.595.77.518.323.548.2]i. Cylinder
Table VI Tensile Strength at 0%, 0.5%.1%, 1.5% fiber
Sr. no. % of fiber Load
(KN)
Average Load (KN)
Average Tensile Strength
(N/ )
1) 0%
124 128 138
130 1.84
2) 0.5%
140 148 138
153 2.16
3) 1.0%
145 155 150
150 2.12
4) 1.5%
168 155 157
152 2.15
Average split tensile strength of cylinder at 0% fiber is 2.12 N/ 2.
In 0.5% fiber 17.39% increase of tensile strength as compare to 0% .
In 1% fiber 15.21% increase of tensile strength as compare to 0% and decrease of 1.85% tensile strength as compare to 0.5% oriented fibers.
In 1.5% fiber increase of 16.84% tensile strength as compare to 0% and decrease of 0.46% tensile strength as compare to 0.5% and increase of 1.41% tensile strength as compare to 1% oriented fibers.
27.55
29.33
33.55
28
0
5
10
15
20
25
30
35
40
45
0%
0.50%
1.00%
1.50%
COM
P
RES
S
IVE
S
T
RENG
T
H
N/m
m
2
--->
PERCENTAGE FIBRE USED --->
Comparative Study of Oriented and Non Oriented Fiber Reinforced Concrete
Fig.12 GRAPH FOR TENSILE STRENGTH WITHOUT ORIENTED FIBERS
ii. Beam
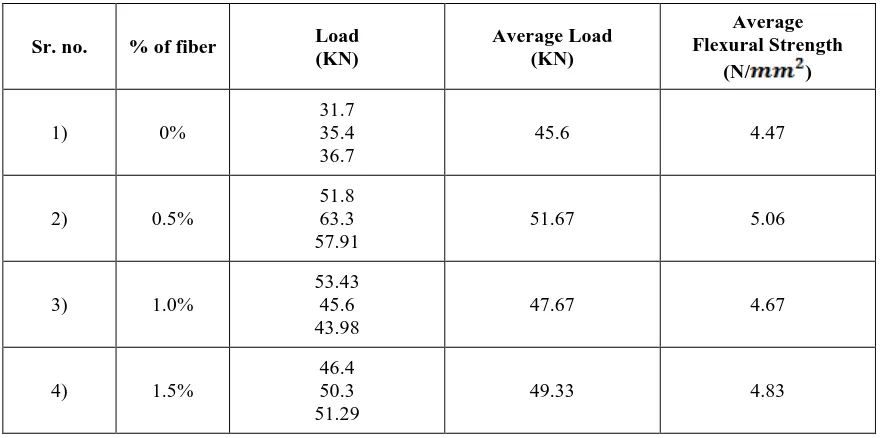
Table VII Flexural Strength at 0%, 0.5%.1%, 1.5% fiber
Sr. no. % of fiber Load
(KN)
Average Load (KN)
Average Flexural Strength
(N/ )
1) 0%
31.7 35.4 36.7
45.6 4.47
2) 0.5%
51.8 63.3 57.91
51.67 5.06
3) 1.0%
53.43 45.6 43.98
47.67 4.67
4) 1.5%
46.4 50.3 51.29
49.33 4.83
Average split flexural strength of cylinder at 0% fiber is 4.47 N/ 2.
In 0.5% fiber 13.19% increase of flexural strength as compare to 0%.
In 1% fiber 4.47% increase of flexural strength as compare to 0% and decrease of 7.7% flexural strength as compare to 0.5% oriented fibers.
In 1.5% fiber increase of 8.05% flexural strength as compare to 0% and decrease of 4.54% flexural strength as compare to 0.5% and increase of 3.42% flexural strength as compare to 1% oriented fibers.
1.84
2.16
2.12
2.15
0
0.5
1
1.5
2
2.5
3
3.5
0%
0.50%
1.00%
1.50%
T
E
NSIL
E
S
T
RENG
T
H
N/m
m
2
--->
PERCENTAGE FIBRE USED --->
[image:8.595.78.518.329.548.2]Fig.13 GRAPH FOR FLEXURAL STRENGTH WITHOUT ORIENTED FIBERS
b. Comparison between oriented and random fibers
i. Graph for Compressive Strength
Fig.14 GRAPH FOR COMPRESSIVE STRENGTH Maximum Compression Strength of Oriented Fiber
Concrete is 32.44 N/ at 1.5% Fiber.
Maximum Compression Strength of Non Oriented Fiber Concrete is 33.55 N/ at 1.5% Fiber.
4.47
5.06
4.67
4.83
0
1
2
3
4
5
6
7
0%
0.50%
1.00%
1.50%
F
L
E
XU
RA
L
S
T
RENG
T
H
N/m
m
2
--->
PERCENTAGE FIBRE USED --->
M20 FIBRE
CONCRETE
27.55
29.33
33.55
28
26
28.22
32.44
27.33
0
5
10
15
20
25
30
35
40
0%
0.50%
1.00%
1.50%
COMP
RES
S
IVE
S
T
RENG
T
H
N/m
m
2
--->
PERCENTAGE FIBRE USED --->
RANDOM
Comparative Study of Oriented and Non Oriented Fiber Reinforced Concrete
Fig.15 GRAPH FOR PERCENTAGE CHANGE IN COMPRESSIVE STRENGTH
ii. Graph for Tensile Strength
Fig.16 GRAPH FOR TENSILE STRENGTH Maximum Tensile Strength of Oriented Fiber Concrete is
2.54 N/ at 0.5% Fiber.
Maximum Tensile Strength of Non Oriented Fiber Concrete is 2.16 N/ at 0.5% Fiber.
iii. Graph for Flexural Strength
0
5
10
15
20
25
30
0.5
1
1.5
P
E
RCE
NT
AG
E
I
NCRE
AS
E
AB
O
UT
0%
--->
% FIBRE USED --->
RANDOM
ORIENTED
1.84
2.16
2.12
2.15
2.12
2.54
2.26
2.33
0
0.5
1
1.5
2
2.5
3
0%
0.50%
1.00%
1.50%
T
E
NSIL
E
S
T
RENG
T
H
N/m
m
2
--->
PERCENTAGE FIBRE USED --->
RANDOM
Fig.17 GRAPH FOR FLEXURAL STRENGTH Maximum Flexural Strength of Oriented Fiber Concrete is
5.88 N/ at 0.5% Fiber.
Maximum Flexural Strength of Non Oriented Fiber Concrete is 5.06 N/ at 0.5% Fiber.
V. CONCLUSION
Compressive Strength Increase As We Increase The Percentage Of Fiber Up To 1 Percent Than It Will Decrease. Split Tensile Strength Increase As We Increase The Percentage Of Fiber Up To 1 Percent Than It Will Decrease. Flexural Strength Increase As We Increase The Percentage Of Fiber Up To 1 Percent Than It Will Decrease. At Same Percentage Of Fiber Compressive Strength, Splittensile Strength And Flexural Strength Of Concrete Also Increases In Oriented Fiber As Compared To Non Oriented Fiber. We Got Maximum Strength Of (32.44 N/Mm2) In M20 Concrete So We Can Use This Concrete Where We Require M25 And Save Money And Earn Profit Of 40.8% Approximately.
REFERENCES
1. GrijaSelvamani, ShanthiniDuraisamy,AbinayaSekar ,“A Review on Fiber Reinforced Concrete”,International Journal of Civil Engineering and Technology (IJCIET) Volume 7, Issue 6, November-December 2016, pp. 386–392.
2. Shrikant M. Harle,“Review on the Performance of Glass Fiber Reinforced Concrete”,International Journal of Civil Engineering Research. ISSN 2278-3652 Volume 5, Number 3 (2014), pp. 281-284. 3. Job Thomas and AnandRamaswamy, “Mechanical Properties of Steel
Fiber Reinforced Concrete”, Journal of Materials in Civil Engineering, Vol.19, No.5, pp. 385-392, 2007.
4. Premalatha, J. and SundaraRajan, R. “Strength Properties of High Strength Fibrous Concrete”, The Indian Concrete Journal, pp.37-41, 2007.
5. Wu Yao, Jie Li and Keru Wu, “Mechanical Properties of Hybrid Fiber-Reinforced Concrete at Low Volume Fraction”, Cement and Concrete Research, Vol.33, pp.27-30, 2003
6. Rami Haddad, H. and AhnedAsteyate, M. “Role of Synthetic Fibers in
Delaying Steel Corrosion Cracks and Improving Bond with Concrete”, Canadian Journal of Civil Engineering, Vol.28, pp.787-793, 2001.
7. Nataraja, M.C., Dhang, N. and Gupta, A.P. “Steel Fiber Reinforced Concrete under Compression”, The Indian Concrete Journal, pp.353-356, 1998.
8. Kumar, V., Suman, S.D. and Mohammad Shamim, “Statistical Prediction of Compressive Strength of Steel Fibe Reinforced Concrete”, ICI Bulletin, No.60, pp.31-36, 1997.
9. ZiadBayasi and PavizSoroushian, “Effect of Steel Fiber Reinforcement on Fresh Mix Properties of Concrete”, ACI Materials Journal, Vol.89, No.4, pp.369-374, 1992.
10. Balaguru, P.N. and Shah, S.P. “Fiber Reinforced Cement Composites” McGraw Hill, In., New York, 1992.
11. Faisal Wafa, F. and Samir Ashour, A. “Mechanical Properties of High Strength Fiber Reinforced Concrete” ACI Materials Journal, Vol. 89, No. 5, pp.449-455, 1992.
12. Ganesan, N. and Ramana Murthy, “Strength and Behaviour of Confined Steel Fiber Reinforced Concrete Columns”, ACI Materials Journal, Vol.87, No.3, pp.221-227, 1990.
13. PavizSoroushian and Cha-Don Lee, “Distribution and Orientation of Fibers in Steel Fiber Reinforced Concrete”, ACI Materials Journal, Vol.87, No.5, pp.433-439, 1990.
14. Goash, S., Bhattacharya and Ray, S.P. “Tensile Strength of Steel Fiber Reinforced Concrete”, IE (I) Journal-CI, Vol.69, pp.222-227, 1989. 15. Kukreja, C.B., Kaushik, S.K., Kanchi, M.B. and Jain, O.P. “Tensile
Strength of Steel Fiber Reinforced Concrete”, Indian Concrete Journal, pp.184-188, 1980
16. http://home.iitk.ac.in/
17. http://www.wikipedia.org/
18. http://shodhganga.inflibnet.ac.in/bitstream/10603/29847/7/07_chapter2 .pdf
19. IS 456:2000 “Code of Practice for Plain and Reinforced concrete”
4.47
5.06
4.67
4.83
4.6
5.88
4.9
4.7
0
1
2
3
4
5
6
7
0%
0.50%
1.00%
1.50%
F
L
E
XU
RA
L
S
T
RENG
T
H
N/m
m
2--->
PERCENTAGE FIBRE USED --->
RANDOM
Comparative Study of Oriented and Non Oriented Fiber Reinforced Concrete
20. IS 516: 1959 Method of Tests for Strength of Concrete 21. IS 10262:2009 Concrete design Mix
AUTHORSPROFILE
SABIR KHAN Completed His B.Tech Civil Engineering And M.Tech Structural Engineering From Aligarh Muslim University Aligarh. He has more than 6 years of teaching experience. He Published 6 International Journal Paper.
Dr. Shiv Kumar obtained PhD from IIT Roorkee in