in the population sciences published by the Max Planck Institute for Demographic Research Konrad-Zuse Str. 1, D-18057 Rostock · GERMANY www.demographic-research.org
DEMOGRAPHIC RESEARCH
VOLUME 19, ARTICLE 21, PAGES 743-794
PUBLISHED 01 JULY 2008
http://www.demographic-research.org/Volumes/Vol19/21/ DOI: 10.4054/DemRes.2008.19.21
Research Article
The Netherlands:
Childbearing within the context of a
“Poldermodel” society
Tineke Fokkema
Helga de Valk
Joop de Beer
Coen van Duin
This publication is part of Special Collection 7: Childbearing Trends and Policies in Europe (http://www.demographic-research.org/special/7/)
© 2008 Fokkema et al.
1 Introduction 744
2 Fertility trends 748
2.1 Period and cohort fertility 748
2.2 Family size 749
2.3 Age at motherhood 752
2.4 Teenage pregnancy 754
2.5 Extramarital fertility 756
3 Life course transitions 757
3.1 Leaving the parental home 757
3.2 Unmarried cohabitation and marriage 759
3.3 Mean age at first marriage 760
3.4 Divorce 762
4 Family planning 766
4.1 Contraception 766
4.2 Abortion 768
5 Social and cultural conditions 770
5.1 Education 770
5.2 Female labor-force participation 772
5.3 Business cycle and swings in period fertility 774
5.4 The impact of immigration 776
6 Family policies 783
6.1 The governmental view 783
6.2 Child allowance 786
6.3 Parental leave 786
6.4 Childcare 787
6.5 Preferred family policy measures and their expected impact on reproductive behavior
788
7 Summary and concluding remarks 788
The Netherlands:
Childbearing within the context of a “Poldermodel” society
Tineke Fokkema1 Helga de Valk2
Joop de Beer3 Coen van Duin4
Abstract
The Netherlands has seen a considerable decline of the period total fertility rate and delayed childbearing, just like all other European countries. The drop in fertility, however, has not been as sharp as in many other regions of Europe. The period total fertility rate in the Netherlands has stabilized since the late 1970s at around 1.6 children per woman, and it has even risen slightly since 1995. In addition, although the Netherlands has one of the oldest first-time mothers, completed fertility is still rather high compared to other European countries, suggesting a strong “catching up” of births by women in their thirties. This chapter provides a comprehensive overview of the main driving forces behind specific fertility trends in the Netherlands. Among other factors, it focuses on changing patterns of home leaving and union formation, declining partnership stability, and the growing acceptability and use of contraception. The chapter also looks at prolonged education, rising labor-force participation of women, economic uncertainties, the growing migrant population, and family policies. Data allowing, and to the extent possible, we examine the effects of these factors on decision-making about parenthood and the timing of childbearing.
1 Netherlands Interdisciplinary Demographic Institute; Social Demography. E-mail: [email protected].
2 Netherlands Interdisciplinary Demographic Institute; Projections, Migration and Health.
E-mail: [email protected]
3 Netherlands Interdisciplinary Demographic Institute; Projections, Migration and Health.
E-mail: [email protected]
1. Introduction
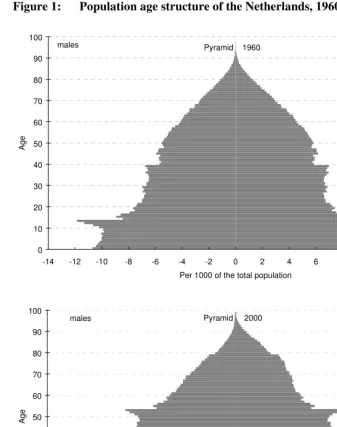
In 2005, the Netherlands had a registered population of 16.3 million. With 484 persons per square kilometers, it is the second most densely populated country in the EU after Malta. Over the last century, the population of the Netherlands has risen by about 100,000 people a year. Nevertheless, population growth has been slowing down rapidly since 2000 due to a declining number of births, falling numbers of immigrants, and rising numbers of emigrants. In 2005, the population grew by only 30,000 persons, which is the lowest level of growth recorded since 1900. Current projections (base year 2006) by Statistics Netherlands expect growth to remain close to zero in the coming decades (Garssen and Van Duin 2006). After 2035, the population size is expected to decline at a rate of some 15,000 persons a year.
Around 1970, the Netherlands experienced a substantial decline in the number of births. The period of high fertility (the so called “baby boom”) after the end of the Second World War ended in the late 1960s. Between 1969 and 1975, births were reduced by a third. Within a decade (1965–1975), the period total fertility rate fell from 3.04, conspicuously higher than the European average, to 1.66, below the EU–15 average. Declining fertility in the Netherlands, however, came to a halt in the mid-1970s and even a slight recovery has been observed since 1995. However, the fertility rate has never been above replacement since 1973.
Figure 1: Population age structure of the Netherlands, 1960, 2000, and 2040
0 10 20 30 40 50 60 70 80 90 100
-14 -12 -10 -8 -6 -4 -2 0 2 4 6 8 10 12 14
Per 1000 of the total population
A
g
e
males Pyramid 1960 females
0 10 20 30 40 50 60 70 80 90 100
-14 -12 -10 -8 -6 -4 -2 0 2 4 6 8 10 12 14
Per 1000 of the total population
A
g
e
Figure 1: (Continued) Population age structure of the Netherlands, 1960, 2000, and 2040
0 10 20 30 40 50 60 70 80 90 100
-14 -12 -10 -8 -6 -4 -2 0 2 4 6 8 10 12 14
Per 1000 of the total population
A
g
e
males Pyramid 2040 females
Source: Statistics Netherlands.
In addition to declining fertility, the mean age of mothers at first birth has drastically increased. For many years now, the Netherlands have had the oldest first-time mothers in the world. The mean age at first birth rose from 24.8 years in 1970 to 28.9 years in 2004. Although Dutch women have postponed childbearing more than in almost any other European country (only Spain had a higher mean age at first birth, 29.3, in 2004), women in the Netherlands also displayed a pronounced “catching up” of delayed births after age 30. Accordingly, women who have completed their families (now in their late 40s) had 1.87 (born in 1957) to 1.85 (born in 1960) children on average, which is quite high compared to other European countries.
commitments and transitions (e.g., delayed marriage, the postponement of leaving the parental home), lower levels of commitment between partners (e.g., replacing marriage by cohabitation or other unconventional living arrangements), more egalitarian relationships between partners, and a lower stability of partnerships (Lesthaeghe and Van de Kaa 1986, Lesthaeghe and Surkyn 1988, Van de Kaa 1987). These changes are explained by socio-economic as well as cultural shifts in society (Liefbroer and Dykstra 2000). Since the mid-1960s, contraceptive use has become increasingly widespread and more efficient, thus weakening fertility desires. The latter was also impacted by rising educational attainment and the growing participation of women in the labor force. Changes in norms, values, and attitudes toward union formation and (gender roles within) partner relationships as well as parenthood and first birth timing have contributed to this change in fertility. Processes of emancipation, individualization and secularization have fuelled these changes in values (Beck 1990, Lesthaeghe and Van de Kaa 1986).
The Dutch “Poldermodel” helps us to understand why completed fertility in the Netherlands is still rather high by European standards. This successful consensus-model of the 1990s is based on the fact that employers, trade unions, and the government tackle socio-economic problems together. Through agreement on wage restraint, adjustments to the social security system, and the development of an active labor market policy, the economic crisis of the 1980s5 (“the Dutch disease”) turned into economic recovery in the 1990s (“the Dutch miracle”), seeing one of the lowest unemployment rates in Europe (5.7% in 1997). Consensus on wage restraint was gained in exchange for more part-time and flexible jobs. Together with an expansion of child-care services, these arrangements facilitated childbearing and employment compatibility among women (Liefbroer 1999).
The aim of this chapter is to give a comprehensive overview of the expected main driving factors behind specific fertility trends and the current situation in the Netherlands. After a detailed description of fertility trends among the Dutch population, Section 3 examines family changes that have influenced fertility. Section 4 focuses on family planning by looking at changes in contraceptive and abortion behavior. Trends in social and cultural conditions and their association with fertility are the main focus of Section 5, concentrating on the fertility impact of the business cycle as well as immigration. Section 6 deals with major family policy measures, current and preferred, and their perceived effects on fertility. The chapter ends with a summary and some concluding remarks.
5 The economic crisis was marked by low economic growth, high unemployment, a high influx of disabled
2. Fertility trends
2.1 Period and cohort fertility
Figure 2 compares the Total Period Fertility Rate (TPFR) for each calendar year between 1950 and 2004 and the ultimate level of fertility of cohorts (TCFR) aged 29 in that year (the average age at childbearing in the 1975–2004 period). As the ultimate number of children for young generations is not yet observed, the figures on cohort fertility are partly based on the most recent Dutch population projections produced by Statistics Netherlands in 2006 (see www.cbs.nl).
Figure 2: TPFR and TCFR (cohort + 29 years), the Netherlands, 1950 (cohort 1921) – 2004 (cohort 1975)
0.0 0.5 1.0 1.5 2.0 2.5 3.0 3.5
1950 1955 1960 1965 1970 1975 1980 1985 1990 1995 2000
N
u
m
b
e
r
o
f
c
h
ild
re
n
p
e
r
w
o
m
a
n
period
cohort (aged 29 years)
The TPFR sharply declined in the Netherlands since the mid-1960s and fell below the replacement level (2.1) in 1973. It reached its lowest level in 1983, 1.47 children per woman. During the following decade, it stabilized and slightly reversed, ranging from 1.49 to 1.62 children per woman. Since 1995, the Netherlands has even been witnessing an increase in the TPFR to the current (2004) level of 1.73 children per woman. The recent trend sharply contrasts the persistent TPFR declines in Southern, Central, and Eastern Europe to levels below 1.3 children per woman. Nonetheless, in the Netherlands the TPFR has been well below replacement level for more than three decades.
A substantial decline in cohort fertility started for women born after 1921, falling from 2.9 children to below replacement from the 1943 cohort onwards. Cohort fertility has declined only slightly across cohorts born between 1950 and 1975, however, from 1.9 to 1.8 children. Although the fertility of the cohorts from about 1965 onwards is still rather uncertain (these women have not yet finished their reproductive life), there are no indications for a strong downward or upward trend of their TCFR. Thus, the oscillations in the TPFR in the 1980s and 1990s, which were partly affected by the business cycle (see below), did not produce significant changes in completed cohort fertility. In other words, the fluctuations in the TPFR have been due to changes in the timing of fertility rather than changes in the ultimate level of fertility.
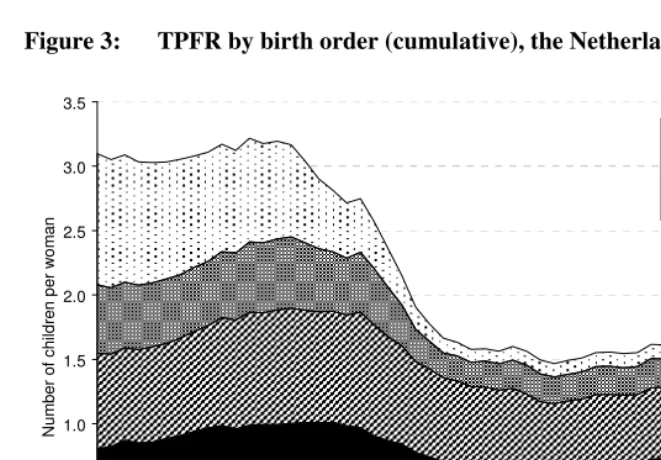
2.2 Family size
Figure 3: TPFR by birth order (cumulative), the Netherlands, 1950–2004
0.0 0.5 1.0 1.5 2.0 2.5 3.0 3.5
1950 1955 1960 1965 1970 1975 1980 1985 1990 1995 2000
N
u
m
b
e
r
o
f
c
h
ild
re
n
p
e
r
w
o
m
a
n
4th child or higher
3rd child 2nd child
1st child
Source: Statistics Netherlands
Figure 4: Cohort parity distribution, the Netherlands, cohorts 1935–1965
0% 10% 20% 30% 40% 50% 60%
1935 1940 1945 1950 1955 1960 1965
0 children 1 child 2 children 3 children 4 or more children
Source: Statistics Netherlands
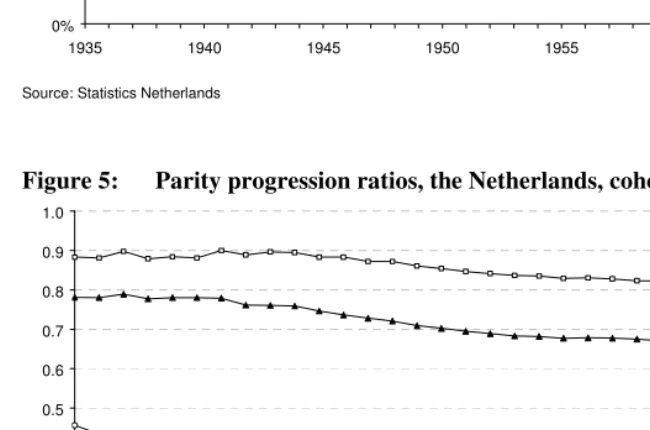
Figure 5: Parity progression ratios, the Netherlands, cohorts 1935–1965
0.0 0.1 0.2 0.3 0.4 0.5 0.6 0.7 0.8 0.9 1.0
1935 1940 1945 1950 1955 1960 1965
PPR 0-1 PPR 1-2 PPR 2-3 PPR 3-4
2.3 Age at motherhood
Dutch women have one of the highest ages at first birth worldwide. In 2003, the average age at which they had a child was 30.4 years compared to 29.5 years in EU–15. Since 1950, the mother’s mean age at childbirth has dropped initially, but started to rise from 1971 onwards for first-born babies, narrowing the timeframe for fertility (Figure 6). Since 1970, the mean age at first birth has increased by more than 4 years, from 24.8 to 28.9 years in 2004. The trend towards delayed childbearing contributed to a substantial decline in the TPFR in the 1970s (see Figure 2). Whereas the sharp reduction in the TPFR between 1965 and 1975 was caused by TCFR decline among the 1935–1945 cohorts, the development of the TPFR since 1975 has mainly been affected by changes in the timing of childbearing rather than by changes in the TCFR. Until the mid-1990s, the TPFR remained more or less constant due to declining fertility at young ages from the first half of the 1970s onwards on the one hand, and rising fertility at
Figure 6: Mean age of women at childbirth by birth order, the Netherlands, 1950–2004
20 22 24 26 28 30 32 34 36
1950 1955 1960 1965 1970 1975 1980 1985 1990 1995 2000
A
g
e
All children 1st child 2nd child 3rd child 4th child or higher
Figure 7: TPFR by age of women at childbirth, the Netherlands, 1970–2004
0.0 0.5 1.0 1.5 2.0 2.5 3.0
1970 1974 1978 1982 1986 1990 1994 1998 2002
N
u
m
b
e
r
o
f
c
h
ild
re
n
p
e
r
w
o
m
a
n
TFR
< 30 years
30+ years
Source: Statistics Netherlands
older ages on the other (see Figure 7). At the same time, the TPFR has constantly been lower than the TCFR. In the mid-1990s, the decline of fertility rates at young ages came to an end, but fertility increase at older ages has been continuing since. As a consequence, the TPFR started to rise in the mid-1990s and approached the fertility level of cohorts around the turn of the century.
The trend towards delayed childbearing and towards narrowing the timeframe for fertility is illustrated best by comparing age-specific fertility rates across a number of years (see Figure 8). In the period 1950–1970, fertility rates increased among women at prime childbearing ages and declined among women at older ages. In 1970, fertility reached highest levels at ages 25–26. In the next decade, fertility rates declined at both younger and older ages, with a lower fertility level and a less pronounced peak at ages 26–27 in 1980. Since then, fertility rates at younger ages have further been declining, while the fertility of women aged 30 and above has risen. As a result, the peak in fertility rates has shifted to ages 29–31.
Figure 8: Age-specific fertility rates among women aged 15–45, the Netherlands, selected years 1950–2005
0 50 100 150 200 250
15 20 25 30 35 40 45
Age
F
e
rt
ili
ty
r
a
te
(
p
e
r
1
0
0
0
w
o
m
e
n
)
1950 1960
1970 1980
1990 2000
2005
Source: Statistics Netherlands
2.4 Teenage pregnancy
Figure 9: Birth rates per 1000 teenage women by age, the Netherlands, 1950–2004 0 5 10 15 20 25 30 35 40 45 50 55 60
1950 1955 1960 1965 1970 1975 1980 1985 1990 1995 2000
B ir th r a te ( p e r 1 0 0 0 t e e n a g e w o m e n ) 15 years 16 years 17 years 18 years 19 years 15-19 years
Source: Computations based on CBS Statline database
Figure 10: Teenage motherhood by age and ethnicity, the Netherlands, 2004
0% 20% 40% 60% 80% 100%
Other non-western foreign Neth. Antilles/Aruba Suriname Morocco Turkey Non-western foreign Western foreign Native Dutch
younger than 16 years 16 years 17 years 18 years 19 years
Source: Statistics Netherlands
2.5 Extramarital fertility
Figure 11: Extramarital births as a percentage of all live births, the Netherlands, 1950–2004
0 5 10 15 20 25 30 35 40 45 50
1950 1955 1960 1965 1970 1975 1980 1985 1990 1995 2000
E
x
tr
a
m
u
ra
l
b
ir
th
s
(
a
s
p
e
rc
e
n
t
o
f
a
ll
liv
e
b
ir
th
s
)
Source: Statistics Netherlands
3. Life course transitions
3.1 Leaving the parental home
Together with the growing importance attached to independence, the median age at which young adults leave the parental home has declined. This applies in particular to the 1941–1960 cohorts (Liefbroer and Dykstra 2000). For young adults born after 1960, the trend reversed: They stayed with their parents longer, resulting in higher ages of leaving home in the 1980s and 1990s. Among the factors that have contributed to this delay are an increase in the age of completing secondary education, smaller families, larger houses, greater parental tolerance towards their children, and the financial burden of starting a one-person household (Van Hoorn 2001). At the beginning of this century, however, the age of home leaving decreased again, among other factors possibly as the result of low youth unemployment. Cohort analyses by Liefbroer and Dykstra (2000) on patterns of leaving home furthermore show that the time span in which young adults leave the parental home has been narrowing in the cohorts born since 1900: The age is more compressed for cohorts born after 1941.
On average, Dutch girls are leaving home at a younger age than boys, a pattern that has been observed for several decades (Figure 12). While most Dutch girls
Figure 12: Average age at leaving home by gender, the Netherlands, 1965–2002
19 20 21 22 23 24
1965-1969 1970-1974 1975-1979 1980-1984 1985-1989 1990-1994 1995-1999 2000-2002
Period of leaving home
A
g
e
boys
currently leave their parental home at around 20–21 years of age, most boys do so two years later (Van Hoorn 2001). In addition, the lower their education, the longer do young adults stay with their parents. Vocational college and university are often not situated in the neighborhood of their parental home and this may be one of the reasons why young people pursuing higher education leave home at a younger age on average.
3.2 Unmarried cohabitation and marriage
Among people born before 1950, the large majority started to live with their partner within the context of a married union. Among subsequent cohorts, unmarried cohabitation with a partner became ever more important. Of all young people born between 1961 and 1970, 69% started to live with a first partner in an unmarried union (Liefbroer and Dykstra 2000). Today, the majority of young adults start their relational career with cohabitation. In 2005, 67% of 20–29-year-old couples cohabited compared to 49% among the same age group ten years earlier. Even though unmarried cohabitation is now widely accepted and increasingly viewed as a suitable alternative to marriage, most of the young couples ultimately get married. This is especially the case when they want to become or just have become parents (Alders and De Graaf 2001). As a result, the percentage of cohabiting couples is reduced to 31% among those aged 30– 39 years (2005).
Figure 13: Preferences for different types of relationships, the Netherlands, 1990–2002
0% 10% 20% 30% 40% 50% 60% 70% 80% 90% 100%
1990 1994 1997 2000 2002
no steady relationship
LAT-relationship
unmarried cohabitation, no marriage
unmarried cohabitation, then marriage married directly
other
Source: Population Policy Acceptance Surveys (own calculations)
Figures of the Family and Fertility Survey 2003 show that adults who are in a partner relationship but who are not cohabiting with their partner are the majority among the youngest age groups. The majority of them intend to live with their partner in the future. Around 20% of persons aged 30–60 are in a steady relationship but do not live together with their partner. Around 40% of them have no intention of living together and thus prefer to have a LAT-relationship. It is in particular women aged 40+ who prefer a LAT-relationship. A substantial share of them is divorced and has children from a previous relationship (De Graaf and Loozen 2004).
3.3 Mean age at first marriage
although younger cohorts postpone marriage, they do not delay much their entry into cohabiting union (Liefbroer and Dykstra 2000).
The mean age of women at first marriage has been increasing steadily since the early 1980s (Figure 14). On average, in 1980 a Dutch woman married for the first time at the age of 23.2. In 2004, the average age was 28.7 years. The trend is similar to trends seen in the mean age at first birth (see Figure 6).
Figure 14: Mean age at female first marriage, the Netherlands, 1960–2004
20 22 24 26 28 30
1960 1965 1970 1975 1980 1985 1990 1995 2000
A
g
e
Source: Statistics Netherlands
after 1 April 2001, the date homosexual couples can officially marry. Since then, between 2 and 3% of all new marriages have been marriages between two men or two women. The introduction of same-sex marriages, however, did not prevent the total number of marriages from decreasing rapidly.
Figure 15: Total female first marriage rate (<50 completed years) and total divorce rate, the Netherlands, 1960–2004
0.0 0.2 0.4 0.6 0.8 1.0 1.2
1960 1965 1970 1975 1980 1985 1990 1995 2000
F
ir
s
t
m
a
rr
ia
g
e
r
a
te
0.0 0.1 0.2 0.3 0.4 0.5
D
iv
o
rc
e
r
a
te
First marriage rate
Divorce rate
Source: Statistics Netherlands
3.4 Divorce
As Van Poppel and De Beer (1993) showed, the rapid increase of divorce in the late 1960s and early 1970s is partly related to the liberalization of the Divorce Act in 1971. If both parties sign a petition declaring that they think the marriage has irreversibly failed, divorce is granted automatically6. The legal change resulted in a normalization of divorce in Dutch society. This does not mean, however, that the Dutch population views the increasing number of divorces as desirable. Recent data from the Dutch Population Policy Acceptance Surveys show quite the reverse (Figure 16). In 2002, for example, more than 80% considered the trend of divorce as bad or very bad. This percentage has hardly changed since 1990.
Figure 16: Opinion on the increasing number of divorces, the Netherlands, 1990–2002
0% 10% 20% 30% 40% 50% 60% 70% 80% 90% 100%
1990 1994 1997 2000 2002
excellent good
neither good, nor bad bad
very bad
Source: Population Policy Acceptance Surveys (own calculations)
The rise in divorce is partially attributable to the steady rise in educational attainment and female labor-force participation (see Sections 5.1 and 5.2), which eroded the binding attributes of the traditional gender division within marriage and reduced the so-called exit costs (Becker 1981). Many studies have reported partial or full support for this, the so-called economic independence hypothesis (see e.g., Brines and Joyner 1999, Trussell et al. 1992). Dutch research, however, produced only empirical evidence for the economic independence hypothesis among older cohorts of women (Fokkema and Liefbroer 2004). Women’s greater economic independence does not seem to play an important role in divorce decisions among the younger cohorts in the Netherlands (Poortman 2002). This has probably to do with the expansion of the welfare state since the 1960s. In 1971, a few years after the introduction of the General Social Security Act, divorced non-working women were also given entitlement to the minimum of financial support provided by the State (social security benefits). This meant that they were no longer economically dependent on their former partners (Van den Akker 1984). Divorce has therefore also become an option for women who devote all of their time to homemaking and childrearing. This is not to say, however, that managing on social security benefits alone is an easy task for one-parent families (Corpeleijn et al. 1998).
Since the mid-1980s, the number of divorces has more or less stabilized, varying between 28,000 (1987 and 1988) and 37,000 (2001). The reason most often mentioned is the rapid popularity of cohabitation which started in the 1970s (see Section 3.2). People in unmarried cohabitation are more likely to separate than married people. Consequently, the least stable relationships are dissolved before it comes to marriage. In addition, although cohabitation effectively amounts to a “trial marriage”, previous studies show that marriages are more stable among couples who did not cohabit previously (see e.g., Fokkema and Liefbroer 2004, Lillard et al. 1995). The rationale is that married couples who do cohabit prior to getting married have less traditional attitudes (Axinn and Barber 1997).
Figure 17: Annual number of divorces and flash annulments, the Netherlands, 1995–2005
30 31 32 33 34 35 36 37 38 39
1995 1996 1997 1998 1999 2000 2001 2002 2003 2004 2005
x
1
0
0
0
Flash annulments Divorces
Source: CBS
4. Family planning
4.1 Contraception
Up to the 1960s, family planning was taboo in Dutch society as it was regarded contrary to the objectives of marriage and as promoting promiscuity. Thus, it was forbidden to sell or advertise contraceptives. The situation changed spectacularly between 1965 and 1975. Within a decade, family planning gained increasing acceptance, prompted by concerns about the prospect of overpopulation (see Section 6.1). In 1969, the government removed the statutory prohibition on contraceptives; in 1971, contraceptives were covered by national health insurance, resulting in the widespread use of them. Two years later, sterilization was added to the coverage. In addition, special family planning clinics became eligible for government grants. So, within a short space of time, reliable use of birth control has become common practice in the Netherlands.
The proponents of the Second Demographic Transition have repeatedly stressed the catalytic role of modern contraception in the behavioral and cultural change that characterizes this transition (Sobotka 2004). Modern contraception has facilitated fertility postponement and has opened up opportunities for new aspirations to be fulfilled prior to parenthood (Lesthaeghe and Neels 2002: 333). Van de Kaa (1994: 114) links increased contraceptive use with changes in living arrangements and intimate relations. Thanks to efficient contraception, women are able to have sexual relationships without the fear of unwanted and “mistimed” pregnancies and births. Furthermore, Beets et al. (2001: 21) have aptly pointed out that in the Netherlands modern contraception has changed the obvious perception of “having children” (kinderen krijgen) to decision-making as to whether or not to “take children” (kinderen nemen).
In 2003, two-thirds of all Dutch women aged between 18 and 45 used contraceptives. About 8% was pregnant or wanted to become pregnant, 8% was infertile and only 17% did not use any kind of contraceptive method. Detailed analyses reveal that it is mainly females without a (steady male) partner or with a partner with whom they do not live who do not rely on contraception.
The pill is especially popular among “younger” women: As we see in Figure 18, the percentage of women who use the pill increases steeply, from 40% starting at the age of 16 to 75% among 22-year-olds. After this age, it decreases gradually to around 15% of women aged 49 years. Obviously, the decline in pill use is strongly related to the desire to start a family. Once women have completed their family, they often switch to other forms of contraception, such as IUD or sterilization. However, because women enter motherhood later in life (see Section 2.3), sterilization has gradually shifted to an older age over time: The proportion of women born in the late 1960s who are either sterilized or have a sterilized partner is smaller than the corresponding proportion of women born in the 1950s or early 1960s (see Figure 19).
Figure 18: Women using contraceptive pill by age, the Netherlands, 2003
0 10 20 30 40 50 60 70 80 90 100
16 18 20 22 24 26 28 30 32 34 36 38 40 42 44 46 48
P
e
rc
e
n
t
Age
Figure 19: Sterilized women and women with a sterilized partner, by birth generation, the Netherlands, 2003
0 5 10 15 20 25 30 35
18 20 22 24 26 28 30 32 34 36 38 40 42 Age of woman by sterilisation of man or woman
P
e
rc
e
n
t
1950-1954
1955-1959
1960-1964
1965-1969
Source: Statistics Netherlands
4.2 Abortion
Due to the sudden widespread acceptance and practice of family planning from the second half of the 1960s onwards, abortion assistance was getting under way as well. Since 1971, the number of private non-profit clinics that provide safe, reliable abortions has increased rapidly, even though abortion at the time was still illegal. Liberalizing the abortion laws was a difficult process. The Termination of Pregnancy Act was eventually enacted in November 1984; however, before then convictions based on the old legislation were relatively rare.
procedure no later than 21 weeks and a few days into the pregnancy. Women resident in the Netherlands are able to obtain an abortion free of charge. The costs of a termination are covered by national health insurance.
Figure 20: Number of induced abortions among resident and non-resident women, the Netherlands, 1980–2004
0 10000 20000 30000 40000 50000 60000
1980 1984 1988 1992 1996 2000 2004
N
u
m
b
e
r
o
f
a
b
o
rt
io
n
s
Non-residents
Residents
Source: Health Care Inspectorate
In 1980, 56400 induced abortions (including those induced by abortion pills) were performed: Of these, 19700 women were residents in the Netherlands and 36700 were not (Figure 20). Since then, the yearly number of abortions has declined considerably, e.g., it was down to 29266 in 1997. During 1998–2004, however, the total number of abortions increased again, from 30714 to 34168. Nevertheless, the country still has one of the lowest abortion rates in the world and this is closely connected with the widespread use of contraceptives (see Section 4.1): The number of abortions can be seen as a mirror of unplanned and unwanted pregnancies.
number of women from other European countries who come to the Netherlands for an abortion (Figure 20). Neither is it fully attributable to an increasing number of women at fertile ages (15–44), since the abortion rate (the total number of abortions divided by the number of women aged 15–44) has risen as well: from 6.5 in 1997 to 8.7 in 2002 per 1000 women.
The main inter-related explanatory factors of the recent increase in abortions are: less effective use of contraception compared to previous years, a declining number of men and women in the “older” fertility age groups who are sterilized (Arnolds et al. 2000, De Graaf 1998), growing numbers of young women who do not use contraception at all (Beerthuizen 2003, De Graaf 1998), and an increasing share of well-known risk groups: teenagers and women from ethnic minorities. About 15 of 100 women who terminate a pregnancy are younger than 20 years of age. In addition, some 60% of abortion clients have an ethnic minority background. Roughly 30% of this group originates from Suriname and the Netherlands Antilles, 15% are of Turkish or Moroccan origin, and the remaining 55% originate from other countries in Africa, Europe, and Asia. The abortion rate of the four main ethnic minority groups (Suriname, the Netherlands Antilles, Turkey and Morocco) is between three and almost ten times higher than that of the rest of the Dutch population.
Although the abortion rate among teenagers is extremely low by international standards and although it is also below the abortion rate of other women of reproductive age, the Dutch government takes the problem very seriously. Sex education is now an important issue in schools, and special services are available for teenagers. Special attention is also given to ethnic minorities. Over the past 15 years, family planning research in the Netherlands has specifically targeted the Surinamese, Antillean, Turkish, and Moroccan communities.
5. Social and cultural conditions
5.1 Education
Cohort analyses by Liefbroer and Dykstra (2000) show that higher educated women have a first child at a much higher age than the less educated. This difference increased among the younger female cohorts. Figure 21 shows an overview of the median ages at first birth for women with different educational levels by cohort. The rising age at childbirth started and is strongest among the higher educated women. It is often suggested that the lower educated follow this pattern.
The ultimate family size differs by women’s educational level as well. While women from the 1960–1964 cohort with a low or medium level of education have an average family size of 1.9 and 1.8, respectively, women with the highest level of education have on average 1.6 children. The smaller family size among the highly educated women is mainly caused by a higher percentage of childlessness: 29 compared to 16 (low) and 18 (medium), respectively.
Figure 21: Age at which 50% of women had a first child per educational level and per 10-year birth cohort
24 25 26 27 28 29 30 31 32 33 34
1901-1910 1911-1920 1921-1930 1931-1940 1941-1950 1951-1960 1961-1970
A
g
e
low
medium
high
The literature provides different explanations on these fertility differentials by educational level: One of the explanations is that higher educated women postpone childbearing and are more reluctant to start a family because it is difficult to combine a career with motherhood. As higher educated women made substantial investments in their education, they are held to be more strongly attached to career building, leading to higher “opportunity costs” of having a child (Liefbroer 2005). Another view holds that individuals with higher education are less resistant to normative pressures and embrace values such as independence and personal autonomy (De Feijter 1991). Yet another explanation is that higher educated women spent a substantial period of time in education, thus resulting in a higher age at which family formation is started (Beets 2004, Liefbroer and Corijn 1999, Liefbroer and Dykstra 2000). Beets et al. (2001) estimates that an increase in the educational level explains about half of the rise in the mean age at first birth among Dutch women born 1931–1940 and 1961–1965.
5.2 Female labor-force participation
The labor-force participation of women in the Netherlands has risen substantially, starting from the mid-1960s. Until then, there was a clear division of tasks among couples: Men were bread-winners and women were homemakers. Figure 22 shows the development of the labor-force participation of men and women aged 15–64 in the period 1960–2005. The increase in the educational level of women, emancipation, wider child-care facilities, and the rising number of part-time jobs all contributed to the growing numbers of women participating in the labor market. In 2005, half of all women aged 15–64 had a paid job compared to 75% of men.
working women with children, around a third had a paid job for 12 to 19 hours and around 50% did so for 20 to 34 hours a week in 2002 (Alders et al. 2003). Still, among 35% of 30-year-old women with children and their partners, the male was the breadwinner and the female the homemaker in 2000 (Garssen et al. 2001). The traditional gender roles differ by educational level: Among the lower educated women, participation is lower than among the higher educated women. This pattern is more pronounced after the birth of a first child.
Figure 22: Labor-force participation of men and women (age 15–64), the Netherlands, 1960–2005
0 10 20 30 40 50 60 70 80 90 100
1960 1965 1970 1975 1980 1985 1990 1995 2000 2005
L
a
b
o
r-fo
rc
e
p
a
rt
c
ip
a
ti
o
n
(
p
e
rc
e
n
t)
males
females
Source: Labour Force Survey
However, Keuzenkamp and Oudhof (2000) note that Dutch women, including those who have a paid job, still tend to take on most of the housework and child caring responsibilities, this despite the egalitarian gender role attitudes (Alders et al. 2003).
5.3 Business cycle and swings in period fertility
The TPFR shows short-term fluctuations that are affected by the business cycle. People become more optimistic in times of economic upturn. This is measured by an increase in the index of consumer confidence. When the index rises, the TPFR increases after a time lag of about two years. Similarly, a decline in consumer confidence is followed by a drop in the TPFR. The index explains 49% of the variance of the TPFR in the period 1975–2004.
Table 1: Flexible working hours and part-time jobs in several Western European countries
% of employees with flexible working hours
% of women having a part-time job
Austria 22 21
Belgium 26 21
Denmark 25 18
Finland 22 6
France 26 15
Germany 33 27
Greece 23 2
Ireland 19 17
Italy 19 11
Netherlands 36 45
Portugal 20 5
Spain 20 8
Sweden 32 20
United Kingdom 32 30
dropped more steeply than in times of rising confidence. The fertility of women aged 30 or over, however, climbed only slowly in periods of decreasing confidence and rose strongly in periods with a positive economic climate. This clearly shows that changes in the timing of fertility are affected by the business cycle: When people are pessimistic, they tend to postpone having children until they become more optimistic and then “catch up”.
Changes in the level of confidence affect first births as well as second-order births, but have less impact on higher-order births. Table 2 shows that in pessimistic periods, first and second-order births declined, whereas they rose in times of economic optimism. The extent of the effects is estimated on the basis of regression analysis. It turns out that a rising index of consumer confidence by 10 points is followed by an increase in the TFR by .04, half of which can be attributed to a rise in first birth and the other to an increase in second-order birth.
Table 2: TPFR and its relationship with the index of consumer confidence
TPFR TPFR by age TPFR by birth order
Index of consumer confidence (lagged 2 years)
effect of consumer confidence on TPFR
Below
30 years
30 years or over
1st
child
2nd
child
3rd or more
children
1975 1.66 1.19 0.47 0.71 0.65 0.31 114
1983 1.47 0.95 0.51 0.63 0.52 0.31 78
1990 1.62 0.84 0.77 0.72 0.56 0.34 103
1996 1.53 0.66 0.86 0.70 0.55 0.28 98
2003 1.75 0.72 1.03 0.83 0.63 0.29 115
changes 1975–
1983 –0.19 –0.24 0.04 –0.08 –0.13 0.00 –36 –0.08
1983–
1990 0.15 –0.11 0.26 0.09 0.04 0.03 25 0.09
1990–
1996 –0.09 –0.18 0.09 –0.02 –0.01 –0.06 –5 –0.03
1996–
2003 0.22 0.06 0.17 0.13 0.08 0.01 17 0.13
Source: Statistics Netherlands, own calculations.
smaller in the first two sub-periods than it is in the last two periods. In the last period, however, the relation between the amount of the change in the TPFR and that in the index seems to be different than in the other periods. For this reason, in the regression model the TPFR in the first two sub-periods is explained by the level of consumer confidence lagging one year, whereas in the last period, the lag is two years. The last column of Table 2 indicates that the changes in the index explain about half of the changes in the TPFR in the four sub-periods.
Figure 23: TPFR and regression model
1.4 1.5 1.6 1.7 1.8
1975 1979 1983 1987 1991 1995 1999 2003
N
u
m
b
e
r
o
f
c
h
ild
re
n
p
e
r
w
o
m
a
n
TPFR regression
Source: Statistics Netherlands, own calculations
5.4 The impact of immigration
Over the last three decades, the migrant population in the Netherlands more than doubled, i.e., from 1.3 million (9.2%) in 1972 to 3.1 million (19.2%) in 2005. Half of this group consisted of foreign-born migrants (first generation) and the other half was made up of children from these migrants, who were themselves born in the Netherlands (second generation). Around 1.5 million of the current migrants in the Netherlands are of non-western origin. Of these, roughly two-thirds are of Turkish, Moroccan, Surinamese or Antillean/Aruban descent. The first two groups started to arrive in the 1960s as labor immigrants to alleviate labor shortages in the booming Dutch economy. In the 1970s, a new immigration flow from these countries set in as the initial labor migrants reunified with their families in the Netherlands. Starting from the second half of the 1980s, family formation of new families became an important reason behind immigration from these countries. Also today, young people from Morocco and Turkey move to the Netherlands to marry migrants already living there. Most of the Surinamese migrants arrived in the Netherlands in the second half of the 1970s and the beginning of 1980, i.e., around the time when Suriname gained independence from the Netherlands. The Dutch Antilles and Aruba are still part of the kingdom of the Netherlands. As a result, no immigration restrictions apply. Migration from the Antilles to the Netherlands has traditionally taken place for educational reasons. More recently, limited employment opportunities in the Antilles prompted many young adults to leave for the Netherlands (Van Leusden 2001). Migrant births account for a substantial share of all births in the Netherlands; e.g., in 2004, about a quarter of all newborns had a mother with a migrant background.
Table 3: TPFR by country of birth of the mother, 1999, and number (absolute, x 1,000 and, in brackets, %) of women aged 15–29 and 30–49, by country of birth, 2005
TPFR, 1999 Total
15–29 30–49 15–49
Native Dutch 1.6 1089.6 (75.0) 1972.6 (79.5) 3062.2 (77.8) Western migrants 128.5 (8.8) 243.8 (9.8) 372.3 (9.5) Non-western
migrants
235.1 (16.2) 264.1 (10.6) 499.3 (12.7)
Suriname 1.7 42.5 (2.9) 62.4 (2.5) 104.9 (2.7) Turkey 2.5 50.0 (3.4) 52.7 (2.1) 102.6 (2.6) Morocco 3.3 47.1 (3.2) 38.7 (1.6) 85.8 (2.2) Antilles/Aruba 1.8 19.8 (1.4) 19.6 (0.8) 39.4 (1.0)
China 2.8 8.2 (0.6) 6.7 (0.3) 14.9 (0.4)
Iraq 3.4 4.5 (0.3) 6.0 (0.2) 10.6 (0.3)
Afghanistan 2.3 4.8 (0.3) 4.6 (0.2) 9.4 (0.2)
Iran 1.1 3.5 (0.2) 5.0 (0.2) 8.5 (0.2)
Somalia 4.4 2.9 (0.2) 2.8 (0.1) 5.6 (0.1)
Total 1453.3 2480.5 3933.8
of which: 1st generation 2nd generation
15–29 30–49 15–49 15–29 30–49 15–49 Native Dutch
Western migrants 55.5 114.5 170.0 73.0 129.3 202.3 Non-western migrants 130.6 246.7 377.3 104.5 17.4 121.9
Suriname 14.8 55.6 70.4 27.7 6.8 34.5
Turkey 22.5 50.0 72.5 27.4 2.7 30.2
Morocco 24.2 37.4 61.5 23.0 1.3 24.3
Antilles/Aruba 12.6 16.5 29.1 7.3 3.1 10.3
China 6.7 6.2 12.9 1.6 0.5 2.0
Iraq 4.4 6.0 10.4 0.1 0.0 0.2
Afghanistan 4.7 4.6 9.4 0.0 0.0 0.0
Iran 3.2 4.9 8.1 0.2 0.0 0.3
Somalia 2.8 2.8 5.6 0.0 0.0 0.0
Total 186.1 361.2 547.3 177.5 146.7 324.3
Figure 24 gives an overview of the changes in the TPFR of first generation migrant women from the four largest non-western countries and for the Dutch population as a whole over the 1980–2004 period. The figure shows that the TPFR of migrant women compared to the total population declined: While the TPFR of Dutch women rose slightly, the TPFR of non-western migrants decreased. The modest rise in the TPFR is the result of the fact that many Dutch women delayed childbearing in the 1985–1995 period.
The TPFR of Surinamese and Antillean/Aruban women in the Netherlands is around 1.75. Their TPFR hardly changes over time and is comparable to that among native Dutch women. Much higher TPFR levels are found among first generation Turkish and Moroccan women. Nevertheless, the TPFR among the two groups has clearly declined since the 1980s. In 1980, the TPFR among first generation Moroccan women was just over 7, whereas in recent years it has been around 3.3 children.
Figure 24: TPFR of first generation women by selected countries of birth
0 1 2 3 4 5 6 7 8
1980 1982 1984 1986 1988 1990 1992 1994 1996 1998 2000 2002 2004
N
u
m
b
e
r
o
f
c
h
ild
re
n
p
e
r
w
o
m
a
n
Turkey Morocco Surinam Antilles and Aruba Total Dutch population
One explanation for the higher TPFR of migrant women is that they start to have children at younger ages than Dutch women. To get deeper insights into changes in fertility behavior among the migrant population, the cohort fertility of the younger and older cohorts (restricted to the first generation by country of birth) is shown in Figure 25 (based on Garssen and Nicolaas 2006). The cohort fertility of the four largest migrant groups in the Netherlands is considered: Turks, Moroccans, Surinamese, and Antilleans/Arubans. Overall, Garssen and Nicolaas (2006) conclude that younger cohorts of women have children at a later age than do older cohorts. This conclusion holds for women born in the Netherlands as well as for those born in Turkey, Morocco, and Suriname. Antillean/Aruban women are the exception, as no clear shifts over cohorts are evident.
Figure 25: TCFR of first generation mothers by country of birth and age
The Netherlands 0.0 0.5 1.0 1.5 2.0 2.5
14 16 18 20 22 24 26 28 30 32 34 36 38 40 42 44 46 48 50 A ge N u m b e r o f c h ild re n p e r w o m a n 1945-1949 1955-1959 1965-1969 Turkey 0.0 0.5 1.0 1.5 2.0 2.5 3.0 3.5 4.0
Figure 25: (Continued) TCFR of first generation mothers by country of birth and age
Morocco 0.0 1.0 2.0 3.0 4.0 5.0 6.0
14 16 18 20 22 24 26 28 30 32 34 36 38 40 42 44 46 48 50 A ge N u m b e r o f c h ild re n p e r w o m a n 1945-1949 1955-1959 1965-1969 Suriname 0.0 0.5 1.0 1.5 2.0 2.5 3.0
14 16 18 20 22 24 26 28 30 32 34 36 38 40 42 44 46 48 50
Age N u m b e r o f c h ild re n p e r w o m a n 1945-1949 1955-1959 1965-1969
Antilles and Aruba
0.0 0.5 1.0 1.5 2.0 2.5
14 16 18 20 22 24 26 28 30 32 34 36 38 40 42 44 46 48 50 A ge N u m b e r o f c h ild re n p e r w o m a n cohort 1945-1949 cohort 1955-1959 cohort 1965-1969
Among all migrant groups and for all cohorts, the level of childlessness is higher among second generation migrant women. For example, whereas at age 25 (year of birth: 1975–1979) the majority of first generation Turkish and Moroccan women has had a child, the majority of second generation women from these groups is still childless at this age. This indicates that the timing of having children clearly differs between first and second generation migrant women.
So far, we have focused on fertility behavior among different migrant groups and Dutch women. In order to assess the impact of the migrant population on total Dutch fertility rates, we examined what would have been the TPFR from 1995 onwards if no immigration had taken place. Contrary to common expectations, our analyses reveal that women with a non-western background have only a limited influence on the TPFR in the Netherlands as a whole. They yield a positive contribution of 0.06 to 0.08. (Figure 26). This influence has remained unchanged in the period 1995–2004, this despite rising absolute numbers of non-western migrants. Redoing the analyses by excluding all migrant women (from both western and non-western origin) showed even less impact on the total TPFR in the Netherlands. The lower TPFR among western women compared to Dutch women is compensated by the (somewhat) higher fertility levels among non-western women. As a result, the effect of excluding all migrant women reduced the TPFR in 2004 only by 0.03 points.
Figure 26: TPFR for the total population, for the Dutch population (excluding non-western migrants), and for the EU 25, 1995–2004
0.0 0.2 0.4 0.6 0.8 1.0 1.2 1.4 1.6 1.8 2.0
1995 1996 1997 1998 1999 2000 2001 2002 2003 2004
N
u
m
b
e
r
o
f
c
h
ild
e
re
n
p
e
r
w
o
m
a
n
Netherlands
NL excl. non-western
EU 25
Source: Statistics Netherlands, Eurostat, own calculations
6. Family policies
6.1 The governmental view
The Dutch lack of concern about low fertility may partly be explained by the fact that the Dutch public and government were concerned about the prospect of overpopulation in the late 1960s and early 1970s (Coleman and Garssen 2003). In the 1960s, the Netherlands was one of the most densely populated countries in the world, and the population forecasts were alarming. The fear of overcrowding is possibly best expressed in the official statement of the Dutch Royal Commission on Population 1977 (Staatscommissie Bevolkingsvraagstuk 1977) that “termination of natural population growth is desirable”, noting the advantages of a more or less stationary population structure. The government agreed that “the perspective of growth coming to an end as a consequence of below-replacement fertility is welcomed” (Tweede Kamer der Staten Generaal, 1983). Recent and more muted official statements still maintain that “in the longer run a stationary population is viewed as desirable” (Government of the Netherlands 1999: 135). In addition, the Netherlands is probably the only European country where, for many subsequent years, a substantial part of the population (29– 37%) would like to see a declining number of inhabitants (Esveldt et al. 2001, Kontula and Miettinen 2005). Furthermore, while in many other European countries the majority of the population currently perceives the declining number of births as negative, only 21% of the Dutch population does so (Dorbritz et al. 2005: 6).
This does not mean, however, that the Netherlands has no specific policies aimed at families. Just like all other European countries, the Dutch government has implemented so-called family-friendly employment policies, i.e. policies that are aimed at enabling families to combine work and child care, providing subsidies to families with children and special financial measures to assist families with dependent children who are struggling financially. The primary aim of these policies, however, is not to increase fertility but to improve the well-being of families with children, to allow couples to combine family formation with work, and to keep the poorest ones from becoming socially excluded. The intended impact on fertility is secondary. Therefore, these policies fall under the area of social welfare policy rather than pronatalist policy.
Table 4: Current family policies in the Netherlands
Child allowance:
Basic principles –1946: 1946–2004:
–1995: 1995– :
1983–:
income related universal
related to the number of children unrelated to family size
related to the age of the child
Upper age limit 17
Discriminating age ranges 0–5, 6–11, 12–17 Min. level for first child in Euro
per month (and % of average gross earnings)
58.87 (2.1)
Maternity leave:
Duration 1990–: 16 weeks (female (un)employed persons)
Compensation 100%
Paternity leave:
Duration 2001–: 2 working days within the 4 weeks after the day of the birth
Compensation 100%
Parental leave:
Duration 1991–: 6 months
Compensation unpaid (some branches offer part of wage) Maximum age of child 1997–: 8 years
Rights
2001–:
part-time
equal right to mother and father right to take leave in 3 separate periods
Taxation:
Tax unit individual
Family based tax deductions tax deductions for children, child care costs Childcare:
% of children –4 yrs in day care 2004: 25 % of children 4+ yrs in after
school care
2004: 6
Hours per week children –4 yrs spent in day care
2004: 20
Hours per week children 4+ yrs spent in after school care
6.2 Child allowance
Until 1946, means-tested child allowance was provided in the Netherlands. Ever since, all families with children have been entitled to receive child allowance. The Population and Policy Acceptance Survey 2002 shows that the majority of the Dutch population is not content with the current system of income-unrelated child allowance, however: 43% prefers a scheme that varies with family income and 11% like to see that child allowances are only paid to low-income families (Fokkema and Esveldt 2006).
Children are not treated equally. Since 1983, the benefit level has been increasing with the child’s age. This is in line with the statistics showing that the costs of children have risen with the age of the child (Kontula and Miettinen 2005). Discriminating age limits are set at ages 6 and 12, and child allowance is paid up to the age of 17. Until 1995, in order to provide greater support to larger families than to one-child families, child allowance was also increased according to family size: the greater the family size, the higher the benefit level for each child. Consequently, from 1995 onwards, there have been two different child allowance schemes in operation in the Netherlands: Child benefit for children born before 1995 is paid according to the age and number of children; for children born since 1995, the amount of allowance depends solely on the age of the child. It seems that the Dutch government has succeeded in convincing the public of the benefits of the recent change in the allowance: the majority of the Dutch population prefers child allowance to rise with the age of the child, i.e., an allowance that is not dependent on the number of children (Fokkema and Esveldt 2006).
The minimum level for the first child is nearly 60 euro per month. Unlike many other Europeans, the majority of the Dutch are satisfied with the amount of child allowance they receive: 59% finds the level of allowances as reasonable versus 41% who state that the received level of benefit is too low (Fokkema and Esveldt 2006). The relatively high level of GDP and socio-economic welfare in the Netherlands possibly explains the positive assessment of the allowance level.
6.3 Parental leave
Around childbirth, women in the Netherlands have a legal entitlement to take 16 weeks of maternal leave. Most often, the period is split up into six weeks before and ten weeks after delivery. Thereafter parents are entitled to apply for parental leave. It is unpaid, although trade-union agreements may provide for some pay.
(61%) of the Dutch population (Fokkema and Esveldt 2006). The underlying motive for the Dutch government to implement parental leave on a part-time basis is to encourage part-time work rather than to encourage an interruption of mothers’ employment in order to reconcile the conflicting roles in- and outside the household. Parental leave can be taken until the child is 8 years old. Since the introduction of the Flexible Parental Leave policy, parents are legally entitled to take parental leave in three separate periods. These part- and flexible-time regulations correspond quite well with the preferences of the Dutch population: Whereas 42% are in favor of part-time leave and 38% support flexible-time leave, only 21% prefer full-time leave. Agreeing with the latter statement suggests that the attachment to the labor market outweighs the benefits of parents themselves looking after their children, which may be a less attractive option in periods of considerable uncertainties in terms of employment/unemployment and government support for families, even more so (or especially) when there are young children (Gauthier 1998). Finally, in line with the EC Directive on parental leave, entitlement to parental leave constitutes a social right for both mothers and fathers. In addition, mothers and fathers have the same number of months in terms of parental-leave entitlements and they can share the leave as they wish.
6.4 Childcare
For a long time, childcare in the Netherlands was perceived to be mainly an individual responsibility. Only since the early 1990s has public provision of childcare become more common. From then onwards, the policies on childcare have aimed at sharing responsibility between the government, employers, and employees (parents) (Den Dulk 2001). In 2005, a new childcare act introduced shared and equal responsibility between the government, employers, and employees to pay for the cost of childcare. The government’s financial contribution depends on the parental income. Ideally, the employer would contribute towards the childcare costs of both male and female employees; however, employers were not obliged to do so. Since 2007, the government has been paying a third of the actual childcare costs and an income-dependent share of the costs.
Although the opinion of the Dutch on labor-force participation is becoming increasingly positive, still 30% of the population believes it to be problematic when a woman leaves her child to childcare in order to have a paid job (Gilsing 2007, Portegijs et al. 2006).
6.5 Preferred family policy measures and their expected impact on reproductive behavior
Which family policy measures do Dutch people prefer to be implemented or improved by the government? The Population and Policy Acceptance Survey 2002 shows that parents give priority to other family policy measures than childless people do (Fokkema and Esveldt 2006). Knowing how expensive children are, Dutch parents accord the highest priority to measures aimed at reducing the financial burden of childbearing and child rearing. This is expressed in their choices of available survey answers: “A substantial rise in child allowance”, “Decreasing the costs of education”, and “Lower income tax for people with dependent children”. Childless people, by contrast, attach the greatest importance to leave and work arrangements in order to reconcile work with family duties (“Flexible working hours for working parents with young children” and “More and better opportunities for parents with young children to work part-time”) and to child-care facilities for children under the age of 4.
No more than 17% of parents and 14% of childless people in the Netherlands who do not want to have a(nother) child say that they would reconsider the possibility of having a(nother) child if the policy measures preferred were introduced or improved by the Dutch government. The percentages who state that they would probably decide to have an additional child are even lower: 13% and 10%, respectively. Consequently, if all of the expressed intentions were put into practice, the total policy effect would range from 8 (probably to decide to have a(nother) child) to 13 (reconsider having a(nother) child) children per 100 women. Given the low percentages, we may conclude that the Dutch do not expect much of the fertility-enhancing effects of governmental family policy measures. This may (partly) be explained by the fact that the Dutch consider fertility decisions their private domain and that they do not like a government that interferes with their fertility decisions (Esveldt et al. 2001).
7. Summary and concluding remarks
Europe. While especially Southern and Central Eastern Europe is faced with a persistent and pronounced drop in the TPFR to a current level well below 1.5, the decline of the Dutch TPFR came to a halt and has even slightly risen since 1995. Consequently, the Netherlands now has one of the highest fertility rates in Europe: 1.73 children per woman. The business cycle, changes in the Dutch population structure due to immigration, and postponement of child bearing are some of the factors that have affected the development of the TPFR. It is likely that the Dutch TPFR will rise rather than decrease in the near future, given the recent economic upturn, increasing numbers of second generation migrant women at childbearing ages, comparatively high fertility rates, and the fact that the decline in fertility rates at younger ages has come to an end.
Dutch women have one of the highest ages at first childbirth in the world: 28.9 years in 2004. This is not so much due to low fertility rates at young ages. Rather it is the result of the relatively high fertility rates of women in their 30s. In addition, the Netherlands has one of the most liberal attitudes towards abortion, contraception, and sexuality worldwide. Access to abortion has never been severely restricted, there is a widespread availability of reliable contraceptives, and the intercourse rate at young ages is relatively high. However, since reliable methods of birth control are used widely, the Netherlands has one of the lowest abortion and teenage pregnancy rates in the Western world. Therefore, childbearing in the Netherlands has increasingly become more salient among women in their late 20s and early 30s.
The Dutch government has never taken pronatalist steps but it has implemented family policies, as did other European countries. Besides financial support to families, the measures are especially oriented towards enabling couples to combine family formation with a paid job. The emphasis, however, is on women’s employment rather than on stimulating fertility. The expansion of part-time and flexible jobs and the improvement of child care regulations have encouraged women to participate in the labor market, a mode that perfectly fits the “Poldermodel Society”. Considering the relatively high level of fertility and the substantial rise in women’s labor-force participation, the so-called family-friendly employment policy seems to have had its desired effect.