IDENTIFYING POTENTIAL AREAS FOR FUTURE URBAN
DEVELOPMENT USING GIS-BASED MULTI CRITERIA
EVALUATION TECHNIQUE
Khalid Sabbar Mohammed1, Yasin Abdalla Eltayeb Elhadary2 & Narimah Samat3 1Geography Section- School of Education for Humanities studies
University of Al-Anbar -Iraq
2Faculty of Geographical and Environmental Science, Universityof Khartoum,Sudan 3
Geography Section, School of Humanities,Universiti Sains Malaysia
E-mail: [email protected]
ABSTRACT
Malaysia likes other Asian countries has experienced rapid urbanization due to economic development, industrialization, massive migrations as well as natural population growth. This expansion particularly the unplanned has impacted negatively on farming activities and creates huge pressure arable agriculture areas. Thus, identification of potential sites for future urban development should become important issues in ensuring sustainable development. Therefore, the aim of this paper is to use GIS based multi criteria evaluation technique to identify potential areas for urban development at Balik Pulau, Penang. The study quantified spatial and temporal dynamics of land use/cover changes and identified potential areas for future development. The results indicated that large proportions of agriculture areas had been converted to built-up areas.. Urban areas increased from 1793.2 ha in 1992 to 3235.4 ha in 2002 and became 3987.8 ha in 2010. On the other hand agricultural land decreased from 6171.3ha (53.8%) in 1992 to 3883 ha (35. %) in 2010. The study, then, produced map showing potential sites for future urban development. The findings also indicated built-up areas would continue to encroach into flat available agricultural land which will be diminished if no restriction imposed. Thus, the information obtained from this study is useful for planners and decision makers in controlling agriculture areas and guiding new development properly.
Keywords: GIS-MCE, Remote Sensing, land use land cover changes, Penang Island. DOI: 10.1051/
C
Owned by the authors, published by EDP Sciences, 201 /2 01
shsconf
0 00 (201 ) SHS Web of Conferences
INTRODUCTION
Currently, both developed and developing countries have experienced unprecedented expansion of urbanization due to economic development, industrialization, massive migrations as well as natural population growth (Sabbar, et al. 2015). This expansion comes usually at the expense of agricultural land and led in some countries to the condition of food insecurity. According to Elhadary et al., (2013) urbanization and its impact on agriculture worldwide have received considerable attention by planners, researchers, and policymakers. Urbanization has caused significant losses of agricultural and natural lands, areas that are relevant to maintaining both social systems and cultural diversity along with natural systems and biodiversity (Hepinstall et al., 2008). The unplanned and uncontrolled rapid growth has resulted in serious negative effects on the suburban dwellers and their environment (Chadchan and Shankar, 2012). Therefore much attention has been paid to address the issue of urbanization and its negative implication on socio-economic and environment. Sustainable development should be practiced by both developed and developing countries (Raddad et al., 2010) such that urban development would give large consideration to coservation issues such as landscape fragmentation and environmental degredation (Fekade, 2000). Malaysia like other Asian countries has experienced rapid expansion of urban areas (Sabbar, et al. 2015) due among other factors to the shift of economy from a mainly agriculture to an industry based economy in early seventies (Samat, 2010). Urbanization is not a problem of its own but, when drastic increase of urban population occurs especially in the countries that lack resources and personnel to deal with it. In Malaysia, for example, urban population has reached > 72% and is expected to become 75% by 2020 (Elhadary and Samat, 2015). In this situation securing sustainable residential areas for urban dwellers is considered as a hard task for urban planners. The residential developments required to focus on the affordability of the residents to live and work with accessibility, infrastructural facilities, environmental quality, financial ability etc. This idea supported by Chen (2014) who stated that land use suitability assessment is a key factor in any urban and suburban planning and decision-making processes. Thus, in dealing with planning decision making, modern techniques are powerful to guide the planners and policy makers for identifying sustainable and affordable urban areas for future development.
BACKGROUND OF THE STUDY
Several articles have been published in addressing urban land suitability using Multi Criteria Evaluation (MCE) integrated in Geographical information System environment. Currently, Chen (2014) uses such technique in generating land use suitability of city Regina in Canada. Also Santosh Kumar and Ritesh Kumar (2014) illustrates the use of GIS tools and numerical MCE techniques to identify suitable sites for urban development of a hill town, Nahan in India. In that study, six criteria namely evaluation of slope, road proximity, land use, land values, soil and geomorphology factors were used. Similarly, Liu et al (2007) used comprehensive method of GIS and MCE to analyze the suitability of future land use according to specified requirements, preferences and predictions in Hanyang lake area located in Wuhan city. Dai et al. (2001) conducted a study of the urban land use planning based on GIS and multi-criteria analysis method, which was applied in Lanzhou city, and its vicinity in north-western China. In Malaysia Zubaidah (2010) also used GIS and multi criteria evaluation for identification of suitable urban school sites in Malaysia. In her study decision makers’ evaluation and community opinions have been used for developing a set of school siting criteria and school planning data model which were used to design a number of potential sites by using the spatial analysis model.
to populated areas, proximity to developed areas, existing from land value, and proximity to road networks. The article used Remote sensing RS and GIS based multi criteria evaluation technique to understand the nature of the current urbanization and identify potential areas for near future urban development in Balik Pulau town-Penang State. The paper tries to answer the following questions. What are the major criteria used for identifying the suitable location for
residential development in Balik Pulau sub urban area? Which areas are most likely to be
developed in the near future in Balik Pulau town?
THE STUDY AREA
Figure1. Location of study area: Southwest of Penang Island
MATERIALS AND GENERAL PROCEDURES OF DATA PROCESSING
Table 1: Data obtained from satellite imaages
Data Availability year Source Existing Format
Landsat 7 Satellite image at 30 m resolution 01-04-2002 USGS 7 bands soft copy
Landsat 5 Satellite image at 30 m resolution 24-06-1992 USGS 7 bands soft copy
THEOS1Scene level 2A Satellite image at 15 m resolution
29-01-2010 USGS 4 bands soft copy
Data Analysis
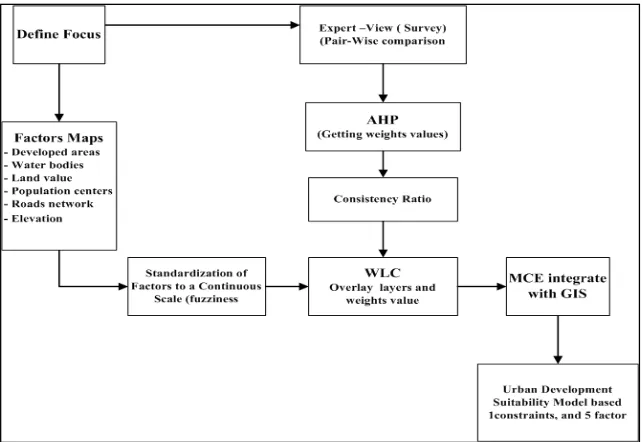
Two major analysis namely the change detection analysis and suitability analysis were performed (Figure 2). Change detection analysis was used to calculate the statistics and rate of changes of land use/land cover change from 1992 to 2010 based on Equation 1 and 2 below. (Ma and Xu 2009)
Spatial Data Satellite Images
Criterion Maps Classification
1992-2002-2010
Change Detection MCE Model
GIS and Statistical analysis
Recommendations and Conclusion
Figure 2: Methodology used in this study.
1 1
, , , , , ,
t t t t
i j r i j r i j r
LUi j rt, ,, LUi j r, ,, , LUi j rt, ,,
LUi j rt t LUi j ri j rt LU
1 1
t 1 t 1
LU LU
t 1 tt 1
……… (1)
Where,
1 , , t t i j r
LUt i j r, ,
LUi 1 t
= changes of land use type rat location iand jfrom tto t + 1,
1 , , t i j r
LU 1
, , t i j r
L = land use type rat location iand jat time t.
1 100%
Ua Ub LUDI
Ua T
1
Ub
100%
Ua
U T
1
Ub
……….. (2)
Where,
LUDI= the annual rate of change in area for land use classes.
Ua = certain land use class at time a
Ub = certain land use class at time b and.
T = denotes the length of time from time a and time b, when T is in a unit of year,
[image:8.482.80.401.377.598.2]The second analysis is intended to identify suitable areas for urban development which are likely to experience urban development pressure. GIS and MCE were used to perform this analysis. Data was prepared in ArcGIS 9.3 and transferred to IDRISI Kilimanjaro to perform the analysis. This software is used since it is simple and has integrated MCE module within GIS system, which is useful and easy to be operated especially for non-technical users (Samat, 2002). The procedure used in performing MCE analysis is shown in Figure 3 below.
MCE approach involves five steps namely define the objectives, identify the criteria, determine weights of the factors, map the criteria, and combine all the criteria and weights using MCE algorithm.
IDENTIFYING THE CRITERIA AND WEIGHTS
Based on the objective given above, criteria or factors influencing urban development were identified. The selection of factors for an MCE analysis was undertaken based on existing literature, defined by an analyst, or group of experts (López-Marrero and Yarnal, 2010). In this study, group of experts or stakeholders who have knowledge of the study area were interviewed. Criteria influencing urban development were divided into local and global
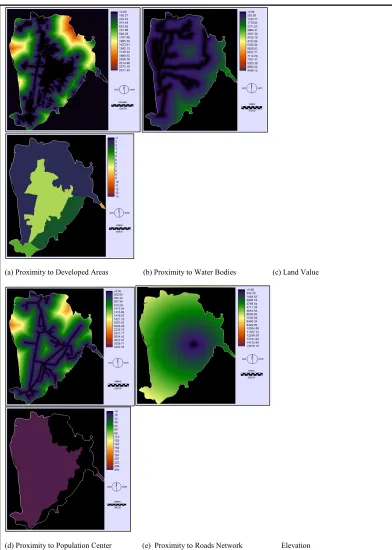
factors and constraints. Although numerous factors influence urban growth and development such as accessibilities to public facilities, , land use types, socioeconomic conditions and demographic factors, management related factors, hydrological factors and soil related factors (Verburg and Chen, 2000; Chen et al., 2001; Shariff et al., 2010; Biotto et al., 2009) this study only used five factors namely proximity to water bodies, proximity to population centres, proximity to developed areas, existing from land value, and proximity to road networks. Based on these five criteria, their weights were determined using pair-wise comparison approach.Weight can be defined using the basic eigenvectors of a square reciprocal matrix of pairwise comparisons between the criteria (Malczewski, 2004). These comparisons were based on relative importance of two criteria used to determine the suitability of a defined objective. In this study, a pair of criteria were valued at the same time using the scale of nine points (degrees) ranging from1/9 to 9 as shown in Table 2. The weights were derived based on the questionnaire, where urban planners and managers (experts) of related government departments in Penang state were interviewed. Based on the interviews undertaken, weights were derived for each criterion as shown in Table 3 below.
Table 2: Continuous Rating Scale Used For the Pair Wise Comparison of Factors in the Multi-Criteria Evaluation
1/9 1/7 1/5 1/3 1 3 5 7 9
extremely Very Strongly Moderately Equally
important
Moderately Strongly Very extremely
Less important More important
[image:9.482.47.434.547.607.2]Source: Saaty (1977)
Criteria Weights
Proximity to population centres 0.28
Proximity to roads network 0.40
Land value 0.14
Proximity to developed areas 0.04
Proximity to water bodies 0.23
Consistency Ratio 0.08
Based on the weights obtained, weighted linear combination approach (WLC) was used to combine all criteria and obtain suitability map.
RESULTS AND DISCUSSIONS
The Dynamic of Land Use Land Cover Changes in Balik Pulau from 1992 to 2010
This study investigated urban expansion trends from 1992 and 2010 in Balik Pulau where statistics of urban expansion of urban area and speed of urban land change were measured. Penang had experienced rapid urbanization which has led to fundamental land use change during the last 40 years.
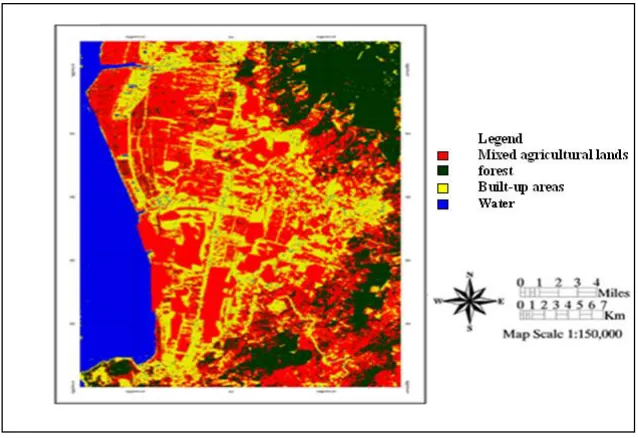
[image:10.482.49.436.538.640.2]The land use conversion matrix in table 4 shows that the area underwent changes during the period 1992, 2002 and 2010.In 1992 agricultural lands was approximately 6171.32ha or 53.79%of the total land in the study area, but this area decreased to 4727.83ha or 42.08%, in 2002. Similarly, Tan et al. (2010) also found drastic decrease of agricultural land in Penang Island from 1999 to 2007 but built-up areas had increased from 31.23km2 to 65.28 km2 or 109.03% over the 8-year period . In this study, the agricultural land decreased from 4727.83 ha in 2002 to 3883.0 ha in 2010Statistics obtained indicated that the change within 18 years was mainly reduction of agricultural lands, which decreased by the ratio 37% or 2288.0ha. Also, urban uses increased by the ratio of 123.7% with 2193ha (as shown in Tables 8 and 9).
Table 4: Agricultural lands and built-up areas in Balik Pulau 1992, 2002 and 2010.
Class
1992 2002
2010 Total percentage
of changes among 18 years
ha % ha % ha % ha %
Agricultural lands
6171.3 53.8 4727.83 42.1 3883 35.8 - 2288 37.0
In contrast, built-up areas had increased significantly from 1793.2 ha in 1992, which constituted 15.6% of the total of study area to approximately 3235.4ha in 2002; so the proportion of urban uses had increased by the ratio of 28.2 % (as shown in Table 4), an increase of 1442.2 ha during this 10 years with an annual rate of 144.21 ha (Figure 4). This is equal to the rate of annual loss of agricultural lands. It could be concluded that 98% of urban expansion in the study area occurred at the expense of agricultural lands.
Figure 5: Land Cover Classification of Balik Pulau–2010 Identifying Potential Sites for Urban Development
The findings in the previous section indicated that the study area has experienced drastic increase on built-up areas at the expense of agriculture land. Although agriculture activities may contribute small portion (less than 10 %) of state’s GDP, this area should be
(a) Proximity to Developed Areas (b) Proximity to Water Bodies (c) Land Value
[image:13.482.43.435.58.608.2](d) Proximity to Population Center (e) Proximity to Roads Network Elevation
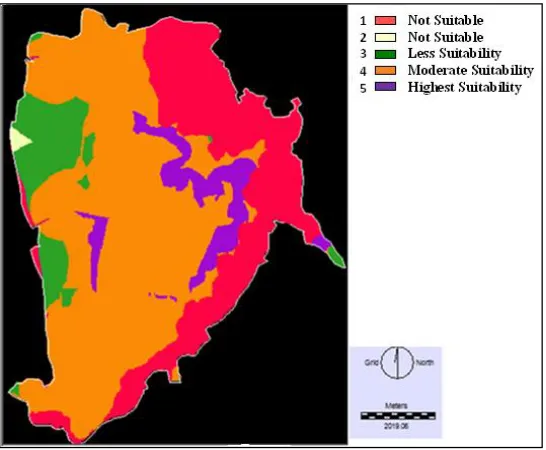
Based on GIS-MCE analysis this study identified potential sites for future development in Balik Pulau. The analysis produced a map of several classes: low, moderate, or high suitability for urban development. The final suitability map constructed by a linear combination approach represented areas characterized by different potentials for urban development assigned that values between 1 and 5. A color-coded example of the resulted map is shown in Figure 8. Based on the analysis areas located nearby hills with low elevation ranged from 5 to 20 degree and a little bit far from far agricultural land is considered as a most suitable sites for future urban development. Most of the low lands (flat area) were considered as unsuitable areas for urban development to preserve agricultural lands. The resulted suitability map provided clear information for urban planners and managers to identify new urban sites in Balik Pulau. By so doing planners ensure that this new sites have less negative impact on rural community and agricultural lands. The ‘highest suitable’ category on the other hand, signifies areas with high extent of urbanization, in other words, they are low sensitive areas. Activities to be allowed for urban activities included industrial, commercial, housing and tourism. The study found that moderately suitable sites were actually located around existing Balik Pulau. Less suitable sites category is assigned to the areas that depict the less suitable urban development. This area will therefore be less likely to be developed for future urban development.
[image:14.482.119.392.376.601.2]The result of the suitability analysis provided important information to determine potential areas for development which preserved agricultural lands in study area. In addition, urban development sites shall not be placed near agricultural lands to avoid the negative effects of urban phenomenon on the farmers and crops.
The study provides simple land use land cover changes to investigate the impact of built-up areas expansion on agricultural land. Furthermore, GIS-MCE analysis was undertaken to show potential areas for development is quite small and urgently require close monitoring and planning. It should be noted that this study was undertaken to visualize affect areas based on five criteria and one constraint. Further analysis may be undertaken to predict the dynamic of land use land cover changes using urban spatio-temporal model.
CONCLUSION
Generally, Balik Pulau has experienced significant changes in size, speed and patterns of urban expansion. This expansion is at the expanse of agricultural lands which experienced significant reduction since 1992 to 2010. Furthermore, based on the GIS-MCE analysis, the paper comes out urbanization is expanded very rapidly in Balik Pulau and several potential sites are underway to be developed in the near future. Therefore, it is important to continuously investigated and monitored urban expansion in Balik Pulau. Furthermore, it would be useful to identify areas likely to experience development pressure, in order to help planners in planning these suburban areas. Having both visual and quantity result led the integration of GIS-MCE to be a very useful and powerful technique in guiding urban planners and decision for implementing sustainable urban land use. Moreover the tool has its ability to include the ideas of public communities thus both methods bottom up and top down approaches are implemented in planning. In addition the technique is very simple and flexible and can be fit in various applications related to urban issues. Despite this still the application of this technique is urbanization is very rare particularly in the third countries.
ACKNOWLEDGMENT
REFERENCES
Abdul Rahman, S, B. (2000), population and housing census of Malaysia ,population distribution by local author areas and mukims,pp1-367.
Agus, M. R., Doling, J., & Lee, D. S. (2002). Housing policy systems in south and east Asia: Palgrave Macmillan New York.
Biotto, G., Silvestri, S., Gobbo, L., Furlan, E., Valenti, S., & Rosselli, R. (2009). GIS, multi-criteria and multi-factor spatial analysis for the probability assessment of the existence of illegal landfills. International Journal of Geographical Information Science, 23(10), 1233-1244.
Bukhari, Zubaidah (2010) Integration of Geographical Information System and Multi Criteria Evaluation for Identification of Suitable Urban School Sites. Masters thesis, Universiti Putra Malaysia.
Carver, S. (1996). Wilderness Britain: Using GIS and multi-criteria evaluation techniques to map the wilderness continuum: School of Geography, University of Leeds.
Chadchan, J., Shankar, R. (2012) An analysis of urban growth trends in the post-economic reforms period in India, International Journal of Sustainable Built Environment, 1, 36–49.
Chan, N. W. (2010). Impacts of human habitat development on the environment–challenges and the way forward. Malaysian Journal of Environmental Management, 11(2), 3-20. Chen, K., Blong, R., & Jacobson, C. (2001). MCE-RISK: integrating multicriteria evaluation and GIS for risk decision-making in natural hazards. Environmental Modelling & Software, 16(4), 387-397.
Chen, J. (2014). GIS-based multi-criteria analysis for land use suitability assessment in City of Regina. Environmental Systems Research 2014, 3:13.
Chuvieco, E. (1993). Integration of linear programming and GIS for land-use modelling.
International Journal of Geographical Information Science, 7(1), 71-83.
Cromley, R. G., & Huffman, F. T. (2006). Modeling situation factors used in MCE procedures for raster GIS. Transactions in GIS, 10(2), 239-251.
Elhadary, Y., & Saman, N. (2015) Integrating Geographic Information System and Discriminant Analysis in Modelling Urban Spatial Growth: An Example from Seberang Perai Region, Penang State, Malaysia. Asian Social Science; Vol. 11, No. 2; 2015.
Elhadary, Y., Narimah S & Franklin Obeng-Odoom (2013) Development at the Peri-Urban Area and Its Impact on Agricultural Activities: An Example from the Seberang Perai Region, Penang State, Malaysia, Agroecology and Sustainable Food Systems, 37:7, 834-856
Fischer, M. M., & Nijkamp, P. (1993). Geographic information systems, spatial modelling and policy evaluation, in Geographic information systems, spatial modelling and
policy evaluation.(1st ed.).
Fekade, W. (2000). Deficits of formal urban land management and informal responses under rapid urban growth, an international perspective. Habitat International, 24(2), 127-150.
Hepinstall, J. A., Alberti, M., & Marzluff, J. M. (2008). Predicting land cover change and avian community responses in rapidly urbanizing environments. Landscape ecology, 23(10), 1257-1276.
Jankowski, P. (1995). Integrating geographical information systems and multiple criteria decision-making methods. International Journal of Geographical Information Systems, 9(3), 251-273.
Jat, M. K., Garg, P., & Khare, D. (2008). Monitoring and modelling of urban sprawl using remote sensing and GIS techniques. International Journal of Applied Earth Observation and Geoinformation, 10(1), 26-43.
Jiang, H., & Eastman, J. R. (2000). Application of fuzzy measures in multi-criteria evaluation in GIS. International Journal of Geographical Information Science, 14(2), 173-184. Lambin, E. F., Geist, H. J., & Lepers, E. (2003). Dynamics of land-use and land-cover change
in tropical regions. Annual review of environment and resources, 28(1), 205-241. LaGro, J. A., & DeGloria, S. D. (1992). Land use dynamics within an urbanizing
non-metropolitan county in New York State (USA). Landscape ecology, 7(4), 275-289. López-Marrero, T., & Yarnal, B. (2010). Putting adaptive capacity into the context of
people’s lives: a case study of two flood-prone communities in Puerto Rico. Natural
Ma, Y., & Xu, R. (2010). Remote sensing monitoring and driving force analysis of urban expansion in Guangzhou City, China. Habitat International, 34(2), 228-235.
Malczewski, J. (2004). GIS-based land-use suitability analysis: a critical overview. Progress in Planning, 62(1), 3-65.
Malczewski, J. (2002). Fuzzy screening for land suitability analysis. Geographical and Environmental Modelling, 6(1), 27-39.
Malczewski, J. (1999). GIS and multicriteria decision analysis, Canada, John Wiley&Sons. Malczewski, J. (1996). A GIS-based approach to multiple criteria group decision-making.
International Journal of Geographical Information Systems, 10(8), 955-971.
Moeinaddini, M., Khorasani, N., Danehkar, A., & Darvishsefat, A. A. (2010). Siting MSW landfill using weighted linear combination and analytical hierarchy process (AHP) methodology in GIS environment (case study: Karaj). Waste Management, 30(5), 912-920.
Openshaw, S. (1996). Developing GIS-relevant zone-based spatial analysis methods. Spatial analysis: modelling in a GIS environment, 55-73.
Pourebrahim, S., Hadipour, M., & Bin Mokhtar, M. (2011). Integration of spatial suitability analysis for land use planning in coastal areas; case of Kuala Langat District, Selangor, Malaysia. Landscape and Urban Planning, 101(1), 84-97.
Raddad, S., Salleh, A., Samat, N . (2010). Determinants of agricultural land use change in Palestinian urban environment :Urban planners at local governments perspective, American – Eurasian Journal of sustainable agricultural, 4, 30-38.
Rainis R, Ismail W, Shariff N. Estimating sediment yield of a small catchment in a tropical region using the AGNPS model: the Waterfall River catchment, Penang, Malaysia.
Journal of Environmental Hydrology. 2002;10:1-10.
Reshmidevi, T., Eldho, T., & Jana, R. (2009). A GIS-integrated fuzzy rule-based inference system for land suitability evaluation in agricultural watersheds. Agricultural Systems,
101(1-2), 101-109.
Saaty, T. L. (1987). Rank generation, preservation, and reversal in the analytic hierarchy decision process. Decision sciences, 18(2), 157-177.
Samat, N. (2010). Assessing land use land cover changes in Langkawi island: towards sustainable urban living. Malaysian Journal of Environmental Management, 11(1), 48-57.
Samat, N. (2006). Characterizing the scale sensitivity of the cellular automata simulated urban growth: A case study of the seberang perai region, Penang State, Malaysia.
Computers, Environment and Urban Systems, 30(6), 905-920.
Samat, N. (2002). A geographic information system and cellular automata spatial model of urban development for Penang State, Malaysia. Phd.Thesis. University of Leeds. Sabbar, K. Elhadary, Y. and Samat, N. (2015) GIS and Remote Sensing Techniques for
measuring agriculture land loss in Balik Pulau Region of Penang State, Malaysia.
Journal of Agriculture and Rural Development, 5(2)2015: 30-41
Shariff, N., Gairola, S., & Talib, A. (2010). Modelling urban land use change using Geographically Weighted Regression and the implications for sustainable
environmental planning.
Umrikar, B. (2013) Multi Criteria approach for analysis of Land Suitability for Urban Expansion. The Journal of Geography and Geology. Photon 117 (2013) 170-176. Verburg, P. H., & Chen, Y. Q. (2000). Multiscale characterization of land-use patterns in
China. Ecosystems, 3(4), 369-385.
Voogd, H. (1983). Multicriteria evaluation for urban and regional planning: Pion London. Weerakoon, K. (2014). Suitability Analysis for Urban Agriculture Using GIS and
Multi-Criteria Evaluation. International Journal of Agricultural Science and Technology (IJAST) Volume 2 Issue 2, May 2014
Xu, H., Wang, X., & Xiao, G. (2000). A remote sensing and GIS integrated study on urbanization with its impact on arable lands: Fuqing City, Fujian Province, China.