International Journal of Innovative Technology and Exploring Engineering (IJITEE) ISSN: 2278-3075, Volume-8 Issue-7, May, 2019
Abstract: The engineering and construction industry has faced many challenge for consuming, “Sustainable green and recycled products” in manufacture of concrete. Coal Bottom Ash (CBA) has the potential to be used as concrete materials in place of fine aggregate. Bottom ash is the dominant solid residue generated in power stations. In this study, experimental investigation has been conducted to assess the performance of bottom ash as fine aggregate with various percentages (20 %, 40 %, 60 % & 100 %) in cement concrete subjected to chemical curing. The concrete specimens were casted and tested for compressive strength and tensile strength at 7, 28 and 90 days. The functional properties like Sorptivity, Water Permeability, Rapid Chloride Penetration, Sulphate and Acid Resistance were tested on 28, 56 and 90 days old specimens. It is observed that bottom ash replacement up to 40 % as fine aggregate in cement concrete is durable.
Keywords: Coal Bottom Ash, Cement Concrete, engineering properties, durability studies.
I. INTRODUCTION
Concrete is the important construction material used in the construction industry cement, coarse aggregate and river sand are its main constituent materials. Due to scarcity of nature sand and its abnormal price hike, the construction industry is forced to replace it with M sand. Coal fired thermal power plants in the country have been accumulating tremendous volumes of coal bottom ash for decades and bottom ash is one of the dominant solid residues generated in municipal solid waste incinerators and waste to energy plants. In India, coal fired thermal power plants are the main source of power generation and about 70% electricity requirements are fulfilled by them. Deposits of coal bottom ash are becoming an environmental menace to the surrounding community[1].
The coal ash collected at bottom of furnace is called bottom ash. Bottom ash particles are physically coarse, porous, glassy, granular and grayish in color [2]. Bottom ash forms up to 25% of the total ash while fly ash forms the remaining 75%. The replacement of quartz sand by bottom ash with high reactive silica had a positive effect on the forming of tober-morite [3]. In fresh state bottom ash incorporated concrete leads to bleeding and leads to water loss [4,5] and the higher the percentage of bottom ash used as a natural sand replacement the lower the deformation through plastic shrinkage. These results afftecs the strength
Revised Manuscript Received on May 10 ,2019
Jawahar. S, M.Tech (Structural Engineering).,VIT Chennai , India
Magesh.M, M.Tech (Structural Engineering).,VIT Chennai , India
Jagen.V, Chief Structural Enginner, Ramaniyam Real Estate PVT.LTD.,Chennai.
Dr.Vasugi V, Associate Professor, School of Mechanical and Building Sciences, VIT Chennai , India.
and setting time of concrete, these observations are considered.
The engineering and construction industry have successfully engaged in a challenge for consuming, “Sustainable, green and recycled products” in manufacture of concrete. Bottom ash has potential to be used as concrete material in place of fine aggregates. In this study, experimental investigation has been conducted to assess the performance of bottom ash as fine aggregate with various percentages (20 %, 40 %, 60 % & 100 %) in cement concrete subjected to chemical curing. The concrete specimens were casted and tested for compressive strength and tensile strength at 7, 28 and 90 days. The functional properties like Sorptivity, Water Permeability, Rapid Chloride Penetration, Sulphate and Acid Resistance were tested on 28, 56 and 90 days old specimens.
II. MATERIALS A. Materials Used
Cement: Portland cement is the common type of cement used. In this, Ordinary Portland cement is used for concrete.
Aggregates: Aggregates provide strength and durability to the concrete. Bottom ash and M sand is used as the fine aggregate. The specific gravity of Bottom ash is 1.7 and M sand is 2.56.Coarse aggregates of 20mm size were used and the specific gravity was 2.74.
Lignite bottom ash was collected from NEYVELI
LIGNITE CORPORAION LIMITED (NLC)
approximately 500 kg in ash handling department in new thermal power plant
Water: By the process of hydration, cementious material reacts with water and form a paste. This cement paste fills the voids and makes the aggregate together. Low water cement ratio makes a durable, strong concrete. High water cement ratio makes high slump concrete.
Chemical Accelerators: Chemical accelerators help in reducing the setting time and increasing the early age strength. The chemical accelerators used in this study are calcium nitrate and Triethanolamine.
Super plasticizer: To achieve the workability for concrete, superplasticizers are used. In this, polycarboxylic ether is used.
Performance Evaluation of Concrete Using
Bottom Ash as Fine Aggregate
Table 1. Properties of bottom ash
Physical Properties of BA
S.no Property Value
1 Specific
gravity
1.7
2 Water
absorption
by mass
(%)
30.2
3 Fineness
modulus
1.37
4 Percentage of
Air Voids (%)
60
B. Mixture Proportions
The mix proportioning for M30 grade concrete has been done
as per IS10262. River sand replaced by Bottom ash as fine
aggregates and the water absorption taken care in the
calculation. As a result of various trial mixes, the ratio of
ingredients obtained as 1: 1.8: 3.2. The fresh concrete test
was taken before casting. Slump Test done to ensure the
concrete workability and consistency. Table 2 gives the value
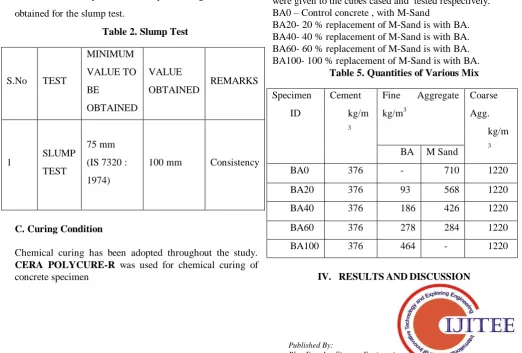
[image:2.595.314.564.236.413.2]obtained for the slump test.
Table 2. Slump Test
S.No TEST
MINIMUM
VALUE TO
BE
OBTAINED
VALUE
OBTAINED REMARKS
1 SLUMP
TEST
75 mm
(IS 7320 :
1974)
100 mm Consistency
C. Curing Condition
Chemical curing has been adopted throughout the study.
CERA POLYCURE-R was used for chemical curing of concrete specimen
Table 3. Quantities of Conventional Concrete
S.NO MATERIALS QUANTITY
1 Cement content 376 kg/m3
2 Fine Aggregates 710 kg/m3
3 Coarse Aggregates 1220 kg/m3
4 Water cement
ratio
0.55
Table 4. Replacement Porportions of bottom ash and M-Sand
Percentage 0%
BA
20%
BA
40%
BA
60%
BA
100%
BA
M SAND
(kg/m3)
710 568 426 284
-BOTTOM
ASH
(kg/m3)
- 93 186 278 464
III. EXPERIMENTALPLAN
The cubes had been casted for Mechanical and Functional properties of concrete and tested. The physical properties of the Bottom Ash are studied and Specimen ID were given to the cubes cased and tested respectively. BA0 – Control concrete , with M-Sand
BA20- 20 % replacement of M-Sand is with BA. BA40- 40 % replacement of M-Sand is with BA. BA60- 60 % replacement of M-Sand is with BA. BA100- 100 % replacement of M-Sand is with BA.
Table 5. Quantities of Various Mix
Specimen
ID
Cement
kg/m
3
Fine Aggregate
kg/m3
Coarse
Agg.
kg/m
3
BA M Sand
BA0 376 - 710 1220
BA20 376 93 568 1220
BA40 376 186 426 1220
BA60 376 278 284 1220
BA100 376 464 - 1220
[image:2.595.32.555.463.816.2]International Journal of Innovative Technology and Exploring Engineering (IJITEE) ISSN: 2278-3075, Volume-8 Issue-7, May, 2019
A. Compressive Strength Test
The specimens were tested as per standard proceedings of BIS 516-59 by compression testing machine after particular days ( 7 days ,28 days and 90 days) [11].
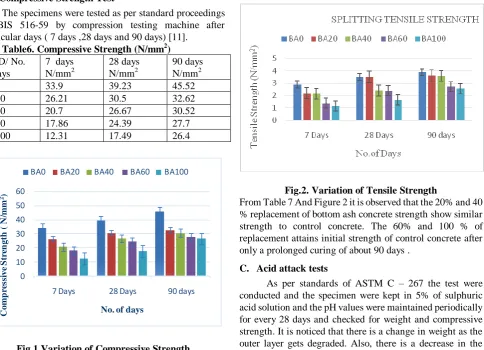
Table6. Compressive Strength (N/mm2)
Sp.ID/ No. of days
7 days N/mm2
28 days N/mm2
90 days N/mm2
BA0 33.9 39.23 45.52
BA20 26.21 30.5 32.62
BA40 20.7 26.67 30.52
BA60 17.86 24.39 27.7
BA100 12.31 17.49 26.4
0 10 20 30 40 50 60
7 Days 28 Days 90 days
C
om
p
re
ss
ive
S
tr
en
gth
(
N
/m
m
2)
No. of days
[image:3.595.65.550.59.409.2]BA0 BA20 BA40 BA60 BA100
Fig.1.Variation of Compressive Strength
From Table 6 and Figure 1 it is observed that there is no significant change in the compressive strength and mass of specimen up to 20-40% replacement level is safe. Beyond 40% replacement of bottom ash in cement concrete the compressive strength found to be decreased .
B. Splitting Tensile Strength
Tensile strength test was conducted as per standards of IS 5816, cylinder specimens of size 100mm diameter and 200mm length were casted, then testes at the age of 7, 28 and 90 days and the results are computed as given in Table 7..
Table 7. Tensile Strength (N/mm2)
Sp.ID/ No. of days
7 days N/mm2
28 days N/mm2
90 days N/mm2
BA0 2.9 3.5 3.89
BA20 2.21 3.5 3.62
BA40 2.15 2.41 3.58
BA60 1.4 2.4 2.73
BA100 1.17 1.66 2.56
Fig.2. Variation of Tensile Strength
From Table 7 And Figure 2 it is observed that the 20% and 40 % replacement of bottom ash concrete strength show similar strength to control concrete. The 60% and 100 % of replacement attains initial strength of control concrete after only a prolonged curing of about 90 days .
C. Acid attack tests
As per standards of ASTM C – 267 the test were conducted and the specimen were kept in 5% of sulphuric acid solution and the pH values were maintained periodically for every 28 days and checked for weight and compressive strength. It is noticed that there is a change in weight as the outer layer gets degraded. Also, there is a decrease in the compressive strength of the sample as compared to the initial strength.
Table 8. Percentage of change in strength in acid attack
Mix Proportions
% of change
28 days 56 days 90 days
BA0 8.1 13 15
BA20 13.1 14.47 14.5
BA40 13.7 17.32 20
BA60 16.35 18.8 26
0 10 20 30 40 50 60
P
er
ce
n
ta
g
e
o
f c
h
a
n
g
e
in
s
tr
en
g
th
(
N
/
m
m
2
)
No of Days
BA0 BA20 BA40
BA60 BA100
Fig.3. Change in Strength in Acid Attack
From Table 8 And Figure 3 for BA 20 and BA 40 there is 13 to 20% of change in strength and for BA100 there is major deterioration of 40% change in strength when compared to its initial strength.
D. Sulphate attack tests
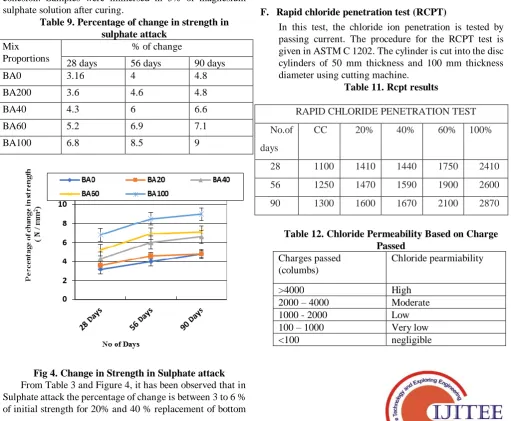
[image:4.595.72.274.57.220.2]The test has been done as per the standards of ASTM C 1012-10. In sulphate attack, sulphate reacts and there will be disruption of cement paste that leads to loss in strength and cohesion. Samples were immersed in 5% of magnesium sulphate solution after curing.
Table 9. Percentage of change in strength in sulphate attack
Mix Proportions
% of change
28 days 56 days 90 days
BA0 3.16 4 4.8
BA200 3.6 4.6 4.8
BA40 4.3 6 6.6
BA60 5.2 6.9 7.1
BA100 6.8 8.5 9
Fig 4. Change in Strength in Sulphate attack
From Table 3 and Figure 4, it has been observed that in Sulphate attack the percentage of change is between 3 to 6 % of initial strength for 20% and 40 % replacement of bottom
ash when compared to controlled concrete which is allowable.For 60% replacement at the end of prolonged curing the deterioration in concrete is high and for 100% replacement deterioration is 9% to that of controlled concrete.
E. Salt Water Resistance
The chloride resistance of control concrete and BA concrete were evaluated by measuring the residual compressive strength after chloride exposure. Cubes were immersed in solution after 28days of curing period. Sodium Chloride (NaCl) solution with 5% concentration was used as the standard exposure. The specimens were immersed in the Sodium Chloride solution in a tank. The test where carried as per IS code specifications.
Table 10. Percentage of change in strength in Chloride attack
Mix Proportions
% of change
28 days 56 days 90 days
BA0 1.24 3.2 3.4
BA200 1.97 4.9 6.3
BA40 2.52 5.05 6.4
BA60 2.8 6.9 7.2
BA100 3.37 8.5 8.9
As per test results reported in Table 10 the concrete is durable and resistance in salt water penetration.
F. Rapid chloride penetration test (RCPT)
In this test, the chloride ion penetration is tested by passing current. The procedure for the RCPT test is given in ASTM C 1202. The cylinder is cut into the disc cylinders of 50 mm thickness and 100 mm thickness diameter using cutting machine.
Table 11. Rcpt results
RAPID CHLORIDE PENETRATION TEST
No.of
days
CC 20% 40% 60% 100%
28 1100 1410 1440 1750 2410
56 1250 1470 1590 1900 2600
90 1300 1600 1670 2100 2870
Table 12. Chloride Permeability Based on Charge Passed
Charges passed (columbs)
Chloride pearmiability
>4000 High
2000 – 4000 Moderate
1000 - 2000 Low
100 – 1000 Very low
[image:4.595.44.556.376.797.2]International Journal of Innovative Technology and Exploring Engineering (IJITEE) ISSN: 2278-3075, Volume-8 Issue-7, May, 2019
[image:5.595.289.555.52.420.2]Fig 5.Change in Strength in chloride penetration
Table 12 represents the standard values and comparing it with the results obtained it shows that the samples are resistant to chloride penetration, where the conventional concrete is resistant with the category of very low and the other mix proportion are low. Thus, BA concrete is resistant to chloride attack since they are less permeable, less porous.
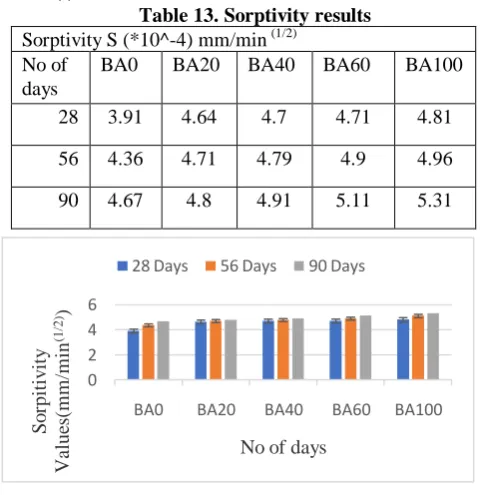
G. Sorptivity
Sorptivity test is carried as per ASTM C1585-13. It determines the absorption of water in concrete over time. The samples were cut into disc cylinders of 65mm thick using concrete cutter .The equation for calculation of sorptivity is
M (t) =c* t1/2
Table 13. Sorptivity results
Sorptivity S (*10^-4) mm/min (1/2) No of
days
BA0 BA20 BA40 BA60 BA100
28 3.91 4.64 4.7 4.71 4.81
56 4.36 4.71 4.79 4.9 4.96
90 4.67 4.8 4.91 5.11 5.31
0 2 4 6
BA0 BA20 BA40 BA60 BA100
S
o
rpi
ti
v
it
y
V
al
ue
s(m
m
/m
in
(1
/2
))
No of days
28 Days 56 Days 90 Days
Fig.6.Variation in water absorption
From Table 13, it is observed that greater the Sorptivity coefficient, the greater is the Sorptivity of the sample and the durability of the sample reduces. Since it is below 6 for all the mixes, the quality of concrete is good
H. Ultra Sonic Pulse Velocity Test
[image:5.595.64.291.54.236.2]Ultrasonic pulse velocity (UPV) is a meant for assessing variations in the apparent strength of concrete; it is a non destructive test.UPV equipment is also used for detecting the presence of voids, honeycombing or other discontinuities.
Table 14. Ultra Sonic Pulse Velocity Range
PULSE VELOCITY CONCRETE QUALITY
>4.0 km/s Very good to excellent
3.5 – 4.0 km/s Good to very good, slight
porosity may exist
3.0 – 3.5 km/s Satisfactory but loss of
integrity is suspected
<3.0 km/s Poor and los of integrity
exist.
Table 15. Ultra Sonic Pulse Velocity Observation
MIX Velocity (km/s)
7 days 28 days
BA0 4.14 4.23
BA20 4.1 4.13
BA40 3.82 3.9
BA60 3.3 3.4
BA100 2.28 3.1
0 2 4 6
BA0 BA20 BA40 BA60 BA100
V
e
lo
c
it
y
(K
m
/s)
[image:5.595.50.292.415.663.2]No of days 7 Days 28 days
Fig.6.Variation in charges Passed
Comparing the recorded values of sample from Table 15 to the standard value on Table 14, it is observed that BA0, BA20 mix are of excellent quality and BA40, BA60 mix is Satisfactory but loss of integrity is suspected.
V. CONCLUSION
Based on the results obtained from the experiments the subsequent conclusions can be derived regarding the performance of the concrete.
1. In fresh concrete properties the BA mix is workable and consistent.
2. It is observed that with an increase in bottom ash percentage beyond 40% decrease in compressive and tensile strength of concrete. Mix BA20 and BA 40 have high potential to meet the strength and workability properties.
3. Based of the NDT test it is observed that on various percentage of concrete mix they produced good results.
REFERENCES
1. Akkadath Abdulmatin,Weerachart Tangchirapat,ChaiJaturapitakkul (2018).An investigation of bottom ash as a pozzolanic material. Volume 186, 20 October 2018, Pages 155-162.
2. Navdeep Singh , Mithulraj M., Shubham Arya, 2018. Influence of coal bottom ash as fine aggregates replacement on various properties of concretes.Volume 138, November 2018, Pages 257.
3. Xiang Guo Li , Zhuo Lin Liu, Yang Lv , Li Xiong Cai , Dong Bing Jiang , Wen Guang Jiang, Shouwei Jian (2018). Utilization of municipal solid waste incineration bottom ash in autoclaved aerated concrete.Construction and Building Materials 178 (2018) 175–182.
4. Mahdi Rafieizonooz , Jahangir Mirza , Mohd Razman Salim , Mohd Warid Hussin , Elnaz Khankhaje (2016). Investigation of coal bottom ash and fly ash in concrete as replacement for sand and cement. Construction and Building Materials 116 (2016) 15–24.
5. Oban and Ogah. (2016).Effect of Curing Methods on the Compressive Strength of Concrete”.International Journal of Engineering and Computer Science. Volume 5(7) 17161-17171.
6. Malkit Singh and Rafat Siddique (2015). Effect of coal bottom ash as partial replacement of sand on properties of concrete. Resources, Conservation and Recycling 72 (2013) 20– 32
7. L.B. Andrade, J.C. Rocha , M. Cheriaf (2009).Influence of coal bottom ash as fine aggregate on fresh properties of concrete. Construction and Building Materials Volume: 23 Issue Number: 2 Publisher: Elsevier ISSN: 0950-0618
8. Mardani-Aghabaglou, M. Tuyan, K. Ramyar, (2014) Mechanical and durability performance of concrete incorporating fine recycled concrete and glass aggregates, Mater. Struct. IS 2629–2640, http://dx.doi.org/10.1617/ s11527-014-0342-3.
9. IS 383-1970.,Specification for coarse and fine aggregates from natural sources for concrete, Bureau of Indian Standards, New Delhi, 1997.
10.IS 516-1959., Indian Standard methods of tests for strength of concrete, Bureau of Indian Standards,2006.
11.IS 10262.2009 – Guidelines for Concrete Mix proportioning.
AUTHORSPROFILE
Jawahar.S, M.Tech Structural Engineering, SMBS, VIT Chennai,600124, India. [email protected] 7200401463
Magesh.M,M.Tech Structural Engineering, SMBS, VIT Chennai,600124, India. [email protected] 7845644006
Dr.Vasugi.V, Associate Professor,
School of Mechanical and Building Sciences, VIT Chennai, India..
Email: [email protected] Jagen. V, Structural Consultant,
RAMANIYAM REAL ESTATES PVT LTD.,