International Journal of Innovative Technology and Exploring Engineering (IJITEE) ISSN: 2278-3075, Volume-8 Issue-7 May, 2019
Abstract: In past few decades, Linde Buzo Gray (LBG) is considered as an important vector quantization (VQ) technique to construct local optimum codebook to compress images. Presently, swarm intelligence based optimization algorithms like firefly algorithm (FA), particle swarm optimization (PSO) and honey bee mating optimization (HBMO) are developed to generate a near global codebook. The FA suffers from the drawback of random movement in case of the absence of brighter fireflies whereas PSO becomes instable in case of high particle velocities. Keeping these limitations in mind, in this paper, we present a social spider (SS) algorithm which undergoes optimization of the LBG codebook. The presented SS-LBG approach ensures that the global codebook will be generated to effectively compress the images. The proposed SS-LBG method is experimented on benchmark images and the results are assessed interms of compression performance as well as reconstructed image quality. The experimental outcome verified that the SS-LBG shows superior performance over the compared methods significantly. The presented method exhibits superior performance with a maximum compression performance with an average compression ratio (CR) of 0.44305, space saving (SS) of 55.696, bit rate of 3.60815 and peak signal to noise ratio (PSNR) of 52.86348.
Index Terms: Image compression, LBG, Social spider, Vector quantization
I. INTRODUCTION
Image compression is a hot research topic because of the global increase in multimedia applications [1]. At the present moment, the development of efficient image compression method with superior compression performance as well as reconstructed image quality is a very difficult process and several researches are going on it. Image compression is intended to communicate an image with least number of bits. The process of identifying the redundant data in the image, encoding and transformation forms the basis of image compression. Most commonly available image compression method is JPEG. Generally, quantization can be classified into two ways: scalar and vector quantization (VQ). From several years, VQ method had been employed for compressing images.
Revised Manuscript Received on May 06, 2019
Hema Rajini N, Department of Computer Science and Engineering, Alagappa Chettiar Government College of Engineering and Technology, Karaikudi – 630003, Tamilnadu, India.
Conventionally, VQ is separated into three stages: vector encoding, vector decoding [2, 3] and codebook generation. The codebook generation is the highly significant procedure which determines the VQ performance. The process of searching the code vectors aims to generate codebook for the training vectors that are given through the reduction of the average couple difference among the training vectors and its respective codewords.
The operations of VQ [4], a vector encoding method involves the image partitioning into numerous input vectors and then it is compared along with codebook codewords with a view to search the nearby code word of every input vector. Within the codebook index, the VQ usually encode every input vector. Generally, the codebook size is comparatively small when compared to actual dataset of images; hence, the intention of image compression is achieved. Through the encoded codebook in decoding procedure, the linked sub-images are retrieved precisely. While every sub-image is entirely rebuilt, the decoding process is done. Several researches have derived methods for constructing codebook. The entire VQ algorithms were divided into two types: (1) k-means-based and (2) competitive learning-based. In terms of series of mutual competition procedure, the codebooks were gained in competitive learning-based techniques [5]. To reduce a distortion error of choosing an appropriate codebook, the k-means based methods were modeled. LBG algorithm [6] is a popular technique; but it follows a procedure of local search. It has one major disadvantage that the performance is highly based on primary conditions.
To model the codebook for enhancing the LGB algorithm, evolutionary optimization techniques had been built. To construct the codebook design, [7] uses ant colony system (ACS) method. To demonstrate vector in bidirectional graph and codebook generation, ACS is used subsequent to appropriate depositing pheromone mechanism over the graph edges. Depending on particle swarm optimization (PSO), [8] projected an enhancement over this. To initiate global best particle, LBG algorithm outcome was employed through that it might speed up the rate of PSO convergence. To resolve the 0–1 knapsack problem, [9] projected a quantum particle swarm algorithm (QPSO). To choose the constraints in multilevel thresholding [10] used QPSO algorithm. For every particle, the QPSO method estimates the local points from gbest and pbest and u and z are the two attributes that modifies the respective particle
position. For VQ, [11] designed an evolutionary
Efficient Image Compression Technique Based
On Vector Quantization Using Social Spider
Optimization Algorithm
Algorithm
PSO-VQ learning method. Depending on the honey bee mating optimization (HBMO), [12] modeled a novel VQ technique.
For resolving the drawbacks of the reviewed methods, in this paper, we present a social spider (SS) optimization algorithm for the first time to design an efficient codebook resulting to effective VQ for high compression performance and also reconstructed image quality. Here, we employ SS algorithm to construct codebook for image compression. The SS-LBG method needs to initialize the population and iteration count as same as other algorithms present in the literature. SS algorithm offers better exploration of the search space that leads to optimum construction of codebook. A detailed comparative study is made with FF-LBG and CS-LBG interms of different measures.
This paper is planned as below. The fundamentals of LBG algorithm and VQ are discussed in Section 2. Section 3 presents the method which searches for the optimal codebook using the SS-LBG algorithm. Performance evaluation is discussed in in Section 4. Conclusions are presented in Section 5.
II. BACKGROUND INFORMATION A. Vector Quantization
VQ is a method of block coding commonly employed in image compression. The modeling of codebook is a significant procedure in VQ. Fig. 1 shows the overall procedure involved in VQ. The original pixel sized image
is , where pixels are divided to various
pixels block sizes. Alternatively, input vector
holds a collection of
set and denote . In L-dimensional
Euclidean space, the input vector reside and the L-dimensional code words are comprised by codebook
Through a row vector , each input
vector is denoted as that is
demonstrated through codebook's jth codeword. Each input vector is assigned through VQ methods to relative codeword for compress images, the codeword would be transformed through respective input vectors. Through the minimization of distortion function D, it aims to optimize and it defined as,
(1)
Subjected to the limitations of
(2)
(3)
Let , here
demonstrates the reduced kth element in the training vector
and refers the highest of the input vector kth component.
The refers to the Euclidean distance among
the codeword and vector .
Fig.1. Overall process of VQ
B. LBG algorithm
In 1957, LBG is a scalar quantization method developed by Lloyd and in 1980 [13], it is universally accepted as VQ. The processes involved in the LBG are depicted in Fig. 2. To decide the codebook, it uses two above-mentioned constraints. Let d refer the distance function, input vector is
denoted as and
refers the initial codewords. To retrieve the optimal codebook, LBG algorithm uses two conditions repeatedly as represented below:
Through the reduced distance rules, segment the input vector into various groups. The resultant block is
preserved into in which U is the binary indicator matrix that the elements are demonstrated as
(4)
International Journal of Innovative Technology and Exploring Engineering (IJITEE) ISSN: 2278-3075, Volume-8 Issue-7 May, 2019
(5)
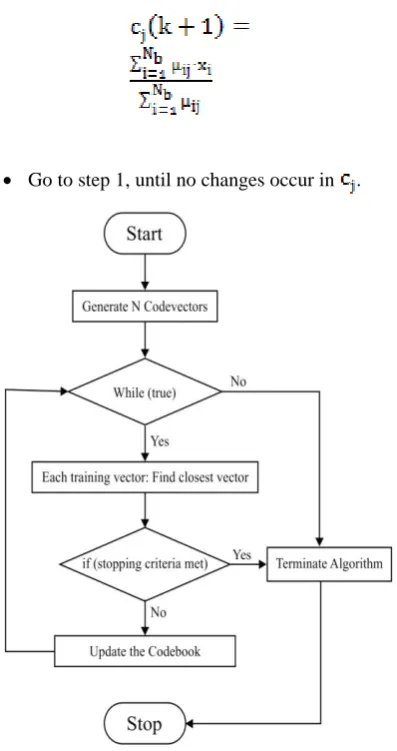
[image:3.595.63.262.45.421.2] Go to step 1, until no changes occur in .
Fig. 2. Flow chart of LBG method
III. THE PROPOSED SS-LBGMETHOD
[image:3.595.281.548.51.176.2]The proposed SS-LBG method performs VQ and the entire process is depicted in Fig. 3. The basic operation of SS-LBG is given as follows: Input image undergo partitioning to many non-overlapping blocks and then quantized by LBG algorithm for codebook construction. The created codebook will be trained by the SS algorithm to satisfy the need of the global convergence and the characteristics of global convergence rate. Additionally, the SS algorithm has the property of searching local as well as global codebooks. Every non-overlapping blocks of the input image is allotted to a nearest code word of the trained codebook and its equivalent index number produces an index table. On the receiving end, the reverse procedure will be initiated. When the index table is successfully reconstructed by the SS-LBG method, each reconstructed index and the code words are arranged properly for regenerating the applied input image with good visual image quality.
Fig. 3. Overall process of SS-LBG
Cuevas et al. 2013 [14] modeled the SS algorithm, a population dependent swarm intelligence algorithm. The communal web and social members are the two common spider colony elements. The members in social spider colony are divided into female and male spiders. While compared with male spiders, female spiders are higher in count with a 7:3 proportion of the entire colony members. Among other spiders, female spiders exhibit repulsion or attraction depending upon the vibrations based on distance and weight members. Subsequently, the male spiders are segmented to non-dominant and dominant spiders. Dominant spiders are the ones which comprise of enhanced fitness function and remaining are considered as dominant spiders. The mating procedure is carried out through dominant male and it is responsible to distribute the data among them. To produce offspring, the dominant male can mate with one or more female within a certain range. With optimization problem, SS algorithm is mapped as follows:
• The search space is denoted by communal web. • Each separate solution is defined by spider position in
web.
• The solution fitness value is denoted through each spider weight.
Fig. 4 demonstrates the SS algorithm workflow which contains four main stages [15]:
• Initialization,
• Male cooperative operator, • Female cooperative operator and • Mating operator
Fig. 4. Workflow of SS algorithm
Population initialization The SS algorithm starts with
[image:3.595.307.547.450.819.2] [image:3.595.309.544.571.730.2]Algorithm
initialization of N spider locations (solutions). Male mi and female fx spiders are present in the whole population. The entire sum of female spider is selected arbitrarily as
65-90% and is estimated through the below Eq. (6). In Eq. (7), the entire of sum of male spider Nm is estimated.
(6) (7)
Among the phigh upper initial parameter bound and plow low initial parameter, fi refers to the female spider location in an arbitrary way and is given in Eq. (8):
(8)
where . Then, mi refers to
the position of male spider and is arbitrarily formed as given in Eq. (9).
(9)
where .
Fitness value
The solution quality is denoted through every spider weight and the function rate of each solution i as given in Eq. (10)
(10)
where fitness value is denotes the rate of and
representing the minimum and maximum solution
rates.
Vibration modeling
The vibrations though communal web is designed as follows. Through the small vibration implications, the colony members communicate through communal web. Distance and weight of the spider which created it are depend on vibrations. The data is transferred by means of received vibration from member y by member x and is designed in Eq. (11).
Euclidian distance among two spiders x and y are indicated as . Among two spiders, three vibration kinds occur and
they are , and .The data transferred among
member and individual x in , i.e. the nearest
member to x with high weight and is given as:
(12)
The data transferred among the member and
individual x is defined subsequently and the good member in S is given as
(13)
At the end, data transferred from x is defined as to the
nearest female individual and it can be described as
(14)
Female cooperative operator
Without considering the gender as a factor, female spiders exhibit repulsion or attraction. The movement of repulsion and attraction is based on various arbitrary criteria. With the range [0, 1], the random number is uniformly produced.
An attraction is produced while is lower when compared
to the threshold PF which is predefined and expressed below.
(15) Male cooperative operator
Weight rate is determined by the male spider with respect to the male population median value. The spider with high weight is denoted as D and non-dominant ND are the remaining spiders. Through , the median weight is
indexed. Eq. (16) demonstrates the male spider location.
(16) Mating operator
Commonly, mating occurs among dominant female spiders and male spider. A female spider groups undergo mating with male spiders which are dominant within a certain range as expressed below
(17)
High probabilities are comprised by the spiders which have high weight to create off spring. The entire process of SS-LBG is summarized into five sub processes which are listed here.
Step 1: At the beginning, the parameters will undergo initialization where the
International Journal of Innovative Technology and Exploring Engineering (IJITEE) ISSN: 2278-3075, Volume-8 Issue-7 May, 2019
and the remaining set of initial solutions are arbitrarily generated. Each solution indicates a codebook of Nc codewords. In addition, the initialization of the parameters involved in SS algorithm also takes place.
Step 2: After the initialization process, the current best solution will be chosen by the determination of the fitness of each location as defined in Eq. (2) and determines the maximum fitness location as the finest one.
Step 3: Once the present best solutions are derived, new solutions will be produced in the roaming procedure. If the dominant male identifies a new location which is effective than the current one, then it will update the best visited location.
Step 4: Next, a ranking procedure will be initiated and the solutions will be ranked depending upon the fitness function in the subsequent step and chooses the optimal one.
Step 5: Step 2 and Step 3 will be iterated until the stopping condition is reached.
IV. EXPERIMENTAL ANALYSIS A. Dataset Description
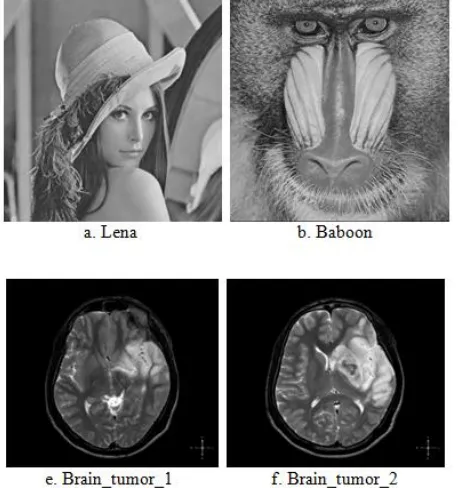
[image:5.595.317.553.51.320.2]To examine the proposed SS-LBG method, a detailed experimental analysis is done to verify the obtained outcome. To validate the efficiency in many perspectives such as quality of reconstructed image and compression efficiency, the projected method is tested on a set of benchmark images. JPEG2000, CS-LBG and FF-LBG are employed for comparative analysis. Using the benchmark images namely Lena, Baboon, boat.512, 5.3.01, Brain_tumor_1, Brain_tumor_2, Brain_tumor_3 and Brain_tumor_4, the experimental analysis was made. Table 1 gives the dataset description and Fig. 5 shows the test images used for experimentation.
[image:5.595.59.288.472.716.2]Fig. 5. Test images
Table 1. Dataset Description
Dataset Image Name Dimensions Original Size
Miscellaneous
Lena 512*512 263222
Baboon 512*512 263222
Boat.512 512*512 262278
5.3.01 1024*1024 1048710
Brain Tumor
Brain_tumor_1 225*225 52378
Brain_tumor_2 211*239 51746
Brain_tumor_3 202*249 51874
Brain_tumor_4 225*225 52378
To examine the outcomes, various metrics were employed such as compression ratio (CR), Space Saving (SS) and Bit rate. In addition, the model efficiency is examined by means of peak signal to noise ratio (PSNR) to assess the image quality. Figs. 6-8 and Tables 2-4 shows the outcome achieved by different LBG techniques with respect to CR, SS and bit rate correspondingly. The rate of bit rate and CR should be low for enhanced compression efficacy whereas the SS should be high.
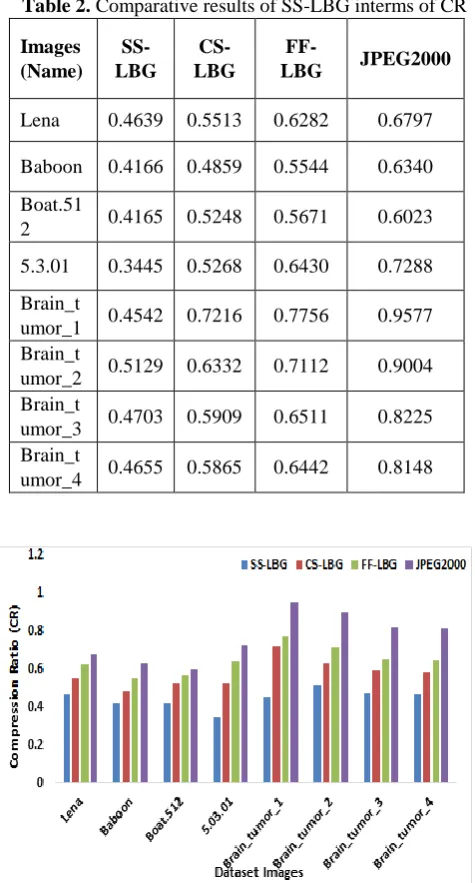
Table 2 and Fig. 6 exhibits the obtained CR on the given dataset and compared with the conventional methods. The compared methods exhibit
worst results over the
Algorithm
[image:6.595.306.549.110.532.2]JPEG2000 gives poor CR of 0.9577 for the given Brain_tumor_1 dataset. On the other hand, the projected SS-LBG exhibits good performance for all the given dataset and it works well for the test image " 5.3.01". The average CR achieved by CS-LBG, FF-LBG and JPEG2000 for the entire data set images are 0.577625, 0.64685 and 0.767525 respectively for. The average CR for projected SS-LBG method is 0.44305 which implies the enhanced results when comparing with the conventional methods.
Table 2. Comparative results of SS-LBG interms of CR Images
(Name) SS- LBG
CS- LBG
FF-
LBG JPEG2000
Lena 0.4639 0.5513 0.6282 0.6797
Baboon 0.4166 0.4859 0.5544 0.6340
Boat.51
2 0.4165 0.5248 0.5671 0.6023
5.3.01 0.3445 0.5268 0.6430 0.7288
Brain_t
umor_1 0.4542 0.7216 0.7756 0.9577
Brain_t
umor_2 0.5129 0.6332 0.7112 0.9004
Brain_t
umor_3 0.4703 0.5909 0.6511 0.8225
Brain_t
umor_4 0.4655 0.5865 0.6442 0.8148
Fig. 6. Compression performance analysis interms of CR
Table 3 and Fig. 7 exhibits the results analysis of the SS-LBG interms of SS. By means of SS, the rates gained by the projected SS-LBG method prove that the SS-LBG is better than other techniques. The SS attained through SS-LBG is high in all the given dataset. Among all the dataset especially the test image'5.3.01' is the one which reaches the maximum space saving rate of 65.5522 by the proposed SS-LBG method. It is clear from the table that JPEG2000 is the method which produces low SS rate. For example, for the given Brain_tumor_1 dataset, 4.23270 is SS rate achieved by
JPEG2000. And at last, the proposed SS-LBG shows enhanced results on all the employed test images.
Table 3. Comparative results of SS-LBG interms of SS Images
(Name)
SS- LBG
CS- LBG
FF- LBG
JPEG200 0
Lena 53.6141 44.8663 37.1758 32.0338
Baboon 58.3420 51.4133 44.5628 36.5953
Boat.51
2 58.3518 47.5175 43.2880 39.7654
5.3.01 65.5522 47.3199 35.7000 27.1177
Brain_t
umor_1 54.5802 27.8418 22.4445 4.23270
Brain_t
umor_2 48.7091 36.6811 28.8834 9.96210
Brain_t
umor_3 52.9668 40.9087 34.8922 17.7546
Brain_t
[image:6.595.306.548.110.536.2]umor_4 53.4537 41.3494 35.5798 18.5173
Fig. 7. Compression performance analysis interms of SS
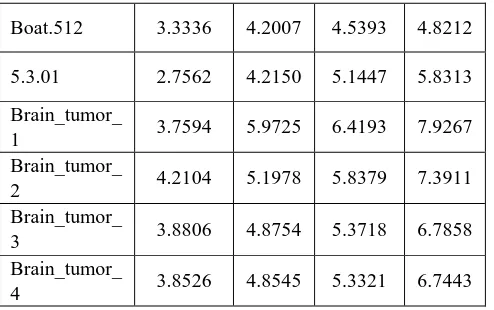
[image:6.595.50.288.187.629.2] [image:6.595.54.283.205.554.2]Table 4 and Fig. 8 provide the results analysis of the SS-LBG interms of bit rate. Based on bit rate, the projected SS-LBG shows excellent results compared with other methods like JPEG2000, CS-LBG and FF-LBG. The bit rate consumed by SS-LBG is very low implying the enhanced outcome. In general, JPEG2000 requires high bit rate in all cases because of its lossless nature.
Table 4. Comparative results of SS-LBG interms of Bit Rate Images
(Name)
SS- LBG
CS- LBG
FF- LBG
JPEG 2000
Lena 3.7261 4.4288 5.0466 5.4597
[image:6.595.301.550.663.834.2]International Journal of Innovative Technology and Exploring Engineering (IJITEE) ISSN: 2278-3075, Volume-8 Issue-7 May, 2019
Boat.512 3.3336 4.2007 4.5393 4.8212
5.3.01 2.7562 4.2150 5.1447 5.8313
Brain_tumor_
1 3.7594 5.9725 6.4193 7.9267
Brain_tumor_
2 4.2104 5.1978 5.8379 7.3911
Brain_tumor_
3 3.8806 4.8754 5.3718 6.7858
Brain_tumor_
4 3.8526 4.8545 5.3321 6.7443
[image:7.595.47.294.49.204.2]For example, for Brain_tumor_1 dataset, 7.9267 is the bit rate achieved by JPEG2000. At the same time, almost equal performances are exhibited through CS-LBG and FF-LBG. When compared with all methods, SS-LBG is the only method which shows good results on all the applied test images.
Fig. 8. Compression performance analysis interms of bit rate
[image:7.595.303.546.337.508.2]Table 5 and Fig. 9 analyzed the obtained results of various methods interms of PSNR. To analyze the visual image quality, PSNR value is measured. The results showed that the projected method is superior where it produces high quality images for all the applied dataset. On the whole, JPEG2000 produces manageable results. On average, SS-LBG shows better results over the compared ones. For example, for the dataset of Brain_tumor_4, it produces the PSNR value of 56.0221 which is high compared with all the other methods. On the whole, the proposed SS-LBG method is the superior one over the compared methods.
Table 5. Comparative results of SS-LBG interms of PSNR Images
(Name)
SS- LBG
CS- LBG
FF- LBG
JPEG 2000
Lena 51.2734 45.9082 43.2019 48.9721
Baboon 52.3813 44.9863 42.9134 46.9231
Boat.51
2 52.3876 44.2134 43.2102 46.9245
5.3.01 54.2865 46.2310 45.2910 47.8765
Brain_t
umor_1 54.9876 46.7954 46.0357 53.2172
Brain_t
umor_2 50.2763 46.2839 44.4386 51.1411
Brain_t
umor_3 51.2930 46.1168 45.1642 50.4965
Brain_t
umor_4 56.0221 47.1966 45.8008 54.7066
From the above tables and figures, it is confirmed that the SS-LBG outperforms the other approaches with respect to compression performance and also visual image quality. This is due to the usage of SS algorithm to construct the codebook process. The presented SS-LBG model can be applied to compress any type of real time images like medical, remote sensing, and so on.
[image:7.595.47.288.350.530.2]Algorithm
V. CONCLUSION
This paper has presented a SS-LBG method for effectively compress the images. The SS algorithm builds the optimum codebook and undergoes compression using VQ. The maximization of visual image quality is attained by the use of SS algorithm. It is analyzed under every probable variable of SS to effectively develop the codebooks and training vectors of VQ. It is noted that the experimental results exhibit better visual image quality of the reconstructed image in terms of PSNR over the compared FF-LBG, CS-LBG and JPEG2000. On average, SS-LBG shows better results over the compared ones. For example, for the dataset of Brain_tumor_4, it produces the PSNR value of 56.0221 which is high compared with all the other methods. It is interesting that the SS-LBG shows extremely better performance in terms of CR, SS, bit rate as well as PSNR.
REFERENCES
1. Rabbani, M., “JPEG2000: Image compression fundamentals, standards and practice. Journal of Electronic Imaging, 2002, 11(2), pp. 286. 2. Chang, C. C., Li, T. C., & Yeh, J. B. (2006). Fast codebook search
algorithms based on the tree-structured vector quantization. Pattern Recognition Letters, 27, 1077–1086.
3. Chen, T. S., & Chang, C. C., “Diagonal axes method (DAM): A fast search algorithm for vector quantization”, IEEE Transactions on Circuit System and Video Technology”, 1997, 7(3), pp. 555–559.
4. Patane, G., & Russo, M., “The enhanced LBG algorithm”, Neural Networks, 2002, 14, pp. 1219–1237.
5. Kohonen, T., “Self-organized formation of topologically correct feature maps”, Biological Cybernetics, 1982, 43, pp. 59–69. 6. U.Gowshika, S.Sathiya Priya, “An Identification of Abnormalities in
Dental with Support Vector Machine Using Image Processing”,
Emerging Research in Computing, Information, Communication and Applications, ISBN: 978-81-322-2549-2, Vol 1, pp 29-40.
7. Rajpoot, A., Hussain, A., Saleem, K. & Qureshi, Q., “Novel Image Coding Algorithm Using Ant Colony System Vector Quantization”, In International workshop on systems, signals and image processing,
Poznan, Poland, 2004.
8. Chen, Q., Yang, J. G., & Gou, J., “Image compression method using improved PSO vector quantization”, In First international conference on neural computation (ICNC 2005), Lecture Notes on Computer Science, 2005, Vol. 3612, pp. 490–495.
9. Wang, Y., Feng, X. Y., Huang, Y. X., Pu, D. B., Zhou, W. G., Liang, Y. C., et al., “A novel quantum swarm evolutionary algorithm and its applications” Neurocomputing, 2007, 70, pp. 633–640.
10. Zhao, Y., Fang, A., Wang, K. & Pang, H., “Multilevel minimum cross entropy threshold selection based on quantum particle swarm optimization”, In Proceeding of Eight ACIS international conference on software engineering, artificial intelligence, networking and parallel/distributed computing, 2007, pp. 65–69.
11. Feng, H. H., Chen, C. Y., & Ye, F., “Evolutionary fuzzy particle swarm optimization vector quantization learning scheme in image compression” Expert Systems with Applications, 2007, 32, pp. 213–222.
12. Horng, M. H., “Honey Bee Mating Optimization vector quantization scheme in image compression” AICI, Lecture Notes in Computer Science, 2009, 5855, pp. 185–194.
13. Lloyd, S. P., Least Square Quantization in PCM’s. Bell Telephone Laboratories Paper, Murray Hill. NJ, 1957.
14. E. Cuevas, M. Cienfuegos, D. Zaldvar, M. Prez Cisneros, “A swarm optimization algorithm inspired in the behavior of the social-spider”,
Expert Systems with Applications, 2013, 40(16), pp. 6374–6384. 15. James, J. Q., & Li, V. O., A social spider algorithm for global
optimization. Applied Soft Computing, 2015, 30, pp. 614-627.
AUTHORPROFILE
Hema Rajini received her BE, ME and PhD in Computer Science and Engineering from the Annamalai University, Chidambaram, in the year