http://www.sciencepublishinggroup.com/j/ijimse doi: 10.11648/j.ijimse.20180303.11
ISSN: 2575-3150 (Print); ISSN: 2575-3142 (Online)
Performance Analysis of Multi-Variable Control System
Based on Data Driven
Shizhe Li
*, Yinsong Wang
School of Control Science and Engineering, North China Electric Power University, Baoding, China
Email address:
*
Corresponding author
To cite this article:
Shizhe Li, Yinsong Wang. Performance Analysis of Multi-Variable Control System Based on Data Driven. International Journal of Industrial and Manufacturing Systems Engineering. Vol. 3, No. 3, 2018, pp. 17-24. doi: 10.11648/j.ijimse.20180303.11
Received: August 3, 2018; Accepted: September 9, 2018; Published: October 13, 2018
Abstract:
With the development of science and technology, the control system has become an indispensable means to ensure the safe, stable and efficient operation of the process with the improvement of system capability and modernization level. As time goes on, the characteristics of industrial production process will change, resulting in the degradation of control performance, product quality decline, directly affecting economic benefits. Therefore, performance evaluation of control system is of great significance to improve control performance and economic benefits of enterprises. Combustion control system is an important and typical multivariable control system in thermal power plant. Its performance evaluation is very important for power production process. So a method and detail steps of performance analysis based on data driven for multivariable control systems are presented. Using multivariate statistical analysis, the overall performance of the system and the performance index of the individual variable are defined respectively by the generalized eigenvalue of the covariance matrix. Through the supervisory information system, the data of the combustion control system of a certain thermal power unit is obtained and the operating data for one day is analyzed using the proposed method. The results show that this method can realize the relative accuracy evaluation of the overall performance and the individual performance for each controlled variable of the control system.Keywords:
Performance Analysis, Supervisory Information System, Multivariable Control System, Data Driven1. Introduction
With the development of science and technology, the industrial system in the modern production becomes more and more huge and the complexity of the system also increases. Once the failure of these systems occurred, which will cause huge loss of property and casualties. Therefore it is urgently needed to improve the security and maintainability of the complex system. The performance analysis of the dynamic system can effectively improve the reliability and safety of the system and reduce the risk of accidents and enhance the economic returns [1-3].
According to the combustion control system of power plant, we have carried out large number of basis researches. According to the performance analysis technology of the dynamic system, two kinds of method can be divided into qualitative analysis and quantitative analysis [4-6]. Qualitative analysis methods include graph theory, expert system and qualitative simulation [7-10]. Though this kind of method is
continuous development of industrial production process generates a large number of all kinds of data reflecting the production condition every day, how to effectively use these offline and online data has become an urgent problem to solve [17].
2. Theoretical Basis of Data Driven
Technology
Data driven technology is a kind of technology which can realize fault diagnosis and fault tolerance control for the process. Data driven performance evaluation technique is based on real-time acquisition of vast amounts of data of the industrial process, a variety of data processing technology and statistical modeling methods were used to detect and diagnose the varying performance of the process.
Data driven method includes machine learning, multivariate statistical analysis, signal processing, information fusion and rough set [18]. The multivariate statistical analysis is a kind of performance analysis of the correlation between multiple variables of the process. According to the historical data of process variables, multiple projection method will be used for this kind of method. And the corresponding statistic index for process monitoring will be calculated.
In the statistical analysis of data, the purpose is to extract and express the rich information of data set, and the covariance matrix generated by the data set is very useful in statistical analysis.
Statistical analysis results are often expressed as eigenvalue and eigenvector or their function characteristics of the covariance matrix. For example in principal component analysis (PCA), canonical correlation analysis, factor analysis, and other methods, the eigenvector and eigenvalue of the covariance matrix play a key role [19].
In statistics and probability theory, the covariance matrix is a matrix, and each element is the covariance between each vector element.
Definition 1: If a two-order moment exits for a two-dimensional random variable, the covariance is:
{
}
cov( , )X Y =E [X−E X( )][Y−E Y( )] (1) Definition 2: If the covariance matrix of the random vector x and y is a symmetric matrix, and the diagonal of the variance is:
{
}
cov( , )x y =E x[ −E x( )][y−E y( )] (2) The covariance matrix is computed from the covariance between different dimensions, and not between different samples. If the data is three dimensional
{
x y z, ,}
, the covariance matrix is:cov( , ) cov( , ) cov( , ) cov( , ) cov( , ) cov( , ) cov( , ) cov( , ) cov( , )
x x x y y z
Cov y x y y y z
z x z y z z
= (3)
A and B are two n order symmetric matrices, and the relative eigenvalues and eigenvectors of B and A are needed in multivariate statistical analysis.
Definition 3: Suppose A and B are two matrices of order n, if there exists a number λ and n-dimensional column vector x, meets Ax=λBx , then λ was known as a relative eigenvalue and x was known as a relative vector.
Combustion control system is a three-input three-output control system, therefore the three controlled variables of the operating data is three dimensional, the corresponding covariance matrix for the selection of reference data and monitoring data should be 3 3× dimensional symmetric matrix.
For multivariate data, when the variables of the dimension and the number are inconsistent, often transformation of data processing was needed to eliminate the magnitude and dimensional constraints for subsequent statistical analysis.
Z-score is also called standard deviation standard. The sample data matrix of p dimensional vector
1 2 ( , ,..., p)
X = X X X is:
11 12 1
21 22 2
1 2 ⋯ ⋯ ⋮ ⋮ ⋱ ⋮⋮ ⋯ p p
n n np
x x x
x x x
X
x x x
= (4)
After the standardized transformation the sample data matrix is:
* * *
11 12 1
* * *
21 22 2
* * * * 1 2 ⋯ ⋯ ⋮ ⋮ ⋱ ⋮⋮ ⋯ p p
n n np
x x x
x x x
X
x x x
= (5) *
, 1, 2,⋯, ; 1, 2,⋯, ij j
ij ij
x x
x i n j p
s −
= = = (6)
1 1 n j ij i x x n = =
∑
— (7) 2 1 1( ) 1, 2,...,
1 n
ij ij j
i
s x x j p
n =
= − =
−
∑
—
, (8)
Here
j x
— is the average value of the sample data for the
variableXj, and sijis the variance of the sample data for the
variable Xj , and sij is the standard deviation. After the
3. Performance Analysis Method and
Steps
Based on multivariate statistical analysis it shows that the choice of sample data should not be too short or long. If it is too short, the amount of data is too small, much chance to characterize this period time performance. If the data is too long, the amount of computation will be larger and the computation time will be longer. For the combustion control system can be viewed as three outputs, the time segment of the selected benchmark data and the monitoring data is also one hour, and the sample time is one second, so each variable of the standardized deviation consists of 3600 samples.
The data driven method for evaluating the performance of the combustion control system includes the following steps:
(A) The operation data of the system for 1 day was divided into 24 segments, so each segment was 1 hour long. The first hour of deviation data (ERR1 3600 3) × was viewed as the reference data and every followed hour of deviation data
2 3600 3
(ERR ) × was viewed as the monitoring data.
(B) Turn the reference and monitoring data to standardized form.
(C) Make use of Matlab command, the covariance matrices
3 3 cov( 1)
N × = ERR and N3 3× =cov(ERR2) will be obtained. After that the diagonal matrix of relative generalized eigenvalue λ=diag( ,λ λ λ1 2, 3) was obtained.
(D) According to the three generalized eigenvalues of step C, the performance analysis index is defined as
1 2 3
PAI = ⋅ ⋅λ λ λ and the rules of evaluating the overall performance of the system are as follows:
(1) If PAI is significantly larger than 1, then the overall performance of the monitoring period is worse than the reference period;
(2) If PAI is obviously less than 1, then the overall performance of the monitoring period is better than the reference period;
(3) If PAI is close to 1, the overall performance of the monitoring period is similar to that of the reference period and no obvious change has occurred.
(E) Within 24 hours, the data of the first hour was selected as benchmark data, and data of the second, the third, …, the twenty-fourth hour were viewed as monitoring data.
The relative eigenvalues and eigenvectors can be obtained using command of [ ,Q Lam]=eig N M( , ) in Matlab, output of Q is the relative eigenvalues and Lam is the relative eigenvectors.
(F) According to the above results, the performance analysis index PAI of every monitoring segment can be calculated and the performance of the whole control system can be evaluated according to the stem diagram.
(G) The performance evaluation index of each variable are defined as PAI1=λ1 , PAI2=λ2 and PAI3 =λ3 , the performance of each controlled variable of the system are evaluated and the rules are as follows:
(1) If PAIi is significantly larger than 1, the performance of the controlled variable i of the monitoring period is worse
than that of the reference period;
(2) If PAIi is obviously less than 1, the performance of the controlled variable i of the monitoring period is better than the reference period;
(3) If PAIi is close to 1, the performance of the controlled variable i is similar to the reference period, and no obvious change has occurred.
4. Experiment on Power Plant
Combusiton Control System
For the boiler, the three tasks of the combustion process effect to each other. There is a close relationship between the three variables and the combustion process is typically a multivariable control system [20].
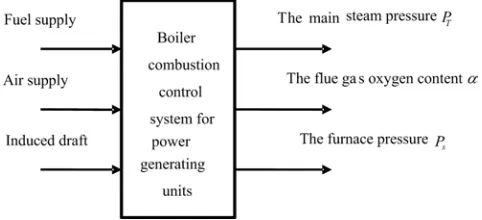
The combustion control system shown below in Figure 1 is a part of the coordinated control system, and it is composed of the main fuel control system, the air supply adjustment system and the furnace pressure adjustment system. The load of the unit is guaranteed by the fuel supplying timely and sufficient burning in the furnace.
Figure 1. The chart of boiler combustion control system.
The task of the main fuel control system is to control the amount of fuel accessing to furnace, under the premise of ensuring the quality of steam, and to provide thermal energy to meet the steam flow requirements. When the load of the unit changes, the main fuel control system regulates the amount of the fuel, the combustion can provide the thermal energy to meet the requirements. At the same time, the corresponding adjustment of the air regulating system and furnace pressure control system were carried out to ensure the sufficient combustion of the fuel and the safety of the furnace.
Maintaining the furnace pressure for a given value (negative pressure) was adjusted by the lead wind motor. The basic task of furnace pressure adjust is to ensure stability of the combustion of the fuel in the furnace and the safety of furnace, reducing the environmental pollution at the same time.
process [21].
Boiler regulates the steam pressure and the steam turbine controls the load, in this case, the tasks for the boiler automatic combustion control are:
(1) Maintaining the pressure and the pressure should be maintained at a given value in the range of ±0.2MPa.
(2) The control system should keep the furnace oxygen at a given value in the range of ±0.5%.
(3) The control system should keep the negative pressure of the furnace at a given value in the range of ±30Pa.
Boiler regulates the load and the steam turbine controls the steam pressure, in this case, the tasks for the boiler automatic combustion control are:
(1) Maintaining the load of the units;
(2) Maintaining the excess air stability in the furnace to ensure the burning economical;
(3) To maintain the furnace negative pressure, the control system should keep the furnace pressure at a given value within ±30Pa.
The supervisory information system in thermal power plant is a factory production process real-time and historical
data platform, for the whole factory production process providing comprehensive optimization service, realizing the real-time production process management and monitoring information system for thermal power plant construction. The following historical data used for control system performance analysis were obtained from supervisory information system.
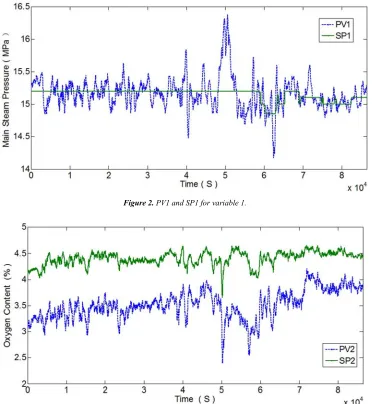
Take the operation data of the boiler (330MW) combustion control system for 24 hours for example. From the thermal power plant supervisory information system (SIS) data were obtained, and re-sampling was needed in order to facilitate subsequent data processing, and re-sampling period was 1 second, so 86400 6× samples were collected finally. Three of the controlled variables are respectively the main steam pressure (MPa, variable 1), the oxygen content (%, variable 2) and the pressure of the furnace (Pa, variable 3). The process value (PV) and set point (SP) value of the three variables of the combustion control system are shown correspondingly to the Figure 2, Figure 3 and Figure 4 below.
Figure 2. PV1 and SP1 for variable 1.
Figure 4. PV3 and SP3 for variable 3.
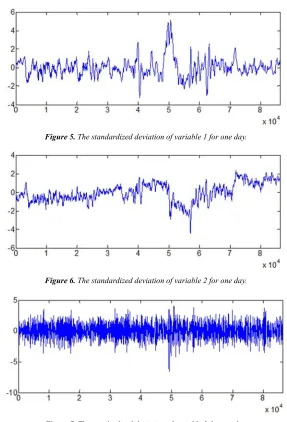
The performance evaluation method based on data driven for thermal power unit combustion control system, first of all, it needs to obtain the closed loop operating data PV values and set point values of the corresponding controlled variables, secondly calculating the deviation value ERR=PV-SP and the standardized deviation value of the three variables were shown correspondingly to the Figure 5, Figure 6 and Figure 7 below.
Figure 5. The standardized deviation of variable 1 for one day.
Figure 6. The standardized deviation of variable 2 for one day.
5. Results and Analysis
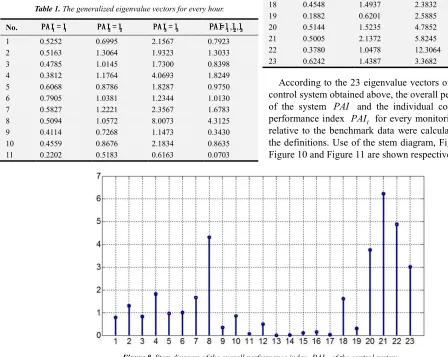
The proposed performance evaluation method based on data driven applied to a certain power plant boiler. Performing the above performance evaluation steps, 23 generalized eigenvalue vectors for 23 monitoring segments were obtained as follows Table 1.
Table 1. The generalized eigenvalue vectors for every hour.
No. 1111 1111
P A I= l P A I= l P A I= l P A I= l
2 2 2 2 2 2 2 2
P A I = l P A I = lP A I = l P A I = l
3 3 3 3 3 3 3 3
P A I= l P A IP A I= l= l
P A I= l , ,
1 2 1 2 1 2 1 2 3333
PA I= lll PA IPA I= l= lllll PA I= lll 1 0.5252 0.6995 2.1567 0.7923 2 0.5163 1.3064 1.9323 1.3033 3 0.4785 1.0145 1.7300 0.8398 4 0.3812 1.1764 4.0693 1.8249 5 0.6068 0.8786 1.8287 0.9750 6 0.7905 1.0381 1.2344 1.0130 7 0.5827 1.2221 2.3567 1.6783 8 0.5094 1.0572 8.0073 4.3125 9 0.4114 0.7268 1.1473 0.3430 10 0.4559 0.8676 2.1834 0.8635 11 0.2202 0.5183 0.6163 0.0703
No. 1111 1111
P A I= l P A I= l P A I= l P A I= l
2 2 22 22 2 2
P A I = l P A I = l P A I = l P A I = l
3 3 33 33 3 3
P A I= l P A I= l P A I= l
P A I= l , ,
1 2 11 22 1 2 3333
PA I= lll PA I= lll PA I= lll PA I= lll 12 0.4579 0.6543 1.6665 0.4993 13 0.0973 0.2861 0.3885 0.0108 14 0.0987 0.0987 0.7470 0.0263 15 0.3845 0.4540 0.6975 0.1217 16 0.3570 0.5513 0.7921 0.1559 17 0.2081 0.3785 0.5112 0.0403 18 0.4548 1.4937 2.3832 1.6191 19 0.1882 0.6201 2.5885 0.3021 20 0.5144 1.5235 4.7852 3.7504 21 0.5005 2.1372 5.8245 6.2303 22 0.3780 1.0478 12.3064 4.8743 23 0.6242 1.4387 3.3682 3.0249
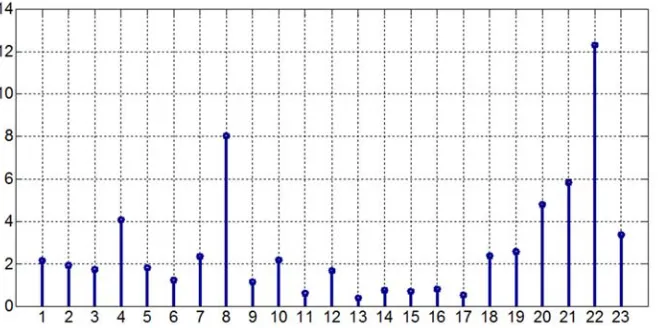
According to the 23 eigenvalue vectors of the combustion control system obtained above, the overall performance index of the system PAI and the individual controlled variable performance index PAIi for every monitoring data segment relative to the benchmark data were calculated according to the definitions. Use of the stem diagram, Figure 8, Figure 9, Figure 10 and Figure 11 are shown respectively below.
Figure 8. Stem diagram of the overall performance index PAI of the control system.
From Figure 8, it can be seen that the overall control performance is better in the thirteenth and seventeenth monitoring data segment.
In Figure 9, the controlled variable 1 is the main steam pressure. During the monitoring time of 23 hours, all of 23 eigenvalues were less than 1, so the performance of the controlled variable 1 of the monitoring period is better than the reference period and the control performance of main steam pressure improved the most within the 13th and 14th monitoring period.
Figure 10. Stem diagram of the individual performance indexPAI2for the controlled variable 2
In Figure 10, the controlled variable 2 is the oxygen content in flue gases. Compare the values of the eigenvalues to each other. During the total of 23 hours of the monitoring time, the performance of the controlled variable 2 of the 21st monitoring period is the worst and performance of the 13th and 14th monitoring time period is the best.
Figure 11. Stem diagram of the individual performance indexPAI3for the controlled variable 3.
In Figure 11, the controlled variable 3 is the furnace pressure. During the total of 23 hours of the monitoring time, the performance of the controlled variable 3 of the twenty-second monitoring period is the worst and performance of the 13th monitoring time period is the best.
6. Conclusion
From the above analysis, it does not need to find the "golden reference" data which is also difficult to obtain. The "golden reference" data can be first given initial "reference" data and it can be rolling optimized after a certain period of time. The "old" benchmarks can be substituted and redefined as the "new" benchmark.
The advantage of this method is that it can be used to evaluate the overall performance of the system as well as the control performance of every individual variable, so it can also
be widely used for other multivariable systems. In short, data driven performance analysis method do not need to process accurate analytical model, and it is more easily and directly applied in other real industrial system.
Acknowledgements
This research was partially supported by the Fundamental Research Funds for the Central Universities of China (No. 2017MS189).
References
[2] Wen L, Li X, Gao L, et al. A New Convolutional Neural Network-Based Data-Driven Fault Diagnosis Method [J]. IEEE Transactions on Industrial Electronics, 2018, 65 (7):5990-5998.
[3] Lipiński M, Ziaja E. A System for Diagnostics and Automatic Control System Monitoring as a Tool to Supervise Operation and Forecast Power Units Preventive Actions [M]// Advanced Solutions in Diagnostics and Fault Tolerant Control. 2018. [4] Ye H, Wang Z, Wang L. Effects of PCM on power consumption
and temperature control performance of a thermal control system subject to periodic ambient conditions [J]. Applied Energy, 2017, 190:213-221.
[5] Shardt Y A W. Using MATLAB ®, for Statistical Analysis [M]// Statistics for Chemical and Process Engineers. Springer International Publishing, 2015.
[6] Jelali M. An overview of control performance assessment technology and industrial applications [J]. Control Engineering Practice, 2006, 14 (5):441-466.
[7] Harris T J. Assessment of control loop performance [J]. Canadian Journal of Chemical Engineering, 2010, 67 (5):856-861.
[8] Huang B, Shah S L. Practical issues in multivariable feedback control performance assessment [J]. Journal of Process Control, 1997, 8 (5):421-430.
[9] Watson M M, Seliman A F, Bliznyuk V N, et al. Evaluation of Shiryaev-Roberts procedure for on-line environmental radiation monitoring. [J]. Journal of Environmental Radioactivity, 2018.
[10] Yu J, Qin S J. Statistical MIMO controller performance monitoring. Part I: Data-driven covariance benchmark [J]. Journal of Process Control, 2008, 18 (3):277-296.
[11] Mcnabb C A, Qin S J. Projection based MIMO control performance monitoring: II––measured disturbances and setpoint changeS [J]. Journal of Process Control, 2005, 15 (1):89-102.
[12] Yin S, Ding S X, Xie X, et al. A Review on Basic Data-Driven Approaches for Industrial Process Monitoring [J]. IEEE
Transactions on Industrial Electronics, 2014, 61 (11):6418-6428.
[13] Yin S, Li X, Gao H, et al. Data-Based Techniques Focused on Modern Industry: An Overview [J]. IEEE Transactions on Industrial Electronics, 2015, 62 (1):657-667.
[14] Yin S, Huang Z. Performance Monitoring for Vehicle Suspension System via Fuzzy Positivistic C-Means Clustering Based on Accelerometer Measurements [J]. IEEE/ASME Transactions on Mechatronics, 2015, 20 (5):2613-2620. [15] Yin S, Zhu X, Kaynak O. Improved PLS Focused on
Key-Performance-Indicator-Related Fault DiagnosiS [J]. IEEE Transactions on Industrial Electronics, 2015, 62 (3):1651-1658.
[16] Arriagada G, Sanchez J, Stryhn H, et al. A multivariable assessment of the spatio-temporal distribution of pyrethroids performance on the sea lice Caligus rogercresseyi, in Chile [J]. Spatial and Spatio-temporal Epidemiology, 2018.
[17] Wang Z, Han Y, Geng Z, et al. PID control loop performance assessment and diagnosis based on DEA-related MCDA [C]// International Symposium on Advanced Control of Industrial Processes. IEEE, 2017:535-540.
[18] Feng J, Turksoy K, Cinar A. Performance Assessment of Model-Based Artificial Pancreas Control SystemS [M]// Prediction Methods for Blood Glucose Concentration. Springer International Publishing, 2016:997-1000.
[19] Saha P. Performance Assessment of Control Loops: Theory and ApplicationS [C]// Springer-Verlag, 1999.
[20] Wu M L, Dong J D, Wang Y S. Identification of Seawater Quality by Multivariate Statistical Analysis in Xisha Islands, South China Sea [M]// Water Quality. 2017.