International Journal of Innovative Technology and Exploring Engineering (IJITEE) ISSN: 2278-3075,Volume-8 Issue-12, October 2019
Abstract: This paper describes an economic analysis of 80kW solar PV system connected to Grid. PV system solar energy is an important source to produce electricity now-a-days. 80kW solar PV system is designed by using MATLAB/Simulink Software and analysed the performance evaluation of this system with respect to MATLAB readings of 80kw system designed for on-grid and off-grid using HOMER software to compare the economic analysis of both systems. Compare these on-grid and off-grid systems using homer pro software to calculate the cost of energy (COE) and net present cost (NPC).These Results will help in an optimization techniques and further investigations in solar PV system.
Keywords : Economic analysis, PV array, MPPT,ON grid and OFF grid, homer.
I. INTRODUCTION
Solar energy is an important source of renewable energy. India has superior extent of generating solar energy. India receives solar radiation of 3000 hr of sunshine approximately during the year. This is equivalent to more than 5000 trillion kWh of power. Almost India receives 4–7 kWhr of solar radiation per sq.m 12.In India the output of solar energy received in a year exceeds the feasible energy output of all the fossil fuel reserves. The installed grid connected solar power capacity in India is increasing day by day and is 10 MW in 2010, 468.3 MW in 2011, 6762.85MW in 2016. And is expecting to a total of 100,000 MW by 20223.
PV generation systems have two challenges: the conversion efficiency is low for electric power generation system and another one is the solar array generated power is changes continuously with weather conditions 45.Grid is an interconnected network for delivering electricity from suppliers to end users. This system consists of generating stations, high-voltage transmission lines and distribution lines which are connected to the utility grid. It has the benefit of additional effective utilization of generated power 1. The main aim of this paper is to present results obtained from the performance evaluation of 80kW PV grid connected system designed by using MATLAB/Simulink and the same system designed using HOMER (Hybrid Optimization Model for Electric Renewable) Software to do the economic analysis. HOMER is developed at National Renewable Energy Laboratory (NREL) in the United States (USA) 6.
Revised Manuscript Received on October 1, 2019.
* Correspondence Author
Chandra sekhar*, Professor,Department of EEE, GMR Institute of Technology, Rajam, India, [email protected]
It is generally used for the design and analysis of solar PV system. In this paper, component details and costs are provided as input data to HOMER. The load distribution data also assumed of this 80kw system and estimated the economic analysis for both ON and OFF grid connected systems.
II. SYSTEMSTRUCTUREANDFORMULATION
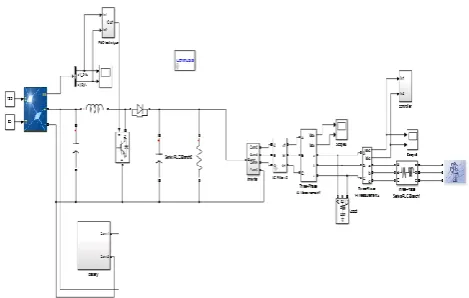
[image:1.595.313.548.399.548.2]HOMER software is used to design both on-grid and off-grid 80kW grid PV system models estimate and find out the cost of different models. This software required some input data to calculate the optimization results. The MATLAB/SIMULINK model of the proposed system is designed consisting of PV array, converter, Lead Acid battery, MPPT (maximum power point tracking) Technique, electrical load and utility grid is depicted in Figure 1.
Figure 1Simulation model of Grid tied PV system with battery backup using MATLAB
Figure 2Variation of current at different temperatures
Economic Analysis of 80kw Solar Pv System
with Grid and Without Grid by using Homer Pro
Software
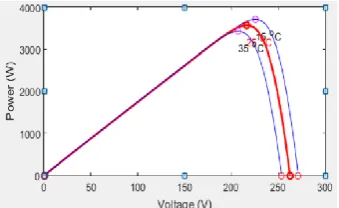
[image:1.595.316.535.589.721.2]Figure 3 Variation of power at different temperatures
[image:2.595.319.543.291.433.2]Figure 4 Variation of power at different irradiance
Figure 5 Variation of current at different irradiance
III. MATHEMATICALMODELINGINMATLAB
A. Photovoltaic array modeling:
A PV array can be defined as the group of several modules connected in series-parallel combinations to generate the required current and voltage 7. Using different input values of solar radiation and temperature to PV array output should be various is shown in Figure 2 to Figure 5 12.Solar radiation of 720w/m2and temperature of 25◦ C is the inputs to the solar array. In this system 51 strings are connected in parallel and 7 strings are connected in series to get an output PV array shows non-linear current and voltage characteristics 8 of PV array is given in equation 1.
1
S s
Ph o
sh
q V IR
V IR
I
I
I e
nKT
R
---(1)
Where Iph is the photocurrent, Io is the saturation current of
the diode, Rs is the series resistance, Rsh is the shunt
resistance, n is the diode ideality factor, k is Boltzmann‟s constant (1.4 × 10⁻²³), q is the electron charge (1.6 × 10⁻¹⁹), T is the absolute temperature in Kelvin.
B. MPPT technique
Solar radiation and temperature are changes continuously throughout the day with climate changing conditions. Under these conditions, the maximum power point of the PV array changes continuously and hence MPPT technique is used to maintain the PV array‟s operating point at its MPP9.The MPPT technique that generates the control signal which feeds the boost converter. Perturb and observe (P&O) technique is presented in this paper and is the most widely used technique to track the maximum power from the array. P&O technique operates by regularly Perturbing that is incrementing or decrementing the PV module terminal voltage or current and compares the output power of PV array with that of the preceding perturbation cycle10. If the PV array output power is changes due to its operating voltage changes, the control system moves the PV array operating point in that direction and or else the operating point is stimulated in the reverse direction. In the next perturbation cycle the algorithm continues in the same way. Structural flow chart is shown in Figure 6 1112.
P(i)-P(i-1)=0
V(i)=V(i)-A
Sense V,I
P(i) = V(i) * I(i) start
P(i)-P(i-1)>0
V(i)-V(i-1)>0 V(i)-V(i-1)>0
V(i)=V(i)+A V(i)=V(i)-A V(i)=V(i)+A
Return yes
no no
no no
yes
yes yes
Figure 6 .State-flow chart of P&O MPPT technique C. Inverter
The PV array interfacing to the utility grid with battery backup through a boost converter, DC-DC boost converter is used to step up the voltage and step-down the current at 50HZ frequency and also used here to a drive the load or charge a battery 7. Then the Boost converter is fed to the inverter. Three phase inverters are generally used for high power applications. In inverter design IGBT (insulated gate bipolar transistor) power switches are used to high voltage capability, fast switching compared to other switches and inverter controlling purpose hysteresis current controller is used. The main advantage of this controller is excellent dynamic performance and ability to control the peak to peak value of current ripple in desired hysteresis band limit. Then the inverter is fed to LC filter for reduce the voltage and current harmonics, after rectifying of these harmonics the three phase RLC load is connected across the system then it will produces 80kW supply tied to grid. The output wave form of this grid tied system shown in Figure 10
IV. PROPOSED MODEL IN HOMER
In this paper, HOMER software is used to design both on-grid and off-grid 80kW PV system models in Figure 7 and Figure 8
[image:2.595.82.259.357.478.2]International Journal of Innovative Technology and Exploring Engineering (IJITEE) ISSN: 2278-3075,Volume-8 Issue-12, October 2019
The main components required for this grid connected PV system are PV array, system converter, LA battery and advanced grid. In off grid connected system
only the grid is exception. For economic analysis, the following values are used.
A. PV array:
[image:3.595.304.550.84.269.2]Name: Generic Flat Plate PV, it is manufactured by Generic, and the component size consideration is important. Size of PV arrays are mainly depends on solar radiationavailability, load profile and the renewable fraction required. Efficiency of this array is 95% and lifetime about 15 years. Initial capital cost of PV arrays is assumed as 600000(₹)/kW and replacement cost 300000(₹)/kW operation and maintenance (O&M) cost 100000(₹)/kW.
Figure 7 PV system model (without grid connected).
Figure 8 . PV system model (with grid connected). Figure 7 consisting of PV array, battery, converter is in inverter mode and electrical load and Figure 8 consisting of same as off grid components only adding an advanced grid. Grid consumes power when excessive power is available. B. Battery:
It is a lead acid battery of capacity 20 kWh, Inthis system a battery is used during any fault occurring on the grid to maintain the supply is stable. Battery Capital cost is 1,016,325(₹) and replacement cost is 508,162.50(₹), operating and maintance (O&M) cost is 508,162.50(₹) and lifetime of this battery is 10years and these all costs are shown in Figure 9.
C. Converter:
In this paper converter is used only in inverter mode. Inverters generally used to do a conversion process. The unidirectional converter capital cost is 1000000(₹)/kW and replacement cost 500000(₹)/kW are assumed for a lifetime of 15 years. The operating and maintenance cost 100000(₹)/kW assumed. The inverter efficiency is assumed to be 95% and these all costs are shown in Figure 9.
D. Electrical grid:
It is an interconnecting network for delivering electricity from producers to consumers. In this paper the cost of electrical
energy is taken to be 2022.23kWh/yr for purchase and 11784.51kWh/yr for sale back to the grid 13.
Figure 9 All costs of present system V. LOAD DISTRIBUTION FOR 80KWSYSTEM
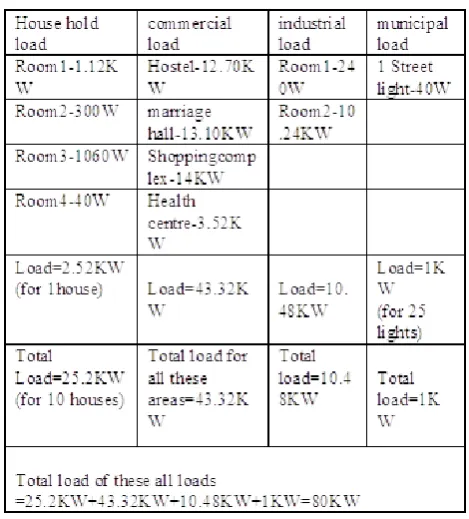
[image:3.595.59.273.228.341.2]The load distribution considered energy consumption by the proposed area. This distribution of load is assumed and the load can be divided in to four parts. The total load of 80kW is distributed to different loads such as house hold load25.2kW, commercial load 33.2kWand again the commercial load can be distributed into four areas these are hostel 12.70KW, marriage hall 13.10KW, shopping complex 14KW, health centre3.53KW; industrial load 10.48kWand municipal load 1kW.The detailed load distribution tabular form is shown in below in table 1.
Table.1. 80kW assumed load distribution table
VI. COSTANALYSISPROCEDUREINHOMER A. Net present cost (NPC):
[image:3.595.68.270.375.501.2] [image:3.595.311.546.433.693.2]rewarded over the lifetime of the project minus the total profits. Including sum costs these are investment costs, replacement costs, operation and maintenance (O&M) costs and electricity purchased. The following equation is used to calculate NPC of the system 6.
NPC
C
ann tot,CRF
Here Cann, tot is the total annualized cost and CRF is the capital
recovery factor, given by the following equation :
1 1
1 1
1
N N
i
CRF
i
Where „i‟ is the annual real interest rate and Nis the lifetime of the project.
B Cost of Energy (COE):
It is defined as the total cost of installing and operating a project expressed in rupees (₹)/kWh of electrical power generated by the system over its lifetime 1516.Then the average cost/kWh of useful electrical energy produced by the system. The COE is calculated as follows 6
, ,
prime Ac prime Dc
TAC
COE
L
L
Where, Lprime,AC is the AC primary load and Lprime,DC is the DC
primary load.
VII. RESULTSANDCONCLUSION A. Result in MATLAB:
[image:4.595.305.550.49.206.2]Output waveform of the 80kW system is shown in below Figure 10.It will gives 20kv of voltage and 4amps of current.
Figure 10 output wave of the 80kWgrid tied system in MATLAB software
B. Results in HOMER:
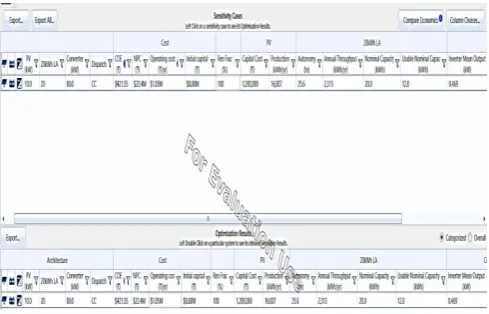
i)Without grid connected system results in HOMER: In this system, below output will gives the 80kw system total costs of sensivity and optimal cases in Figure 11.In graphical representation to take eight optimal points with respect to their PV dc capacity (10-80kW) and estimated the plots between cost of energy (COE) and net present cost (NPC)in Figure 12.
[image:4.595.305.550.236.359.2]Figure 11 Sensivity and optimization results in without grid connected system using HOMER software
Figure 12 plot between net present cost (NPC) and cost of energy (COE)
Figure 12 represents the cost curve between the total net present cost and cost of energy in off-grid connected system for eight optimal points with respect to their PV dc capacity, first optimal point 10kw of dc capacity system cost of energy is 421.55 in rupees(₹)/kwh and net present cost is 22400000in rupees (₹).
[image:4.595.53.287.480.623.2]International Journal of Innovative Technology and Exploring Engineering (IJITEE) ISSN: 2278-3075,Volume-8 Issue-12, October 2019
[image:5.595.206.532.49.303.2]Figure 13 Sensivity and optimization results in with grid connected system using HOMER software
[image:5.595.48.292.258.414.2]Figure 14 plot between plot between net present cost (NPC) and cost of energy (COE)
Figure 14 represents the net present cost and cost of energy in on-grid connected system for eight optimal points with respect to their PV dc capacity, for first optimal point 10kw of dc capacity system cost of energy is 106.34 in rupees (₹)/kWh and net present cost is 18800000 in rupees (₹).
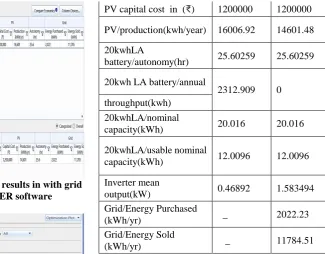
C. Comparison of economic analysis of both on-grid and off-grid system using HOMER software in below tabular forms:
The above cost analysis of 80kV PV system for on-grid and off-grid are presented in Table.2.All these components are 10kW PV dc capacity; converter for inverting mode capacity is 80kW, lead-acid battery capacity 20kWh, electrical load and grid.
Table.2.comapare on-grid and off-grid connected system costs.
Cost analysis of the system
Without grid connected system
With grid connected system Cost of energy(COE)in
(₹) 421.5518 106.3434
Net present cost(NPC)in
(₹) 22400000 18800000
Operating cost(OC)in (₹) 1045002 899427.5 Initial capital cost(ICC)in
(₹) 8876325 8816325
System/ Ren fraction (%) 100 87.27647
PV capital cost in (₹) 1200000 1200000 PV/production(kwh/year) 16006.92 14601.48 20kwhLA
battery/autonomy(hr) 25.60259 25.60259 20kwh LA battery/annual
2312.909 0 throughput(kwh)
20kwhLA/nominal
capacity(kWh) 20.016 20.016 20kwhLA/usable nominal
capacity(kWh) 12.0096 12.0096 Inverter mean
output(kW) 0.46892 1.583494 Grid/Energy Purchased
(kWh/yr) _ 2022.23
Grid/Energy Sold
(kWh/yr) _ 11784.51
VIII. CONCLUSION
In this paper 80kW solar PV grid connected PV system designed in MATLAB/Simulink has been presented and observes the performance evaluation of the system With respect to those MATLAB readings of 80kW system designed in HOMER software. This model is simulated in two scenarios such as on-grid-connected system and off-grid connected system. The economical savings of on-grid system is high compared to the off-grid system. In grid connected system design, COE (cost of energy) and NPC (net present cost) saves money is 305.2084 (₹)/kWh and 3585610 in rupees (₹) respectively.
REFERENCES
1. Bharathkumar, M., and H. V. Byregowda. "Performance Evaluation of 5 MW Grid Connected Solar Photovoltaic Power Plant Established in Karnataka." International Journal of Innovative Research in Science, Engineering and Technology3.6 (2014).
2. Nirwan, Deepansh, and Tilak Thakur. "Performance Evaluation of Grid Connected Solar PV Plant Using PVsyst." (2017).
3. Sreedevi, J., N. Ashwin, and M. Naini Raju. "A study on grid connected PV system." Power Systems Conference (NPSC), 2016 National. IEEE, 2016.
4. Paudel, Ananda Mani, and HűseyinSarper. "Economic analysis of a grid-connected commercial photovoltaic system at Colorado State University-Pueblo." Energy 52 (2013): 289-296.
5. Bharathkumar, M., and H. V. Byregowda. "Performance Evaluation of 5 MW Grid Connected Solar Photovoltaic Power Plant Established in Karnataka." International Journal of Innovative Research in Science, Engineering and Technology3.6 (2014).
6. Nurunnabi, Md, and N. K. Roy. "Grid connected hybrid power system design using HOMER." Advances in Electrical Engineering (ICAEE), 2015 International Conference on. IEEE, 2015.
7. Ahmad, Zameer, and S. N. Singh. "Modeling and Control of Grid Connected Photovoltaic System-A Review." International Journal of Emerging Technology and Advanced Engineering3.3 (2013): 2250-2459. 8. AbdelHady, Rameen. "Modeling and simulation of a micro
grid-connected solar PV system." Water Science 31.1 (2017): 1-10.
10. Lamnadi, M., et al. "comparative study of ic, p&o and flc method of mppt algorithm for grid connected pv module." Journal of Theoretical & Applied Information Technology 89.1 (2016).
11. Mamatha, Gangavarapu. "Perturb and observe MPPT algorithm implementation for PV applications." International Journal of Computer Science and Information Technologies6.2 (2015): 1884-1887.
12. Patil, Manoj, and Amruta Deshpande. "Design and simulation of perturb and observe maximum power point tracking using matlab/simulink." Industrial Instrumentation and Control (ICIC), 2015 International Conference on. IEEE, 2015.
13. Roy, B., A. K. Basu, and S. Paul. "Optimal design of a grid connected solar photovoltaic power system for a residential load." International Journal of Recent Advances in Engineering and Technology 1 (2013): 2347-2812.
14. Wayan G. Santika, Sudirman and I NyomanSuamir “feasibility analysis of grid/wind/pv hybrid systems for industrial application” Bali State Polytechnic, Bukit Jimbaran Campus, Bali, Indonesia VOL. 11, NO. 2, JANUARY 2016
15. Salleh, N. A. S., and W. M. W. Muda. "Techno-economic and sensitivity analysis for grid-connected renewable energy electric boat charging station in Terengganu." MATEC Web of Conferences. Vol. 90. EDP Sciences, 2017.
16. Pezo, Milada L., and Saša M. Stojković. "Technical and Economic Analysis of Grid-Connected PV/Wind Energy Stations in the Republic of Serbia Under Varying Climatic Conditions." FME Transactions 44 (2016): 71-82.
AUTHORSPROFILE