Abstract: To make the human beings life easy, the use of software is increasing at day by day. The users of the software expect the early delivery of the software, so the demand to decrease the delivery time of software is increasing day by day. As the demand for early delivery of software in increasing day by day, so guaranteeing the quality of software is becoming critical. While designing and building the software there may be some errors which are commonly known as software bugs. About one third of the total cost is due to the software bugs. So it advantageous to use some intelligent technique for software bugs detection. The data of the software bug is contained in the repository, called the software bug repository. As the bug repository contains the huge amount of data, different types of data mining techniques may be applied to extract the hidden information from the software bug repository. Software bugs are classified using data mining techniques on the basis of the different parameters like accuracy precision, recall and F-measures. Different types of bug classification techniques using data mining have been studied in this paper and the results compared.
Index Terms: Bug Tracking, Classification Algorithms, Data Mining, Software Bugs.
I. INTRODUCTION
Today in the massive amount of data is collected daily. The big problem with this large amount of data is in analyzing the data. This large volume of data is analyzed using the data mining. The process of analyzing the massive data volume for the purpose extracting the knowledge is known as data mining. The key characteristics of Data Mining are [20]:-
Automatically finding the patterns Predicting the expected results Formation of actionable information Attention on huge databases and data sets.
Data mining can also be called knowledge discovery (KDD). Knowledge Discovery in Data is the non-trivial process of recognizing new, potentially useful, valid and understandable patterns in data [1]. Knowledge Discovery or
Revised Manuscript Received on May 23, 2019.
Raj Kumar, PhD Research Scholar, Dept. of CSE, IK Gujral Punjab Technical University, Jalandhar, Punjab, India, Email: [email protected].
Dr. Sanjay Singla, Professor, Dept. of CSE, GGS College of Modern TechnologyKharar(Mohali), Punjab, India, Email: [email protected]
Dr. Raj Kumar Yadav, Associate Professor,Dept of Computer Sc, Indira Gandhi University, Meerpur, Rewari, Haryana, India, Email: [email protected]
Dr. Dharminder Kumar, Professor, Dept. of CSE, Guru Jambheshwar University of Science & Technology, Hisar, Haryana, Inida
Email: [email protected], [email protected]
data mining is required to sense and use the data. Iterative steps of KDD (Knowledge Discovery from Data) are described below [2]
1.
Data Cleaning (Inconsistent values are corrected, missing values filled with relevant value and noise is handled)2.
Data Integration ( After checking redundancy, data is combined from multiple heterogeneous data sources.)3.
Data Selection ( Data suitable for the mining task is selected )4.
Data Transformation ( Convert data into forms appropriate for mining )5.
Data Mining ( Essential process where patterns are extracted )6.
Pattern Evaluation ( Recognize the actually remarkable patterns ) [image:1.595.307.547.449.682.2]7.
Knowledge Representation (Knowledge Findings are presented using visualizations.)Figure 1.1: KDD Process [2]
Visualization, Deviation Detection, Summarization, Link Analysis, Estimation, Clustering, Classification and Association etc. are the main data mining tasks. There are different approaches and techniques used extracting the knowledge, which are also known as data mining models and algorithms. If we have data,
means there may be some hidden information. As we
An Experimental Analysis of Various Data
Mining Techniques for Software Bug
Classification
know that Data Mining techniques can be used to extract the hidden information from the great volume of data. Software bug repository contains the data about the various aspects of the software bugs. Data mining classification methods are also used to predict the software bugs.
II. SOFTWAREBUGS
In the today‟s modern life the usage of software is increasing at a remarkable rate. The demand to decrease the delivery time of the software is increasing day by day. So due to this ensuring the quality of the software becoming critical. Man is a puppet of mistakes. Some mistakes are not serious, but some of them are dangerous which cannot be avoided. So, different types of software testing techniques are used to guarantee the quality of the software [3]. Unintentionally a programmer may make error or mistake during the designing and building of software. These mistakes or errors show the existence of faults in the software. These are called defects [19].
During the testing of software, there will be defect if actual result deviates for the expected result. Deviation from specification mentioned in the functional documents is a defect. Different organization use different names for defect like issue, bug, problem or incident
When the software requirements or expectations of end user are not satisfied by the software application or product, it results into Defect or bug. These bugs or defects occur because of an error in coding or result, which may lead to unpredictable or failure results.
The large amount of software cost is due to the software bugs. The cost of bugs can be measured by when we find bugs and the impact of them. If the defect is found at the initial phase then the lesser will be the cost of defect. So, we can say that if the defect is found during the requirement specification then to some extent it is inexpensive to fix it. Then the requirement specification can be re-issued after the correction. In the same way when error or defect is found in the design phase, then the design can be corrected and it can be re-issued. But there may be the chance that the error is not found in any phase till the user acceptance; in that case cost to fix the defects will be too expensive.
Software testing is used with the intent of finding the software bugs. A software bug may be detected during the testing or during the operating use of the software. So to ensure the quality of the software, the bug should be detected and removed prior to any loss. The software developers must resolve how quickly bugs should be fixed, using priority [9]. There are five types of the priority levels: P1, P2, P3, P4 and P5 in Bugzilla. The highest level of priority id P1 and the bugs with the priority P1 should be fixed firstly with as quickly as possible.nOn the other side, P5 is the lower priority and bugs with P5 priority remained unfixed for the longer period [13]. Another relevant metric which can be used to identify the software bug is the bug severity. Software development team also keeps the track of the bug severity. The severity of a bug is defined as- impact of bug on the functionality of software [16].
III. DATAMININGCLASSIFICATON
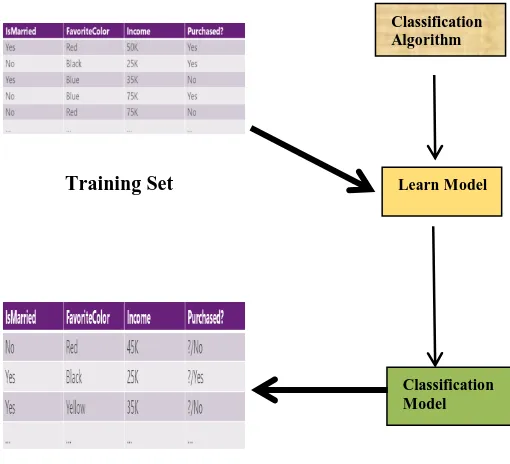
[image:2.595.307.562.304.536.2]Each data instance in a data set is classified into one of the predefined class using classification. The function of classification in data mining is to categorize the data items into classes. The aim of data mining classification is to correctly predict and assign the class label to the data item whose class label is not known. For example, classification model can be used to predict the credit card risk based on the previous data of the customers so that the care can be taken in future while issuing the credit card to the customers. Classification can be either binary classification of the multiclass classification. In the binary classification, the attributes of the target class has only two possible values: eg. Error or No-Error. On the other hand in the multiclass classification, the attribute of the target class have more than two values: eg blocker, critical, major, minor, normal or trivial. Below figure illustrate the data mining classification for you.
Figure 3.1: Classification Process
Classification is a two-step process:
Step1: The classification model is constructed on the basis of predefined set of data. In the step1 the training data set is used for the construction of model. Learning on the basis of predefined set of data is also known as supervised learning. Step2: In this step the model is used to classify the future unknown items. In this set the test data set is used to classify the future unknown items. Learning to classify the unknown data is also known as the unsupervised learning.
The common approaches used for data mining classification are Bayesian classification, rule based classification, Decision Tree Induction, kNN, SVM and neural network.
3.1 Decision Tree Induction:
A very simple method used for data mining is the decision tree method. In this
Training Set
Test Set
Classification Algorithm
LearnModel
Classification Model
Training Set
Test Set
Classification Algorithm
LearnModel
Classification Model
Training Set
Test Set
Classification Algorithm
LearnModel
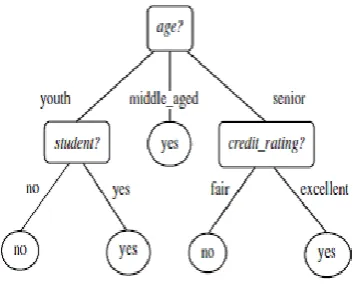
method with the aim to predict the value of target variable on the bases of many input variables, model is created. In this method each intermediate node represents a test on an attribute and every branch of the tree is an output corresponding to the test. For constructing the decision trees the domain knowledge for constraints setting is not required. Decision tree is appropriate for the exploratory knowledge discovery. The leaf node of the decision tree represents the class label [2]. Following diagram (Figure 3.2) illustrate the decision tree.
Figure. 3.2: Decision Tree
Decision tree in the above diagram shows the concept, how likely a customer buys a laptop from an electronic shop. Every non-leaf node used for representing a test on attribute vale. The leaf node donates the class. There are two classes „yes‟ or „no‟. C4.5, ID3 and CART are the different type of decision tree algorithms. Greedy approach is used for constructing decision trees in these algorithms.
3.2 Naïve Bayesian Classifications:
This algorithm based on the Bayes‟ theorem. . Bayesian is commonly known as Bayes Classifier. In this algorithm concept of probability is used to classify the data items. It is primarily used for text classification. In the classification problem there are number of attributes and classes say, C1, C2, ………., CK. In this algorithm attribute values (a1,a2, ……. an) describe every instance say x and from the set of values V, any value can be taken by the target function f(x). The Bayesian Classifier obtain the greatest probable value of the target function with the aim to classify the ne coming instance. For the set of attribute values (a1,a2, ……. an), Vmap is described as:
Using the Bayes formula, it is described as
On the bases of the occurrence of every target value vj found in training data, each P(vj) can be estimated easily. After this estimation of two data item is needed. But it is not easy to estimate P(a1,a2,…an| vj) until and unless the training
data sets are large. The numbers of these items which are equal to the possible instances are multiplied by the total quantity of possible target value. The Naïve Bayes created a hypothesis and describe that for a specified target value of an occurrence, the combined probability is described as:
Then using the Bayes Classifier the target value VNB is obtained as
The Naïve Bayes used for rapid classification because in this classification method is based on the frequency occurrence of different combination in the training data and assumption space is not searched [10].
3.3 Rule Based Classification:
To classify the data using Rule Based Classifier, for class prediction If-then rules are used. Data items can be classified in different classes using rule based classifier. General form of If-Then rule is
IF condition THEN decision.
If part is termed as precondition as the data is stated and the right hand side i.e. then part is the rule consequent (represents the class label). The main advantage of the rule based classifier is that the attributes can be used for classification without any transformation [2].
Example:
Rule1:
IF parent_class='A' AND sex='F' THEN stay_alive =true Rule2:
IF parent_class='B' AND sex='F' THEN stay_alive =true Rule3:
IF parent_class='C' AND sex='F' THEN stay_alive=false Rule4:
IF parent_class='D AND sex='F' THEN stay_alive =false
3.4 Support Vector Machine(SVM):
SVM is a classification algorithm which draws a single boundary to maximize margin between negative and positive data items. SVM is a supervised machine learning algorithm. Support vector machine is a classifier that is capable of classifying both the nonlinear and linear data. In SVM, the hyperplane is used for the separation of two classes. Support vectors are used to find the hyperplane. Support vectors are the vectors used to define the hyperplane. Then using these support vectors, margin is defined.
Figure 3.3: Linearly separable training data
In the SVM algorithm maximum margin hyperplane is searched during the training phase so that the data tuples can be classified by both the hyperplanes accurately [2]. Hyperplane for sepration is represented by
W.P +C = 0 Where W is the weight vector and C is scalar
3.5 k-Nearest Neighbor Algorithm:
Decision Tree, Rule Based Classifier, Naïve Bayesian and SVM Classifiers are the eager learners, because in these approaches using the training data, classification model is constructed before the receiving new data items to classify. However in the lazy learner approach, before constructing the classification model the learner wait until the last minute. In the lazy learner approach the data items is stored until it is given to the test tuple. As the storage space is required in the lazy Lerner, so classification using lazy learner is expensive. k-NN is a lazy learner algorithm. In this algorithm the test tuple is compared with the training tuples having the same properties for the purpose of classification. In an n- dimensional space, a point is used to represent a tuple. An n-dimensional space is required to store all the training tuples. In order to classify an unknown tuple the k training tuples are searched in the pattern space. The distance metric is used to find the closeness among the tuples [2].
Manhattan, Euclidean squared, Euclidean; Pearson
Correlation are the some distance metrics which are used to fine the distance between the data points.
3.6 Classification by Neural Network:
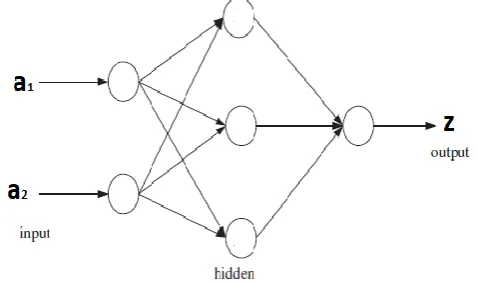
[image:4.595.74.278.55.160.2]A neural network is an interconnected set of input and output units. Every connection is the neural network assigned a weight. To be able to predict the accurate class label of the input instances, during the learning phase, the network learns how to alter the weight [2]. In the neural network the artificial neurons are interconnected with each other. On the bases of connectionist methodology information processing is done using a computational or mathematical model One of the most popular neural networks is the multi-layer feed forward neural network. The multilayer feed-forward neural network consists of three layers. The input layer: used to receive the information, output layer: provide the response for a particular input value set and the intermediate layer (one or more): contains the hidden neurons. In a given layer, each neuron is assigned a weight (wij) for connecting to neurons of the following layer [11]. A three layer feed- forward neural network is shown in the below figure.
Figure 3.4: A three-layer feed-forward neural network
Neural Network is trained using the back propagation. The connection weights of the ANN used to store the information, so weights acts as the memory of the neural network systems. For minimizing the mean square error b/w predicted value and the actual value of target variable, the weights are iteratively altered for every training tuple. All these modification in the weights are done in the backward direction [2].
3.7 Classification by Genetic Algorithm:
The concept of stochastic search is used in GAs, in which using the philosophies of natural evolutionary and genetic principle, complicated and large space can be searched easily. Initially the rules are created randomly, which creates the initial population. The string of bits are used to represent each rule. For example, suppose that the given training data defined by two Boolean attributes X1 and X2 and let there are two classes CLASS1 and CLASS2. Then for the rule: “IF NOT X1 AND X2 THEN CLASS1”, bit sting “010”, the attributes X1 and X2 are represented by the first and second leftmost bits respectively and class is represented by the rightmost bit. So k- bits used for the representation of the bit string of the attribute having k values. Initialization, selection, crossover and mutation are the four stages for search process using GAs. In the first stage (i.e Initialization) randomly distributed chromosomes are selected to initiate the search. Then the fitness function is executed for every chromosome. Like in the natural genetic phenomena, the commendable characteristics are propagated from generation to generation by the high scoring members, the chromosomes with great performance may be chosen during the second stage of selection. During the crossover the offspring is formed from the randomly selection of good parents. The corresponding string segments of the parents are swapped during the crossover process. A member of population is randomly chosen in mutation stage and one bit of its bit string is randomly chosen [2, 11].
IV. SOFTWAREBUGCLASSIFICATIONUSING DATAMINING
Understating constant evolving of the software system is very difficult task. The history of evolution of software system is maintained in the
software repository [8]. There are different types of software repositories e.g. Runtime Repositories, Historical Repositories, Code Repositories. Data mining is applied for the analysis of software repositories to determine significant and motivating information hidden in these repositories. Any software repository can be mined not necessarily the code, bug or achieved communication repository [14]. Data mining approaches and machine learning algorithms are beneficial to predict software bug estimation [12].
First of all Cubranic Davor and Murphy Gail C.[4]proposed supervised machine learning technique to predict the developer to whom the bug should be assigned. The proposed approach was applied on bug reports of source project, Eclipse.org. Naive Bayesian algorithm is used for bug classification and 30% classification accuracy achieved. Anvik John et al. [5] further exposed automatic bug triage using machine learning. Support Vector Machine (SVM), Naive Byes and C4.5 algorithms was used. Using these algorithm precision levels of 57% achieved on Eclips development project and on the Firefox development project precision level of 64% achieved. Then, Anvik John Karsten [6] introduced a triage-assisting recommender that can different type of recommender for a range of projects. The proposed recommenders have the precision of 70% to 98% and recall of 72% to 92%.
Proceeding further Menzies et al. [7] offered a new approach SEVERIS(SEVERity ISsue assesment) for assigning the different levels of severity to bug reports. . Then Lamkanfi Ahmed et al. [9] predicted and verified the severity of bug with the text mining. Mining algorithms are applied on the three open source repository (Mozilla, Eclipse and GNOME). It is observed that to predict the severity precision and recall vary from 65% to 85% with Mozilla and Eclipse, and 70% to 85% in case of GNOME.. Chaturvedi K. K. and Singh V. B. [13] presented a method for the classification of the bugs based on the severity. Machine learning techniques applied to determine the class of bug severity. Navie Bayes, kNN, Naïve Bayes Multinomial, SVM, RIPPER and J48 are different supervised machine learning algorithms used for the classification of bugs on the bases of severity. To assign the bugs to the proper developer on the bases of bug summary the bugs classified into different classes Neelofar et al. [14], using Multinomial Naive Bayes text classifier maximum of 86% accuracy was obtained. Then specify the severity Sharma Gitika et al. [16] offer a method to classify bugs into two classes(Sever and Non-Sever bugs).
Navie Bayse Multinomial(NBM) and K-nearest
neighbor(KNN) algorithms were used for the classification of the bugs. Proceeding further Jain Swati and Wilson Swapna Rose[17] worked on reducing the complexity of the classifier. Macro Ortu et al. [18] used the priority to classify the bugs and bugs classified into low and high priority classes. Number of authors worked in the field of bug classification using the data mining. The comparative results of different authors‟ are shown in the figure 4.1 and figure 4.2.
4.1 Classification Results of different Author’s
4.2 Accuracy Comparison of different Authosr’s
V. CONCLUSION
Wherever data is available the data mining techniques can be applied to extract the hidden knowledge. In this paper various data mining techniques used for the bug classification have been studied. Various researchers contribute in the field of bug classification using data mining. KNN, SVM, NBM algorithms used by different researcher to classify the bugs on the bases of severity and priority. The metrics used for the classification almost by the entire researcher in Accuracy and precision; highest accuracy of 89% for the severity is achieved using KNN and NBM algorithms. So work can be done to find the more efficient solution.
Author
Algorith m/ Approach
Priority/S everity /developer
Acc ura cy
Pre cisi on
Recall
Cubranic Davor et.al[4]
Navie
Bayes Severity 30
Neelofar et.al[14]
Navie
Bayes Severity 86
Anvik John et al. [5]
SVM, Navie Bayes,
C4.5 Severity 80 57 43
Lamkanfi Ahmed et al. [9]
Navie
Bayes Severity 85 85 15
Gitika Sharma et al,[16]
NBM and
KNN Severity 89 89 11
Jain Swati
et al. [17] NBM Developer 90
[15] Tian Yuan
et.al[15] SVM Priority 80
29.
REFERENCES
1. Fayyad, Piatetsky-Shapiro, Smyth, and Uthurusamy, “Advances in Knowledge Discovery and Data Mining”, (Chapter 1), AAAI/MIT Press,
1996.
2. Jiawei Han and Micheline Kamber. Data Mining Concepts and Techniques ,second edition
3. Beizer, Boris. Software testing techniques, Second Edition, Dreamtech Press, 2003
4. Cubranic Davour and Murphy Gail C., “Automatic bug triage using text categorization”, In Proceedings of the Sixteenth International Conference on Software Engineering & Knowledge Engineering; 2004, pp 1-6. 5. Anvik John, Hiew Lyndon, and Murphy Gail C., “Who should fix this
bug?” , In Proceedings of the 28th international conference on Software engineering,. ACM ;2006. pp. 361-370
6. Anvik John Karsten, “Assisting bug report triage through recommendation”, PhD diss., University of British Columbia, 2007. 7. Menzies Tim, and Marcus Andrian, “Automated severity assessment of
software defect reports”, In Software Maintenance-2008. ICSM 2008. IEEE International Conference on, IEEE, 2008, pp. 346-355. 8. Hassan A.E., “The Road Ahead for Mining Software Repositories”, IEEE
Computer Society, 2008, pp. 48-57
9. Lamkanfi Ahmed, Demeyer Serge, Giger Emanuel, and Goethals Bart, “Predicting the severity of a reported bug”, In Mining Software Repositories (MSR) - 2010 7th IEEE Working Conference, IEEE, 2010, , pp.1-10
10. Fangming Guo and Hua Song, “2nd International Conference on Computer Engineering and Technology IEE Xplore”, 2010, pp. V1-409 - V1-412.
11. H. Hasan Örkcü and Hasan Bal, “Comparing performances of backpropagation and genetic algorithms in the data classification”, Expert Systems with Applications, Volume 38, Issue 4, April 2011, pp. 3703-3709
12. Naheed Azeem, Shazia Usmani, “Analysis of Data Mining Based Software Defect Prediction Techniques”, Global Journal of Computer Science and Technology, Volume 11 Issue 16 Version 1.0, September 2011, pp. 1
13. Chaturvedi K. K., and Singh V. B., “Determining bug severity using machine learning techniques”, In Software Engineering (CONSEG)-2012 CSI Sixth International Conference, IEEE, 2012, pp. 1-6
14. Neelofar, Javed Muhammad Younus, and Mohsin Hufsa, “An Automated Approach for Software Bug Classification”, Sixth International Conference on Complex, Intelligent and Software Intensive Systems (CISIS- 2012), IEEE Xplore, 2012. pp. 414-419
15. Tian Yuan, Lo Daniel, and Sun Chengnian, “Drone: Predicting priority of reported bugs by multi-factor analysis” 29th IEEE International
conference on Software Maintenance (ICSM-2013), 2013, pp. 200-209 16. Gitika Sharma, Sharma Sumit, Gujral Shruti, “A Novel Way of Assessing Software Bug Severity Using Dictionary of Critical Terms”, 4th International Conference on Eco-friendly Computing and Communication Systems, ICECCS, Procedia Computer Science 70, 2015, pp. 632-639,
17. Jain Swati and Wilson Swapna Rose, “Automated Bug Assortment System in Datasets”, International Conference on Innovative computing technologies(ICICT), IEEE Conference, Vol. 2, 2016, , pp. 1-7 18. Macro Ortu, Destefanis Giuseppe, Swift Stephent and Marchesi Michele,
“Measuring High and Low Priority Defects on Traditional and Mobile Open Source Software”, 7th International Workshop on Emerging Trends
in Software Metrics, IEEE/ACM, 2017, pp. 1-7
19. http://istqbexamcertification.com/what-is-defect-or-bugs-or-faults-in-soft ware-testing/
20. https://uwsdatamining.wordpress.com/introduction/
AUTHORSPROFILE
Raj Kumar is a PhD Research Scholar at Dept. of CSE, IK Gujral Punjab Technial University, Jalandhar(Punjab), India. He received his M.Tech degree in Computer Sc. & Engineering from Choudhary Devi Lal University, Sirsa(Haryana), Inida in 2007. He obtained his M.Sc. and MCA degree from Kurukshetra University, Kurukshetra, India. He completed his graduation from Kurukshetra University Kurukshetra.
His area of interest includes Data Mining and Machine Learning. He has more than 20 referred journal papers in his credit. He has 12 years of teaching experience. Currently is he is working as Assitant Professor(CSE) at Chandigarh University, Gharuan(Mohali), India.
Dr Sanjay Singla completed Ph.D. from Mahrishi Dayanad University, Rohtak and currently working as Professor and Dean at GGS College of Modern Technology, Punjab. His main research work focuses on Vanets, Network Security, Cloud Security and Privacy, Data Mining and IoT. He has more than 15 years of teaching experience.
Dr. Raj Kumar Yadav is working as Associate Professor(CSE) at Inidira Gandhi University, Meerpur, Rewari, Haryana, India. He had published many research papers in reputed journals. His research area includes Software Engineering, Data Mining and Machine learning. He have more than 15 years of teaching experience.
![Figure 1.1: KDD Process [2] Visualization, Deviation Detection, Summarization, Link](https://thumb-us.123doks.com/thumbv2/123dok_us/8196745.259595/1.595.307.547.449.682/figure-kdd-process-visualization-deviation-detection-summarization-link.webp)