Abstract: A data logger is an electronic device that records data over time or in relation to location either with a built in instrument or sensor. In the paper, a data logger is designed and developed using STM32F407 DISCOVERY Board. An code is developed and tested using STM32CUBE and Atollic True Studio softwares in the proposed work. GSM Module SIM900EI is interfaced with microcontroller to send voltage output values of all the sensors interfaced with it for cloud computation in the paper. The paper also demonstrate hardware implementation of the designed data logger. The proposed data logger can be used in the Automatic Weather Stations (AWS).
Index Terms:
I. INTRODUCTION
An Automatic Weather Station (AWS) is an automated version of the traditional weather station to reduce the human efforts and to measure from remote areas where human reach is impossible. An AWS consists of a weather-proof enclosure containing the data logger, rechargeable battery, telemetry and the meteorological sensors with an attached solar panel or wind turbine and mounted upon a mast. Nowadays, the solar panel, wind turbine and mobile phone technology have made it possible to have wireless stations that are not connected to the electrical grid or hard line telecommunications network. The majority of the sensing instruments are connected to an electronic data acquisition system [3] . Data loggers are sometimes used as the acquisition equipment of the system and these are considered as a part of an AWS. The sensors used are-Wind Sensor, Solar Radiation Sensor, Soil Moisture Sensor, Temperature Sensor etc. A data logger is an electronic device that records data over time or in relation to location either with a built in instrument or sensor. A microcontroller is used to perform all the desired functions in the data logger. The 16 sensors are interfaced with the microcontroller at a time. These sensors are-temperature , humidity ,rainfall ,wind ,solar etc sensors .Further ,these values are sent through USART to the terminal of the software. The outputs from 16 channels are written to the EEPROM and cloud simultaneously[4] . The firm works on designing and testing of the data loggers used in Automatic Weather Stations. The data loggers used earlier were operating on arduino. The sensors interfaced to these data loggers had resolution of 10 bit and moreover only 4 to 8 channels of Analog-to-Digital Converter (ADC) could be
Revised Manuscript Received on August 05, 2019.
Gazal, Student, Department of Electrical and Instrumentation
Engineering,
Thapar Institute of Engineering and Technology, Patiala-147001, Punjab, India
Sangeeta Kamboj, Assistant Professor, Department of Electrical and
Instrumentation Engineering,
Thapar Institute of Engineering and Technology, Patiala-147001, Punjab, India
used at a time with arduino[5]. The aim of the proposed work is to design and test the data logger which will have resolution of 12 bits and 16 channels of ADC. So the microcontroller chosen was STM32F407DISCOVERY Board. An ADC is a peripheral that allows measuring the voltage (between 0 and Vref) on a certain input of the microcontroller and converting it into a number between 0 and 2N-1 where N is the ADC resolution.
II. METHODOLOGY
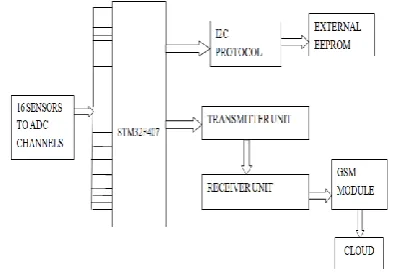
[image:1.595.328.526.495.633.2]The designing of Multichannel data logger includes microcontroller STM32F407,GSM module, EEPROM IC-24c02, potentiometer, USART and a motherboard. The code is uploaded via softwares –STM32Cube and Atollic Truestudio on the microcontroller. The transmitter pin of the microcontroller is connected to the receiver pin of the GSM module and the transmitter pin of the GSM module is connected to the receiver pin of the USART for serial communication. As soon as the microcontroller is powered up, the code is uploaded on the microcontroller and it reads the analog value of the potentiometer or the sensor and sends the value to the cloud and value is uploaded on the cloud via GSM module and the result is displayed on the computer screen via USART module. The external memory is interfaced with the microcontroller via I2C protocol to store sampling time. The basic block diagram involved in designing of data logger is shown in figure1.
Figure 1 Block Diagram of Data Logger
The steps used to design the proposed system is given as:
A) CONFIGURING DIGITAL I/O PINS OF STM32F407DISCOVERY Board
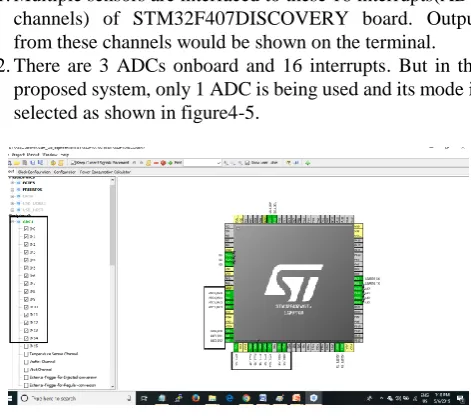
1. Specific Board has chosen ie.STM32F407DISCOVERY as shown in figure 2.
2.16 Interrupts has enabled under ADC1,that correspond to interfacing of 16 sensors to microcontroller simultaneously as shown in figure 3.
Designing and Implementation of Free RTOS
Multichannel Data Logger using Microcontroller
3. Select Baud rate to 152000.
Figure 2 SELECTING TYPE OF BOARD IN CUBEMX B) CONFIGURATION OF INTERRUPTS
1. Multiple sensors are interfaced to these 16 interrupts(ADC channels) of STM32F407DISCOVERY board. Output from these channels would be shown on the terminal. 2. There are 3 ADCs onboard and 16 interrupts. But in the
[image:2.595.49.285.247.457.2]proposed system, only 1 ADC is being used and its mode is selected as shown in figure4-5.
Figure 3 16 INTERRUPTS ENABLED IN CUBEMX
Figure 4 16 CONFIGURATION OF INTERRUPTS OF ADC
Figure 5 SELECTING MODE OF ADC
C) CONFIGURING 3 USARTS
1. USARTS –USART3,USART6,USART5 has been enabled because these 3 can work simultaneously.
2. USART3 is used for transmitting 16 sensors voltage output values to the terminal.
3. USART6 has been enabled as shown in figure6.
4. Baud rate has been set to 115200 bits/s as shown in figure7. USART6: it is used for displaying values on terminal written and read from EEPROM 24c02
USART 5: it is used for sending data to the cloud via GSM module SIM7600IE.
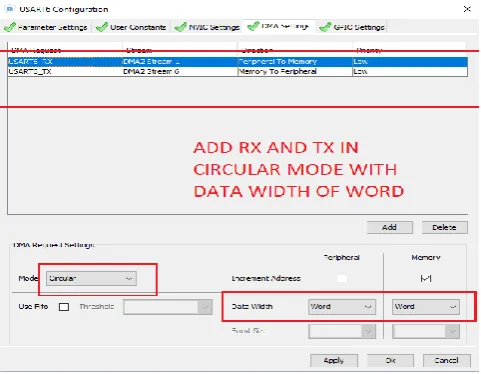
[image:2.595.308.546.301.657.2]FT232 (USART) is a source of serial communication between the microcontroller and the computer. The TX(Transmitter) pin of microcontroller is connected to the RX(Receiver) pin of FT232 and vice versa as shown in figure8. Microcontroller is connected to the computer via USB cable and the FT232 is inserted into the computer for the supply of 5V through the jack. The transmitter and receiver pins of microcontroller are decided by the software CubeMX,as soon as the particular USART is enabled in CubeMX , the two pins get active-TX (Transmitter)and RX(Receiver) pins.
Figure 6 USART6 ENABLED IN CUBEMX
Figure 8 SETTING MODE OF TX AND RX OF USART D) GSM MODULE SIM7600E1 INTERFACING FOR SENDING DATA TO Company’s (Advanced Tech India)CLOUD
1.The aim is to send sensors output to cloud and further to mobile app.
2. The TX(Transmitter) pin (PC-6) of microcontroller is connected to RX (Receiver) pin of GSM module , and TX of GSM is connected to RX of the FT232 as shown in figure 9. 3. AT commands are transmitted through USART used to send data to cloud of 16 sensors interfaced to 16 channels/interrupts of the microcontroller.
A GSM module is used for interfacing with microcontroller to send voltage output values of all the sensors interfaced with the microcontroller to the cloud. These values are sent by the TX Pin(PC6) of microcontroller to the GSM’s RX pin along with the AT commands. The cloud link contains the values. the AT commands are sent through the microcontroller to the GSM and values are uploaded on the cloud. Figure 7 shows all the AT commands sent to the GSM Module. The response of these AT commands ensure the connection with the GSM network, whether the data is successfully sent to cloud or not.
Figure9 GSM MODULE SIM7600EI INTERFACED WITH STM32F407
E) EEPROM INTERFACING
1.The aim was to send data to the memory of EEPROM, that could be saved permanently. EEPROM IC used is 24c02.
2. I2C1 was enabled in CubeMX as shown in figure10 and 2 pins were active –SDA and SCL(data and clock ),these 2 pins of microcontroller were connected to the EEPROM’s SDA and SCL pins, and in Atollic TrueStudio corresponding coding was done to write data to the EEPROM.
3. Three push buttons were enabled and Four LEDs were enabled as shown in figure11.
Figure10 EEPROM interfacing
C
op
y
ri
g
h
t
2
0
1
3
-2014
Thursday, May 9, 2019 TIET, PATIALA 20
Figure11 ENABLING PUSH BUTTONS AND LED
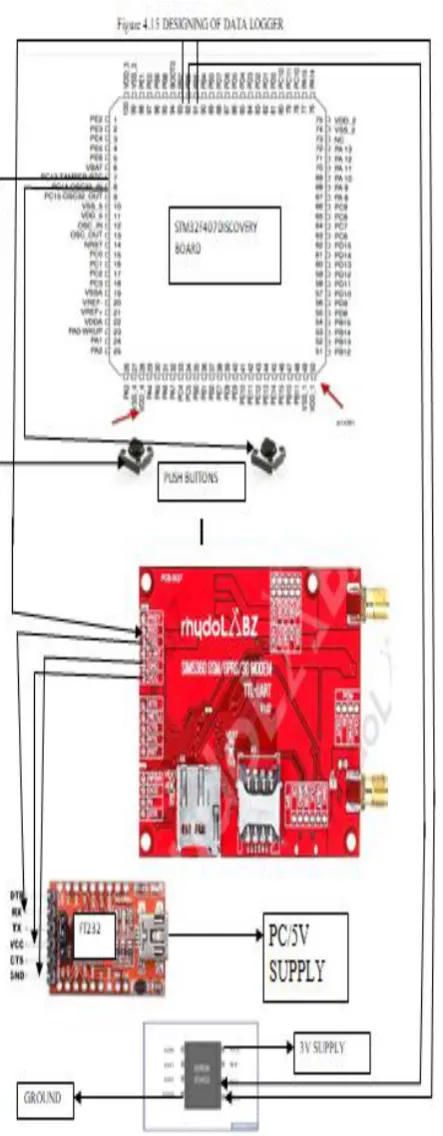
III DESIGNINGOFDATALOGGER
Figure 12. DESIGNING OF THE DATA LOGGER A. FLOWCHART
A flow chart of the data logger, which consists of three separate modules for data collection, data storage and data communication is shown in figure13.The analog voltage input form sensors is taken by the ADC channels which are as external General purpose pins on board, serially transmitted via USART and sent to cloud storage using GSM module in real time.
Figure13. FLOWCHART OF THE PROJECT
IV HARDWAREIMPLEMENTATIONRESULTS A) VOLTAGE OUTPUT FROM 16 SENSORS WERE SHOWN UP ON THE TERMINAL
The ADC voltage output values are transmitted and printed on the terminal of Atollic Truestudio Software, after debugging and uploading the code in microcontroller and the result is shown up on terminal as can be seen in figure14.
C
op
y
ri
g
h
t
2
0
1
3
-2014
[image:4.595.323.498.51.408.2]Thursday, May 9, 2019 TIET, PATIALA 21
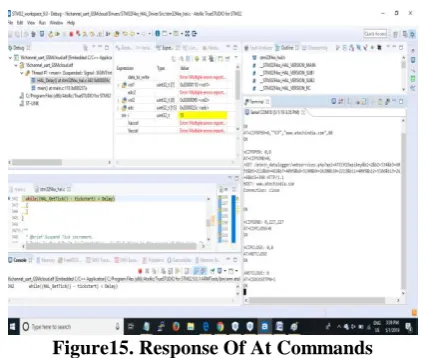
B)Response Of At Commands Given By Gsm Module Sim7600
AT commands are sent to GSM module USART FT232.GSM connects to the network and accordingly send the responses via USART. The figure 15 depicts the response on the terminal .
Figure15. Response Of At Commands
C) CLOUD Computation
[image:5.595.62.275.122.301.2]The cloud has been provided by the company. The ADC values are uploaded on the cloud in the real time as shown in figure 16.
Figure 16. Data Uploaded On Cloud
VI CONCLUSIONS
The designing and implementation of data logger using STM32F407 DISCOVERY Board has been successfully done in the paper. STM32CUBE and Atollic True Studio softwares has been used for developing and testing the code on microcontroller. Microcontroller has been sent the sensors output voltage interfaced with it for cloud computation after interfacing with GSM Module SIM900EI in the proposed experimental work. The ADC values has been uploaded on the cloud provided by the Advance Tech India Pvt. Ltd in the real time in the proposed work so that anyone can access output of data logger anywhere around the world. It can be concluded that proposed data loggers can be used to transmit digitized data at regular intervals to cloud storage without significant problems and minimum maintenance. Due to the modular nature of the system, it is very easy to customise the device according to the diverse requirements of the user.
ACKNOWLEDGMENT
We would like to express our sincere gratitude to Er. Balwinder Singh, Senior Embedded Software Engineer, R&D Department, AdvanceTech India Pvt. Ltd., Zirakpur for providing an opportunity and resources to carry out the work.
REFERENCES
1. Roberson P. "Using data loggers ", Science Teachers' workshop 2004,
north Sydney.
2. Huang Jian “Research of Serial Communication Based on STM32”,
2016.
3. Luharuka R. et al. “A microcontroller-based portable GSR data logger
for physiological sensing”, proceedings of conference department of Mechanical and Industrial Engineering, University of Massachusetts, Amherst.
4. LiuYing M.J.S.R.D.L, “Design of USB Multi-channel and Humidity
Acquisition System Based on Wireless Communication” ICEMI’2009.
5. Perez S. J. et al. “A microcontroller based data logging System”
Instrumentation and Development Vol. 3(8), copyright 1997, Journal of the Mexican Society of Instrumentation.
AUTHORS PROFILE
Gazal is a B.E. student of Electronics (Instrumentation
& Control) engineering (2015-19) batch at Thapar Institute of Engineering & Technology (Deemed to be University), Patiala, Punjab. She has received Certificate of Merit from C.B.S.E for obtaining 10.0 C.G.P.A in class 10th examination.
Dr. Sangeeta Kamboj is currently Assistant
Professor and ISO Coordinator in the Electrical and Instrumentation Engineering Department, Thapar Institute of Engineering and Technology (Deemed to be University), Patiala, Punjab. Dr. Kamboj obtained her Ph.D. from NIT, Kurukshetra, Haryana on Application of Signal Processing in Power System in 2014. Dr. Kamboj has about sixteen years of teaching experience.Her current area of research interest includes Signal Processing, Electronic Circuits & Devices, Communication and Control in Power system. She is member of professional societies such as IETE, IAENG
and MSI.She has published papers in reputed international journals on her