Pupil Adult Ratio Differences
and Educational Progress over
Reception and Key Stage 1
Peter Blatchford, Clare Martin, Viv Moriarty, Paul Bassett and
Harvey Goldstein
Institute of Education
University of London
Research Report RR335
Research Report No 335
Pupil Adult Ratio Differences and
Educational Progress over
Reception and Key Stage 1
Peter Blatchford, Clare Martin, Viv Moriarty, Paul Bassett and Harvey Goldstein
Institute of Education,
University of London
The views expressed in this report are the authors' and do not necessarily reflect those of the Department for Education and Skills.
© Queen’s Printer 2002. Published with the permission of DfES on behalf of the Controller of Her Majesty's Stationery Office. Applications for reproduction should be made in writing to The Crown Copyright Unit, Her Majesty's Stationery Office, St Clements House, 2-16 Colegate, Norwich NR3 1BQ.
3
Executive Summary : Pupil Adult Ratio Differences and Educational Progress over Reception and Key Stage 1
Peter Blatchford, Clare Martin, Viv Moriarty, Paul Bassett and Harvey Goldstein.
Institute of Education, University of London
Introduction and Background
There has been little research that analyses the work that Teaching Assistants (TAs) and other adults do in primary schools, and still less that examines in a systematic way associations between classroom support and teaching and curriculum coverage in the class, and effects on pupils’ educational progress.
The Institute of Education Pupil Adult Ratios study was built on parallel research at the Institute of Education on class size differences. Overall, it was designed to help resolve a number of questions about the educational effects of class size differences and pupil adult ratios at Key Stage 1 (KS1).
The research was designed to provide guidance to policy makers; second, to provide guidance to practitioners and others directly involved in education on the classroom implications of pupil adult ratios, the deployment of TAs, and class size differences; and third, to contribute to research on class size effects and pupil adult ratios, which would be of interest to researchers working in the UK and other countries.
This component of the research project addressed three aspects connected to TAs in KS1 classrooms: first, descriptive information on numbers and types of classroom support (e.g. paid staff, parents and volunteers) in classes and how these related to class sizes; second, whether there were measurable effects of the presence of classroom support on children's educational progress; and, third, whether the presence of classroom support affected a number of 'classroom processes' such as the amount of time spent on teaching, in different curriculum areas, and hearing children read, as well as teacher self perceptions such as stress and enthusiasm.
Research Approach
4
or observation designs, that is, research which seeks to model effects of naturally occurring differences in class sizes and pupil teacher ratios, without intervention or control, can be more valid and more useful for policy recommendations (see Goldstein & Blatchford, 1998). Such research, however, will need to overcome limitations of previous research. The study therefore had the following features: it was longitudinal, with baseline measures, and follow-up of the same pupils, over several or more years. It made use of reliable measures of class size, extra staff and adults, and educational outcomes, and it made use of sophisticated statistical techniques, such as multilevel modeling (MLM), able to capture the complex structure of educational data, along with a multi-method approach to data on classroom processes such as teaching interactions and children's behaviour in class, and complementary case studies of individual classes. It built on measures and theory developed in previous research.
The DfES Pupil Adult Ratios study had three components. Study A: the quantitative study of connections between class size, adult child ratios and educational outcomes (using existing data on reception and year 1) and Study B: the quantitative longitudinal study of associations between class size and adult child ratios and educational progress over reception and KS1, are dealt with as one in this report because together they cover children's progress over the whole of reception and KS1. Study C: the case studies of classroom support in small, medium and large classes, was designed to provide complementary information to that in the main quantitative study.
Sample
The overall Class Size and Pupil Adult Ratio Projects followed for three years a large cohort of pupils who entered reception classes during 1996/7, and a second separate cohort of pupils who entered reception classes one year later during 1997/8. At the start of the project there were in Cohort 1, 7,142 pupils in 330 classes in 199 schools in 9 LEAs. The second cohort comprised 4,244 pupils in 212 classes, in 134 schools in 6 LEAs. The children were followed for the whole of reception and KS1, that is, through the three years: reception, Y1 and Y2. The research design involved random selection of schools within the participating LEAs. All children entering reception in a selected school during the year were included in the study.
Data Collection
There were a number of forms of data collected in the study, For this report we have made use of selected types of data on the total sample; that is, information on class size and adult support in class, background details on the pupils, pupil assessments in maths and literacy, teacher
5 Results
Results are organised into six sections:
1. A description of classroom support, pupil teacher, staff and adult ratios, and class sizes in the project schools;
2. Relationships between pupil:teacher, pupil:staff and pupil:adult ratios and classroom teaching (in terms of amount of teaching time overall, time teaching individuals, groups and the whole class); time in different curriculum areas; and the frequency and duration of hearing children read;
3. Teachers' reports on the contribution of TAs to the effectiveness of teaching and learning in the class;
4. Whether teacher professional self-perceptions of stress, enthusiasm and satisfaction were affected by extra support in class;
5. A complementary, more focused and individualised picture of the role and contribution of TAs, on the basis of case studies in classes varying in size;
6. Quantitative MLM analyses of relationships between teachers and classroom support staff and educational progress over KS1.
These results can be summarised as follows:
1. Analysis of relationships between numbers of staff and adults in addition to the class teacher, and class size, on the one hand, and pupils' educational progress over reception, Y1 and Y2, on the other hand, showed the most significant effects for class size were in the reception year. Results showed no clear effects of additional staff and adults on children’s educational progress in any of the three years of KS1. The most noticeable effects on children's educational progress, particularly in the reception year, were therefore as a result of class size, and there was no obvious effect of extra staff or parents.
2. Analysis of connections between the three ratio measures (and class size) and three sets of classroom processes: teaching time, curriculum time, and hearing children read, showed that the presence of extra staff and adults did not have a consistent or clear effect on teaching and curriculum time and none on the time a teacher had to hear children read individually. The clearest result was that as class sizes increased there was less time for teaching overall and for hearing children read individually.
3. Analysis of the class teachers' end of year questionnaires showed that they felt TAs and other adults were making a positive contribution, in terms of :
i. increased attention and support for learning * more one to one attention
6
* support for teaching of literacy
ii. Increased teaching effectiveness * productive group work
* productive creative and practical activities *lesson delivery and curriculum coverage
iii. effective classroom management *day to day teaching related activities
iv. effects on children's learning outcomes.
4. Analysis of relationships between the three ratio measures (and class size) and three aspects of what we call teachers' professional self perceptions did not show a clear or strong pattern overall, though there was some evidence that as the numbers of children increased so too did teachers’ sense of stress. This tendency is consistent with open-ended comments from teachers in the same end of year questionnaire. These comments indicated that teachers could suffer with large classes; moreover, they believed that having extra support in class could help.
5. The case study results were helpful in reconciling the seemingly different picture about the contribution of TAs and adults arising from the end of year questionnaires – which were broadly positive - and results from the statistical analyses of relationships with educational progress – which were less clear. The most obvious point to arise out of the case studies was that the adult help in classes varied in terms of its effectiveness, and that this is probably the main reason why the quantitative analyses did not show clear evidence of the benefits of classroom support on children's educational progress. In other words, in some classes staff and adults were effective and were used effectively by teachers, but in others they were not. In some cases support staff and adults did not appear suited to an educational role with young children, and it is that unlikely training would be successful.
6. In the case studies we analysed ways in which, and the reasons why, support staff were effective or not, in terms of four main themes.
i. Reliability and consistency in classroom support. There were problems when support was not planned for and was fragmented. Teachers could spend valuable time supporting staff, or opportunities were lost.
7
iii. Implications for training. It was concluded that to be effective this would need to be integrated into classroom practice and connect with a teacher's aims and lesson plans, and take account of the often deeply held views of TAs about their role and contribution. One feature of case studies was the potentially important role of teacher's modelling of concepts, to be followed up by TAs.
iv. Support staff will inevitably be involved in direct teaching interactions and it is therefore necessary to consider what kind of contribution is appropriate. This will need to include consideration of deployment in relation to curriculum areas and general expectations about, for example, support with group work, but importantly it will need to consider actual interactions with children, as well as the pedagogical knowledge that underpins such interactions.
It is important to interpret these results carefully. As with all educational research the results are historically located. For the most part results relate to a period before the current Government drive to improve recruitment of TAs and provide training for them, and there were some suggestions from the end of year comments and from the case studies that initiatives such as the Literacy and Numeracy Strategies were having an impact on the way that staff were being used in classrooms. Another limitation is that the categories used for classroom support were broad. Although we distinguished between class size, numbers of additional staff (the closest to the current preferred term of 'teaching assistants') and other adults (usually volunteers and usually parents), it was not possible in the models with educational progress as an outcome to take account of the type and length of training these people received or the length of their classroom experience. The statistical analysis is therefore sophisticated but based on relatively broad measures.
Conclusion
It was found in this study that the use and effectiveness of adult help in classes varied between classes, and that this is probably the main reason why the quantitative analyses did not show clear evidence of the benefits of classroom support on children's educational progress. Some staff and adults were effective and were used effectively by teachers, but some were not.
9 CONTENTS
INTRODUCTION 11
Background to study in previous research and educational issues; concerns of previous research, and rationale of this project. Aims of study, and its main features. Model of main variables.
METHODS 19
Samples, Research instruments.
RESULTS 23
1. A description of classroom support, pupil teacher, staff and adult ratios, and class sizes in the project schools
2. Relationships between pupil:teacher, pupil:staff and pupil:adult ratios and classroom teaching (in terms of amount of teaching time overall, time teaching individuals, groups and the whole class; time in different curriculum areas; and the frequency and duration of hearing children read).
3. Teachers' reports on the contribution of Teaching Assistants to the effectiveness of teaching and learning in the class.
4. Whether teacher professional self-perceptions of stress, enthusiasm and satisfaction were affected by extra support in class.
5. A complementary, more focused and individualised picture of the role and contribution of Teaching Assistants, on the basis of case studies in classes varying in size.
6. Quantitative analyses of relationships between staff and adult support and educational progress over reception and KS1 (Multi-Level Modelling - results for reception, Yr1 and Yr2)
CONCLUSIONS AND GENERAL DISCUSSION 61
REFERENCES 65
11 INTRODUCTION
Teaching Assistants in Primary Schools: A review of Issues and Previous Research
There is often a tacit assumption amongst primary teachers and parents that increasing the number of adults in a class will be beneficial to children in terms of their achievement, although the research evidence to support or refute this is relatively limited. It seems important, therefore, to examine this assumption, especially as the January 2000 figure for FTE education support staff in mainstream primary and secondary (i.e., excluding nursery, special and PRUs) in England only is 100,459. The 1998 Green Paper Teachers: Meeting the Challenge of Change (DfEE, 1998) explains that the Government aims to increase the numbers of Teaching Assistants (TAs) by 20,000 full-time (or equivalent) by March 2002. Additionally, local authorities are being mobilised to give standardised training to TAs from September 2000. These induction materials for new TAs are now available for delivery by local authorities and the Local Government National Training Organisation is developing National Occupational Standards for TAs. QCA will develop a qualifications framework for TAs. There is evidence that the deployment of classroom support has improved in recent years (Farrell, Balshaw & Polat, 1999), though systematic evidence on links with educational progress is lacking.
12
• Augmentation (when the TA is involved in activities that enable the teacher to provide an enhanced curriculum)
• Substitution (when the TA has routine tasks delegated to her/him)
What is significant in the more recent studies is the apparent blurring of these roles. Lee and Mawson (1998) found that 77% of their sample of TAs were involved in both augmentation and substitution at different times. The study by Moyles and Suschitzky (1997) had similar findings, but described a “dilemma” between providing support for the teacher and providing support for teaching. This seems to signal a shift towards TAs engaging in pedagogic activity and not merely implementing programmes of work, which raises issues of training and education as well as status and working conditions. On the issue of roles and responsibilities, the DfEE (2000) document states:
“By definition, support for the teacher is at the heart of the role of the teaching assistant…The teacher plans lessons and directs learning. The teaching assistant provides support to the teacher and through this to pupils and to the teaching of the curriculum. The teaching assistant works under the direction of the teacher…” (p.24)
Both the Green Paper (DfEE, 1998) and the latest DfES document (2000) raise the profile of TAs in schools, giving them coherence as a sub-professional (or para-professional) group with training and qualifications and the recognition that schools need to change to utilise their specific skills and competencies.
Review of research on ‘teaching assistants’
13
Moyles and Suschitzky’s (1997) interview data are, perhaps, the most revealing of the
differences between TAs’ and teachers’ understandings of pedagogy. These suggested that TAs have undeveloped understandings of pedagogy (seemingly confirming the observation data) compared to the teachers. This is in many ways unsurprising considering the training, education and continuing professional development required of teachers compared to that of the assistants. The researchers equate their research findings to models of teachers’ career trajectories proposed by Berliner (1992) and Bennett and Carré (1993). Using this model, the researchers concluded that TAs behave as ‘novice’ teachers rather than ‘experts’. Whilst this may be a valid theoretical position to take for teachers, it is questionable when applied to TAs who have not had similar training and education to teachers and who, unlike teachers, have not been socialised into the profession.
The most convincing research on the pedagogical effectiveness of para-professionals in primary schools is in the domain of literacy and most particularly in evaluations of literacy interventions for children who are deemed to be low achievers in literacy. Wasik and Slavin (1993), for example, compared five reading interventions for low achieving first grade children (six year olds) in the United States of America that used one-to-one teaching programmes for children. Three of these programmes required teachers to deliver the intervention, and two required para-professionals. The programmes delivered by teachers (which included Reading Recovery and the ‘Success For All’ programme) had consistently larger effects on pupil outcomes than those delivered by the para-professional groups. The interventions delivered by para-para-professionals tended to be more focused on the breaking down of skills and sub-skills of reading and applying these to print, with a systematic approach to phonics teaching, representing a skills-mastery approach of individual components. Conversely, the teacher-delivered interventions tended to require deeper understandings of literacy acquisition by the teachers and were less systematic in their approach to the acquisition of skills. However, none of the evaluations collected adequate process data to assess how the interventions were delivered or to analyse contextual elements that may have contributed to the successes and failures of the programmes. This is a serious evaluation weakness.
14
standardised assessment tools. The overall results indicated that the intervention had failed, as the children in the experimental group had not achieved significantly better results than the control group. The researchers suggested reasons for this, although they did not mention the collection of any process data that contributed to their speculations.
It is difficult to draw specific conclusions from the Sunderland study, but it has been possible to make some general points across the range of evaluations of reading interventions. As outlined by Hurry (2000), in her review of reading interventions for primary aged children, the effect sizes for programmes taught by TAs or volunteers has been significantly smaller than those delivered by teachers. Hurry also notes that the programmes themselves differed depending on the person delivering them. Interventions delivered by TAs have been highly structured, using scripted instructional materials. They have also tended to focus on phonological skills and have only small amounts of text reading. The teacher delivered programmes have tended to be much more flexible and rely on teachers’ understandings of the reading process and pedagogical knowledge. This is especially true of Reading Recovery, which requires intensive and ongoing training and education of people who are already teachers for its delivery. Hurry concludes that there is not enough research to ascertain whether TAs can be effective in raising achievement in literacy, but the existing research does suggest that to date the interventions administered by classroom support staff have not achieved their aims. The research concerning literacy interventions by TAs raises serious issues concerning the pedagogical competence of TAs and the kinds of training and education they require to be successful.
The Institute of Education Study
We have seen that there is little research that analyses the work that TAs do in primary schools. There is even less which examines in a systematic way associations between classroom support and teaching in the class and pupils' educational progress. The research that currently exists is inconsistent in its findings.
15
The three components were designed to mutually inform each other and to have several direct benefits. First, they would provide guidance to policy makers; second, they would provide guidance to practitioners and others directly involved in education on the classroom implications of pupil adult ratios, the deployment of TAs, and class size differences; and third, they would be a contribution to research on class size effects and pupil adult ratios, which would be of interest to researchers working in the UK and other countries.
Background to the Study
The overwhelming professional judgement is that, other things being equal, smaller classes will enable teachers to provide a better quality of educational experience for pupils, and hence better educational attainments, and, as we have said, it is probably also widely assumed that increasing the number of adults in the classroom will be beneficial to children and the classroom teacher. However, research on the effectiveness of TAs (as we saw above) has been limited.
On the basis of our research reviews and work in this area (e.g., Blatchford & Mortimore, 1994; Blatchford & Martin, 1998; Goldstein & Blatchford, 1998), it was felt that information was needed on three main areas: first, data on class size and adult child ratios, as experienced by teachers and pupils; second, evidence on the effects of class size and adult child ratios on educational progress; and, third, systematic results on the mediating role of classroom processes, that is, connections between staffing in class and class sizes on the one hand and classroom processes like time in teaching and curriculum areas on the other. Accordingly, the research addressed three main questions:
a. What are the characteristics of teachers and classroom support staff in the classes and how large are classes in schools?
16
b. Does the number of pupils and pupil adult ratios affect pupils' educational attainment and progress?
The clear answer to this question, likely to be given by teachers, is yes, but the early research evidence from the UK was not clear. The recent STAR research in Tennessee, in the US, has done much to renew interest in research evidence on class size effects. This is a large-scale experimental study that has provided evidence that small classes do have benefits for young children in schools (Word et al, 1990), and this has influenced policy in the US, and other countries, including the UK and The Netherlands (Bosker, forthcoming). Though there are important questions about the validity and generalisability of results from the STAR project (Goldstein & Blatchford, 1998; Mitchell et al, 1991; Prais, 1996), it suggests, along with reviews of the literature (e.g., Blatchford & Mortimore, 1994; Glass et al, 1982; Robinson & Wittebols, 1986; Slavin, 1989), the most solid conclusion that can be drawn: the largest effects have been found with children soon after, or at the point of entry into, the school system. There is also evidence that class size has most effect in the case of disadvantaged children (see Blatchford & Mortimore, 1994; Goldstein & Blatchford, 1998). Evidence on the educational effects of extra classroom support is not so extensive or clear.
c. Are processes within classrooms affected by class size differences and pupil teacher ratios?
Assuming class size and PTR differences have an impact on pupils' academic progress, this still leaves unanswered questions about what mediates the effect. In other words, the association between class size and PTRs and outcomes in terms of pupils' attainments presumably has to be explicable in terms of some other changes within classrooms. Unfortunately, we have little systematic information on what processes might be affected. Although the STAR project found differences in the attainments of children in small and regular classes, the researchers were not asked by the state of Tennessee to enquire about processes underlying the effect (Achilles, pers. comm.), and so we do not know WHY small classes were effective.
Institute of Education Class Size and Pupil Adult Ratio Project: Research Approach
17
Results on the educational effects of class size differences are discussed in separate reports (see Blatchford, Goldstein, Martin & Browne, in press; Blatchford, Kutnick, Baines & Martin, 2001; Blatchford, Moriarty, Edmonds & Martin, 2001). A summary of results can be found in Appendix 1.
As described above, the DfES Pupil Adult Ratios Study had three components. Study A and Study B can be dealt with as one because together they cover children's progress over the whole of reception and Key Stage 1 (KS1). Study C (i.e., the case studies of classroom support) was designed to provide complementary information to that in the main quantitative study, and is dealt with in a separate section in this report. The methodology used in this and other components is described below.
19 METHODS
Sample
The overall Class Size and Pupil Adult Ratio Projects followed for three years a large cohort of pupils who entered reception classes during 1996/7, and a second separate cohort of pupils who entered reception classes one year later during 1997/8. Numbers of LEAs, schools, classes and pupils in each cohort are shown in the table below. The children were followed for the whole of reception and KS1, that is, through the three years: reception, Y1 and Y2. The research design involved a random selection of schools within the participating LEAs. All children entering reception in a selected school during the year were included in the study.
Cohort 1 Cohort 2
Number of LEAs
9 6
Number of Schools 199 134
Number of Classes 330 212
Number of Pupils 7142 4244
Data Collection
There were a number of forms of data collected in the study. For this report we have made use of selected types of data on the total sample; that is, information on class size and adult support in class, background details on the pupils, pupil assessments in maths and literacy, teacher estimates of time allocation, teacher end of year reports on the effectiveness of classroom support and scales measuring teacher perceptions of stress, enthusiasm and satisfaction. Information also comes from case studies on a sub sample of classes. As described above the aim was to use the strengths of different approaches in a complementary way and to check for consistencies across different forms of data, thereby strengthening the validity of conclusions.
Basic information collected in the study is shown in Figure 1.
Each type of data collection is now briefly described, but is described in more detail when relevant results are discussed.
Main Sample
20
Data were collected in two main ways:
a. School Entry Assessment Booklets: Teachers were asked to record information on class size (on register), age composition of class, number of teachers in class, TAs (details of personnel and hours), and other classroom support, for example, special educational needs (details of personnel and hours).
b. Termly Questionnaires: In the spring and summer terms, teachers were sent questionnaires asking for information relating to the situation at 10 a.m. on one of three specified days. They were asked to choose the most ‘normal’ of the days. So, for example, if they were going on a school outing they were asked to use the nearest appropriate date. If they were engaged in non-classroom activities at 10 a.m., for example, PE or assembly, they were asked to choose the nearest time when they were engaged in normal classroom activities. The questionnaire asked for information on: class size as register, experienced class size (i.e., present in classroom at given time), number of children absent, children present who were not on the class register (e.g., extra children from the class of an absent teacher, or peer tutoring), children on the register elsewhere in school at a given time (e.g., receiving language support, library work) and therefore not present at 10 a.m., adults present at the time in terms of the number of usual class teachers, nursery nurse or equivalent, TA, specialist teacher, specialist TA, parent, student teacher, and other adults.
So, taking a. and b. together it was possible to calculate measures for each year of:
• registered class size
• registered pupil teacher ratios • registered pupil staff ratios
• registered pupil adult (including parents and helpers) ratios • experienced class size
• experienced pupil teacher ratios • experienced pupil staff ratios
• experienced pupil adult (including parents and helpers) ratios
2. Termly Questionnaires: A questionnaire on classroom activities during a half-day period completed twice during the year by the class teacher. This examined time devoted to management and other non-teaching activities and proportions of whole class/small group/individual teaching, as well as more detailed information on class size, classroom support, and grouping practices.
21
4. Start of Reception and End of Year Assessments of pupils in maths and reading: An adapted version of the Avon School Entry Assessment was used (beginning of reception year), followed by assessments of maths designed within the Institute of Education Class Size Study and the Hodder and Stoughton Literacy Baseline Test (end of reception), Young's Group Reading and Maths Tests (end of year 1), and an adapted version of KS1 English and Maths National Curriculum test results (end of year 2).
5. Pupil Behaviour Ratings: (completed by teachers on individual pupils), assessing adjustment to school, peer relations, relationships with adults, and behaviour problems.
6. Pupil Background Details: Including age, sex, free school meal entitlement, English language fluency, previous nursery education, attendance and special educational needs.
7. Case Studies of a sub-sample of classes of a different size (Study C): The aim of this part of the research was to provide complementary information to that in the main quantitative study. A very different form of methodology was used to provide a more detailed portrayal of individual classes, which provided the basis for a more interpretive and grounded analysis of factors related to size of class.
One overriding choice is between two main types of research approach: 1. collecting data in an objective way, using variables/headings drawn from the literature and results so far, and then drawing conclusions later (in the spirit of a quantitative paradigm), and 2. using a more dynamic, interpretative style of research in which headings might be used as the basis of interpreting what is observed and guiding discussions with teachers (in the spirit of qualitative/ethnographic paradigm). This component of the research might be considered a middle course between these two. The methodology was developed on the basis of field visits to schools. We defined selected aspects of classroom learning and experience in advance (based on the literature and data from the quantitative study so far), and collected data using a form of semi-structured observational event sampling, which used the aspects as categories structuring what to observe, and include ongoing notes and comments by observers. Semi-structured interviews were conducted with class teachers, again using the main headings. More informal discussions took place with head teachers and, where possible, other teachers in schools.
22
23 RESULTS
This section reports on six sets of data that each had a connected but different purpose:
1. A description of classroom support, pupil teacher, staff and adult ratios, and class sizes in the project schools.
2. Relationships between pupil teacher, pupil staff and pupil adult ratios and classroom teaching in terms of amount of teaching time overall, time teaching individuals, groups and the whole class; time in different curriculum areas; and the frequency and duration of hearing children read.
3. Teachers' reports on the contribution of Teaching Assistants (TAs) to the effectiveness of teaching and learning in the class.
4. Whether teacher professional self-perceptions of stress, enthusiasm and satisfaction were affected by classroom support.
5. A complementary, more focused and individualised picture of the role and contribution of TAs, on the basis of case studies in classes varying in size.
6. Multi-level model analysis of adult ratios and class size in relation to progress in Maths and English for reception, Year 1 and Year 2.
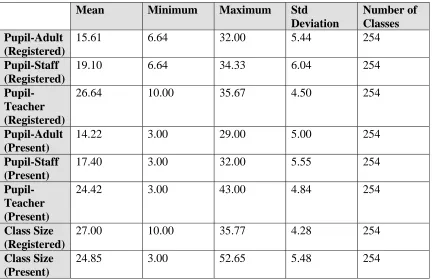
1. Pupil to adults/staff and teacher ratios: descriptive information on sample schools
In Tables 1 to 3 we show basic descriptive information on the pupil to adult ratios, pupil to staff ratios and pupil to teacher ratios, for both ‘present’ and ‘registered’ information, for Cohort 1. As would be expected, for each type of ratio, numbers of children on a particular survey day are slightly less than those on the register. Average class sizes on register were 26 for reception, 27 for Y1 and 28 for Y2. Numbers of children to teachers were very similar to the numbers of children in the class, confirming that there were few cases when classes had more than one teacher. However, there were fewer children to staff (i.e., teachers and paid staff); for the registered information, numbers of children were now 17, 19, and 16 for reception, Y1 and Y2 respectively. Numbers of children to adults (staff plus volunteer helpers, mostly parents), were even lower still – now 14, 16, 17 respectively.
24
Blatchford, 1993). It can be seen that there are more small classes at reception level, though not fewer large class sizes. It needs to be borne in mind that the Government legislation on reducing class sizes at KS1 will have affected the current situation. When staff and adults are taken into account, the number of classes with 20 or less pupils to staff and adults goes up markedly; for example, 86% of classes at reception 84% of classes at Y1 and 76% of classes at Y2 have 20 pupils or less to adults (for registered information).
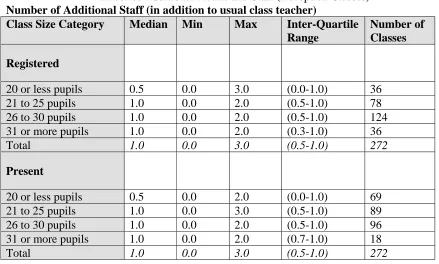
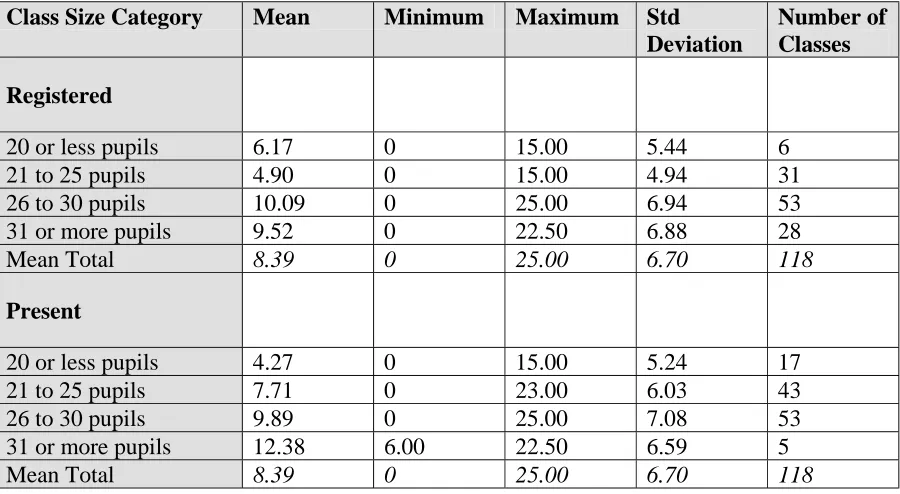
Tables 7 to 15 give information on the average numbers of additional staff and adults, and additional hours support, for each of the class size categories, for each year. These tables show that there tends to be more additional staff and more additional hours, as class size increases for reception and Y1, though the trend for Y2 is less clear.
Cohort Two – Year 2
Additional Adults in Class
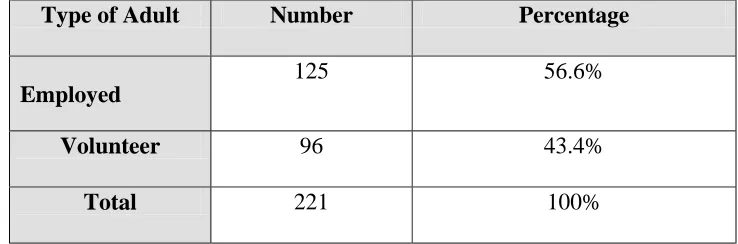
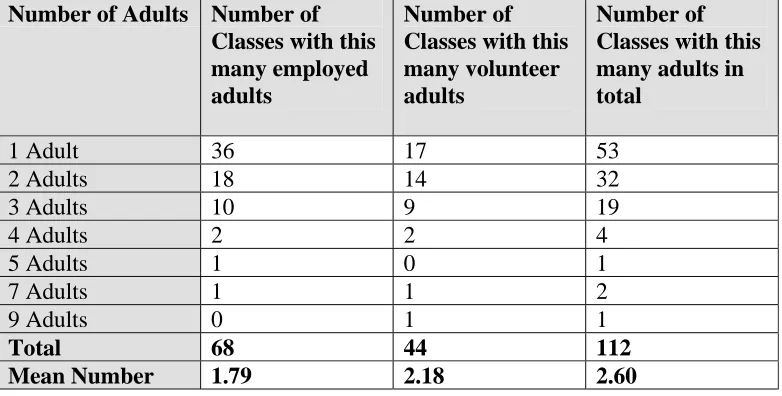
When Cohort 2 were in Y2, it was decided in consultation with the DfES Steering Committee to collect extra information on adults working in the project classes. Information was returned on 95 year 2 classes on a sample day during the spring term (2000). Tables 16(i), 16(ii) and 16(iii) show a breakdown of the type of adults working in these classrooms, in terms of whether they were employed or were volunteers, and their hours of work per week.
Table 17 shows that the mean number of volunteer adults in class is greater than the mean number of employed adults in class. This contrasts with the hours worked, in the sense that employed adults work more hours per week than volunteer adults do.
In 36 classes there was only one employed adult (in addition to the teacher) who worked in the classroom. Very few classes reported having no adult help at all. The average class had 2.6 additional adults providing 4.52 hours of additional support within the classroom per week.
Relevant Work Experience
Information was collected on the work experience of the adults working in these classes. Table 18 shows the levels of experience for employed and volunteer adults. As would be expected, employed adults have more experience than volunteer adults, who perhaps, as parents (mostly), would be more short term in their commitment. Well over half of the employed adults surveyed had more than six years relevant experience.
25
Further information was also required on the tasks and roles carried out in the classrooms (see Table 19). Given the uncertainty over how to classify these tasks it was decided to obtain information with an open-ended question and then categorise answers afterwards. The
terminology used by individual teachers when completing the questionnaires varied. Wherever possible these have been grouped together to provide more consistent and usable categories. The categories used are based on the information supplied by class teachers taking part in the survey.
The majority of employed staff perform the role of learning support assistant, with others supporting pupils with statements of special educational need and children with special
educational needs in general within the classroom (for example working with specific groups of children at stages 1 to 4). Most volunteer staff were used to perform general duties within the classroom, but most often focusing on hearing individual children read.
Qualifications
Finally, information was collected on the qualifications of adults working in the classrooms. A total of 51 (24% of employed adults and 22% of volunteer adults) adults working in these classrooms had no qualifications or training, either certificated or internal to the school or LEA (see Table 20). Fewer qualifications were recorded for volunteer adults, with most teachers simply describing them as ‘parent’, which has been included as a qualification category. The table shows the frequency of qualifications cited, which means that many of the adults have more than one qualification.
2. Associations between teaching time, curriculum coverage, hearing children read and pupil to teacher, staff and adult ratios and class size.
Summary
Results on teaching and curriculum time, and hearing children read, show most clearly that as class sizes increase there is less time for teaching overall and for hearing children read individually. The presence of classroom support did not have a consistent or clear effect on teaching and curriculum time and none on the time a teacher had to hear children read individually.
26
allow teachers to spend more time teaching and relieve her of non-teaching activities.
Data were collected in the termly questionnaires. This paper makes use of Cohort 1 data only, and includes data on 279 reception classes, 207 Year 1 classes and 118 Year 2 classes. Teachers were asked to consider the period between the start of the day and the start of lunchtime on the day assigned to them. They were asked to estimate in minutes the length of the morning session, how much ‘lesson time’ there was in the session (i.e., excluding assembly, morning break, and PE). Teachers were then also asked to estimate how much time, in minutes, during the designated morning, THEY spent in various teaching and non-teaching activities. These were:
• Collecting dinner money
• Liaising with other adults in the classroom
• Dealing with domestic and personal problems e.g., toileting, accidents, etc. • Outside interruptions such as telephone calls, class receiving visitors, etc. • Lining the class up, putting on coats, etc.
• Time out of class • Taking the register
• Settling the class and allocating tasks and children to groups • Dealing with discipline and behaviour problems.
• Teaching/working with the whole class • Working with an individual child • Working with a group of children
The total time spent in the three most obviously teaching activities – that is to say, to the whole class, group or individual - was taken as a measure of ‘teaching time’. There were therefore four measures used in the analyses reported here, that is to say, 1. teaching to individuals, 2. teaching to groups, 3. teaching to whole class and 4. total teaching time (i.e., 1+2+3). The other categories, including settling the class and allocating tasks and children to groups, and dealing with discipline and behaviour problems, were added to give a measure of ‘non teaching’ time, though these are not used in analyis (the way these were calculated means that they are inversely and exactly related to total teaching time). It is recognised that some ‘non teaching’ activities can be sometimes considered teaching activities, but it was felt that adding the three teaching modes - which asked the teacher specifically about teaching - would provide the most unambiguous estimate of time spent by the teacher in teaching.
Curriculum coverage
27
related to size of class and extra adults in the class. Given recent guidance on time that should be spent in literacy and numeracy, it is clearly important to know whether situational factors like size of class and extra staff affected the amount of time that is spent in these areas.
On the same questionnaires as the termly class size data, teachers were asked to complete a checklist of curriculum areas they covered during the designated morning session. Teachers were asked to say how much time they spent in:
Maths (sets/number; shape, space, and measures);
English (reading - phonic and graphic knowledge; word recognition; grammar and contextual understanding, e.g., sentence structure, full stops, retelling story in own words; other reading activities; writing);
Science/technology;
Art/craft; history; geography; others;.
Teachers were told that groups of children might have been working on different areas at the same time, but that we were interested in curriculum areas THEY covered during the morning session. They were asked to refer only to their own time, not classroom support staff in the classroom. Results are presented here on percentage teaching time in maths and in English.
Hearing children read
We then looked more specifically at one main aspect of the teaching of reading. As part of a previous study of the teaching of reading in 3 LEAs it was found that the two most common reading activities were reading to the whole class and hearing children read individually (Ireson, Blatchford & Joscelyne, 1995). Early information from reception teachers in the current study with large classes showed they were concerned about not having enough time to listen to individuals read, monitor children's reading progress, and plan effective individual reading programmes. Teachers could feel obliged to give up lunchtimes in order to hear children read, and also rely on parental help. To what extent was the amount of time available for hearing children read affected by pupil to teacher, pupil to staff and pupil to adult ratios? Some teachers believed that even though they had help from parents and teaching assistants (with listening to individual children read), it was ultimately their responsibility to monitor each child's progress, and make sure they were being sufficiently catered for.
28
a. Frequency of reading activities, in terms of a grid listing types of reading activity:
• Reading aloud to adult in school • Reading aloud to another child • Reading alone
• Reading with whole class on, e.g., ‘Big Books’
• Reading aloud in a group to adult
For each activity, the frequency was noted in terms of:
• Daily
• 3-4 times a week • 1-2 times a week
• Less than weekly.
b. The duration of time each child was heard read by an adult per week this term (excluding parents/carers outside school time but including classroom support staff during school time) was estimated in terms of:
• Less than five minutes • 5-10 minutes
• 10-20 minutes
• More than 20 minutes.
Only the frequency and time spent in hearing children read data are presented here.
Results
Correlation coefficients between pupil teacher, pupil staff, pupil adult ratios and class, for both experienced and present class sizes, for Cohort 1, are presented in Tables 21, 22 and 23.
29
Associations between the pupil teacher ratio measure and percentage teaching time for class size registered is in a similar direction to that for class size, that is, as the number of children to teachers increases teaching time decreases. However, coefficients are lower in comparison to class size and only significant at Y1. With regard to pupil staff and pupil adult ratios and teaching time (for class size registered) the only significant result is for pupil adult ratio at Y2; as the number of children to adults (i.e., all adults including teachers, staff and parents) increases the time a teacher devotes to teaching decreases. This result is also found with class size present. These results indicate that it is class size that is most obviously related to overall teaching time, and this also largely explains the results concerning pupil adult ratio (pupil teacher ratio is very similar to class size, see above). The amount of classroom support overall does not affect overall amount of time spent teaching as much as class size.
Results concerning associations between the three constituent parts of teaching time, that is, percentage time teaching to the whole class, groups and individuals, and the class size and ratio measures, for both class size registered and present, are also shown in Tables 21 to 23. For the most part these do not show a clear pattern. At reception there are no significant results or consistent trends. At Y1 there is some evidence that as the number of children to staff increases so too does the amount of teaching to the whole class (for both class size registered and present; for class size present this trend is also found for pupil adult ratio) and individuals (registered only). At Y2, as the number of children to teachers, staff and adults increases the amount of time teaching to groups decreases. Overall, then, pupil to /teacher/staff/adult ratios are not clearly related to teaching time though there is some suggestion at least for some years that teaching to groups decreases, and teaching to the whole class and to individuals increases with more children to adults.
Results concerning associations between the two curriculum time measures and the class size and ratio measures for both class size registered and present are shown in Tables 21-23. For reception, for class size registered, there is a trend for the teaching to spend less time on English as the number of pupils to adults and pupils to teachers increases; for Y1 there is MORE time in maths as the number of pupils to adults and staff increases; and for Y2 there are no associations. There is therefore a hint of an effect on curriculum time for classroom support (not explainable in terms of class size), but the effect is different for maths and literacy. It seems that only the time the teacher spends on literacy is likely to suffer, in the sense of being reduced, with more children to staff and adults; indeed, possibly the strongest correlations suggest that the amount of time in maths increases with more children to staff and adults. This is difficult to explain but may reflect the fact that in maths, classroom support (more likely in larger classes) is used to boost overall teaching time, whilst this trend is less obvious for literacy.
30
teachers hear children read individually for less time and less frequently. This result is also found for the number of pupils and teachers. The association is NOT found for classroom support, however, indicating that their presence in the classroom is not being used to allow the teacher to hear children read more often (though they may be deployed to hear children read themselves).
3. Teachers' experiences of, and views about, the effectiveness of classroom support in terms of teaching and learning, within Reception and Key Stage 1 classrooms.
Summary.
From the class teachers' perspective, TAs and other adults were making a positive contribution, in terms of:
a. increased attention and support for learning * more one to one attention
* support for children with SEN and EBD * support for teaching of literacy
b. Increased teaching effectiveness * productive group work
* productive creative and practical activities *lesson delivery and curriculum coverage
c. effective classroom management *day to day teaching related activities
d. effects on children's learning outcomes.
End of year questionnaires by 151 reception teachers (cohort two) and 208 year one teachers (cohort one) during the summer term of 1998, and 130 year one teachers (cohort two) and 153 year two teachers (cohort one) during the following summer term of 1999 were used for analysis.
31
proportion of all responses and is also useful in calculating collective categories that ‘lump’ together individual response categories that reflect a common theme.
The analysis also allows an inspection of whether there were any perceived differences across the three teaching age groups (reception, year one and year two teachers). Selections of verbatim comments, expressed by teachers, are used in order to illustrate the main themes.
Almost all of the reception, year one and year two classes received some form of classroom support, and the availability of classroom support was therefore the norm within these reception and Key Stage 1 classes (though the number of hours a week and quality of this support varies, as we show elsewhere).
A main finding was that although not explicitly asked to indicate their degree of satisfaction with the contribution of TAs to teaching and learning, many teachers spontaneously indicated how valuable their classroom support had been (50% of reception teachers, 40% of year one teachers (cohort one and cohort two) and 32% of year two). Year two teachers tended to respond with rather briefer answers, and suggested fewer general comments regarding the perceived necessity of classroom support staff than teachers of lower age groups. This may suggest that teachers of the youngest children perceive their classroom support to be more essential, for example, to help them cope with the demands of younger children.
‘She is invaluable (NNEB support), an excellent communicator with young children, and gives 100% to her job. She makes an enormous impact on the teaching and learning in the class.’ (reception teacher)
My class would not run as effectively and smoothly without good G.A support.’ (reception teacher)
‘It makes a significant difference to have extra adult hands/ help in the classroom.’ (Year 1 teacher, C2)
‘Huge and valuable. 2 minds, 2 pair of hands, 2 places at one!’ (Year 2 teacher)
Only a very small percentage of teachers (1-4% across teaching age groups) said that classroom support had not been helpful, and occasionally a hindrance, to teaching and learning. The case studies, described below, suggest this may underestimate the true picture.
Teachers with larger or mixed aged classes seemed to find extra support helpful.
32
‘Helps with difficulty of teaching mixed age class - makes things more manageable.’ (Year 1 teacher, C2)
‘Effective. In a class of 34 it is impossible to give the children the support they need if not supported by NNEB for at least some of the time.’ (Year 2 teacher)
On the whole, therefore, reception, year one and year two teachers saw TAs as beneficial, making a valuable contribution to the effectiveness of teaching and learning within their class. In general terms this appeared to be related to their personal qualities and experience of working with young children, as well as their training.
‘The quality of the work is enhanced when my assistant is with a group of children. She is very experienced and contributes very much to the effectiveness of teaching and learning.’ (reception teacher)
‘A classroom assistant is even better (than adult help) because they receive training about expectations in behaviour and work and the level of independence each child can receive.’ (Year 1 teacher, C2)
But, how more precisely do TAs influence teaching and learning in class? Tables 24 and 25 give a detailed breakdown of all the answers given by teachers at each age level, a summary of average responses across the year groups (Table 24), and the organisation of these individual categories grouped on conceptual grounds into four main types (Table 25).
1. Increased attention and support for children
The most frequent individual response, given by more than 20% of teachers at all three ages, was the view that TAs contributed through increased individual attention to pupils (33% reception teachers, 21% year 1 teachers cohort one, 31% year 1 teachers cohort two and 28% year 2 teachers). When classroom support is available, teachers felt that children received more individual help and attention, either from the assistant or themselves. This provides children with increased opportunities for individualised attention, learning support and feedback. Thus, individual learning needs are more likely to be met.
‘The support has provided valuable one-to-one time for children who need to develop skills/ concepts. Children who need to work on the basics and children who are most able and need extending.’ (reception teacher)
33
‘It has provided extra support for children, to assist with their work and to give encouragement.’ (Year 2 teacher)
Furthermore, reception teachers reported that this benefits the children as they receive more interpersonal attention. Teachers of older children did not report this aspect.
‘These young children need support with personal and social development often at an individual level when first adjusting to school routine.’ (reception teacher)
This is one reason why classroom support, from a teacher's point of view, can be particularly valuable with the youngest children in school.
Support for children with SEN:
Another allied category of responses referred to support for teaching in a more specific way; for example, extra support for children with SEN. Where classroom support is used to provide extra 1:1 support to children with SEN, teachers feel that it enables these children to make better progress educationally, their needs are more likely to be met within the class when extra support is available, and it can increase their confidence.
‘With having a classroom assistant I am able to support children with special needs, either myself leading the activity or direction from the C.A.’ (reception teacher)
It has been tremendous help with giving the SEN children extra input in the skills they need developing.’ (Year 1 teacher, C1)
‘I have a very good classroom assistant who works with the SEN group in my class. The progress made by this group, due to her excellent support, has been tremendous.’ (Year 2 teacher)
Support for teaching of Literacy:
Teachers also felt that classroom support can increase the time available to hear individual readers. 1 in 10 reception and year one teachers (in 1998) said that individual reading support had increased. Year one and year two teachers who completed the questionnaire a year later reported increased reading support to a lesser frequency (perhaps reflecting the decreasing role of hearing individual children read as a result of the literacy strategy?).
34
‘The children have been heard to read more frequently, which in all cases has helped to raise standards.’ (Year 1 teacher, C1)
Classroom support is considered important by teachers as a help in successfully implementing the National Literacy and National Numeracy strategy. This was expressed to a higher extent by year one and year two teachers (summer term, 1999), who commented principally on the National Literacy Strategy. Help is needed to support literacy groups, and to provide learning support to children with special educational needs.
‘Children with lower literacy skills (particularly writing) have had extra support which has developed their understanding of structuring and punctuating sentences.’ (Year 1 teacher, C2)
‘My support assistant has been invaluable this year in helping me support my SEN children during the Literacy and Numeracy Hour strategies.’ (Year 2 teacher)
To summarise: teachers felt that classroom support could contribute to support for learning, for example, in terms of increased individual attention for pupils, extra support for children with SEN, and increased support for the teaching of literacy through increased opportunities to hear children read and support for the National Literacy Strategy.
2. Increased teaching effectiveness
There were several individual responses that were more directly related to teaching, in the sense of describing instructional interactions between adults and children. The third most frequent category overall was more productive group work (30% reception, 26% year 1 cohort one, 20% year 1 cohort two and 18% year 2 teachers). Teachers felt that classroom support enables group sizes to be smaller, and that adults can therefore more easily monitor the groups, and activities can be more structured. This in turn permits more challenging and stimulating activities, enabling children to be more focused and actively involved, and yielding more productive work and discussions. This was expressed to a higher extent by reception teachers, and teachers who completed the questionnaire in the summer term of 1998. Having another adult within the class means that an additional group can have teaching input.
‘A non-teaching assistant can take small groups of children and provide them with the input specific to their needs.’ (reception teacher)
‘The children have benefited from working in small groups with an adult to support them. This has meant more of the learning has been through discussion and interaction rather than self-maintaining tasks.’ (Year 1 teacher, C1)
35 quality of work.’ (Year 2 teacher)
One benefit of extra help, therefore, is the part it can play in increased teaching effectiveness, though here and with other responses to the questionnaires, it is not always possible to deduce whether TAs were seen as DIRECTLY providing more attention to children or whether their presence allowed teachers to give more attention to children.
There were other ways that classroom support could contribute to teaching effectiveness. One set of comments referred to practical and creative activities, particularly within reception classes. An extra pair of hands and eyes means that there is better supervision for such work, for example, in arts and crafts; design and technology; maths and language games.
‘Enables all children at intervals to work on activities which need to be supervised by an adult e.g., art/ craft activities/ water capacity activities.’ (Year 1 teacher, C1)
‘I have a NNEB student one day a week. This is the day we do art and craft, otherwise we do very little.’ (Year 1 teacher, C2)
Given increased demands on teachers' time, some teachers at least felt that creative and practical activities would be more challenging without support in the class.
In addition, teachers expressed the view that, as a consequence of having classroom support, they were able to be more effective in their lesson delivery and curriculum coverage. They were better able to focus upon class teaching and differentiation of work, allowing more heightened and in-depth coverage of the National Curriculum.
‘A classroom assistant providing this support while the teacher continues the teaching routine enables the whole class to settle more quickly and learning to be tailored to the class needs.’ (reception teacher)
‘She leaves me free to extend literacy and numeracy skills of Y1 and Y2 children.’ (Year 1 teacher, C1)
‘Support enables objectives, differentiation targets to be met.’ (Year 1 teacher, C2)
‘Teacher able to be more focused’. (Year 2 teacher)
36
3. Effective classroom management
Another set of categories indicated that classroom support can make a teacher's workload easier, that is, it assists with classroom management. Main individual responses given by more than 10% of teachers at least one age level were: delegate day to day duties (6% reception teachers, 19% year 1 teachers cohort one, 3% year 1 cohort two and 11% of year 2 teachers); and reduces pressure on the teacher (10% reception, 6% year 1 cohort one, 1% year 1 cohort two and 3% of year 2 teachers).
Classroom support can, therefore, offer aid with day-to-day teaching related tasks, which can lighten the teacher's workload. They can help with displays, mounting work, photocopying, or involvement with lesson preparation. Teachers said that this relieved some of the heavy burdens they felt placed upon them, allowing them to focus upon their actual teaching.
‘Their assistance in displays has helped to keep the classroom instructive, stimulating and attractive’. (Year 1 teacher, C1)
‘Has helped assist teacher with paperwork, filing etc - cutting down workload’. (Year 2 teacher)
4. Effects on learning outcomes
The findings so far discussed show that teachers feel that the presence of classroom support can provide increased learning experiences for children, via the increased quantity and quality of adult help that children receive. Has this influenced children's learning? 1 in 5 of reception teachers and 19% of year one teachers (cohort one) said that as a result of effective classroom support the standards of learning and progress had been raised. They reported that children show greater achievements and complete work more quickly, demonstrating an enhanced quality and pace of learning. This was mentioned, to a lesser extent, by year one teachers (cohort two) and year two teachers (9% and 8% respectively).
‘It would be difficult to achieve the high standards we currently have if extra supervision was unavailable’. (reception teacher)
‘The support has helped to sustain the breadth of curriculum and contributed to the standard of learning the classroom’. (Year 1 teacher, C1)
‘Children learn so much more with adult guidance’. (Year 1 teacher, C2)
37
‘I have more time for the children and everything is much more enjoyable, calm and productive’. (reception teacher)
‘Reduces pressure on me’. (Year 2 teacher)
Differences according to age of child:
There were some indications that teachers' views on the role of classroom support varied according to the age of children and the year group taught. Year one and year two teachers more frequently (than reception teachers) said that TAs provided extra support for children with SEN. Reception teachers reported that children received increased attention. The presence of another adult allows more practical activities and lessons to take place, particularly within reception classes. With younger children there was an increase in the percentage of teachers mentioning more productive group work and reduced working pressure. Reception teachers reported that TAs helped deal with practical/ physical incidents; this was not mentioned by the older teaching age groups.
We looked to see if there were any obvious differences between answers of teachers who completed the questionnaire in 1998 and 1999, which might reflect general changes in education. Year 1 and year 2 teachers, who completed the questionnaire in the summer term of 1999, reported a higher incidence of TAs helping with the National Literacy/Numeracy Strategies, than teachers in the previous academic year. TAs are used to help manage these strategies and provide learning support to individuals, groups and children with special educational needs.
When classroom support is not helpful:
A few teachers, as we have seen, expressed the opinion that their classroom support did not contribute positively to classroom teaching and learning, perceiving them as ineffective (4% of reception teachers, 1% of year 1 cohort one teachers, 3% of year 1 teachers cohort two teachers, and 2% of year 2 teachers).
‘She wouldn't communicate with the children and was more of a liability, than help’. (reception teacher)
‘It's about time we had trained help in the classroom!’ (reception teacher)
‘So much time explaining how to go about the task’. (Year 1 teacher, C1)
‘As little as only 1 hour a week’. (Year 1 teacher, C2)
38
These comments indicate that the reasons for perceived ineffectiveness of TAs, and other classroom support, related to their direct communication with the children, as well as training and time needed to support them. We return to these areas in the section on case study results.
4. Teacher self-perceptions: enthusiasm, stress and satisfaction - affected by support in class?
Summary
Analysis of relationships between the three ratio measures (and class size) and three aspects of what we call teachers' professional self perceptions was not definitive, but there was some evidence that as the numbers of children increased so too did teachers’ sense of stress. This tendency is consistent with open-ended comments from teachers in the same end of year questionnaire.
It has been claimed by some that factors such as the number of children in a class are not important, and that the quality of teaching is the most significant factor (e.g., Burstall, 1979 & Ofsted, 1995). This view may be correct, but is likely to miss an important, if easily overlooked, effect of class size. It may be that teachers in large classes, perhaps without adequate classroom support, have had to compensate for the possibly negative effects on children, and this might be at a cost to the teacher. It might be that she spends lunch breaks hearing children read, assessing work at length during the evenings and weekends, meeting parents out of school hours, as well as experience the sheer exhaustion caused by these efforts. It may be in turn that all this effort adversely affects teachers’ morale, enthusiasm, stress and well being.
This was suggested by teachers' comments at the end of the reception school year:
‘I believe the children recognise the strain I am experiencing and this so often affects the enjoyment and laughter that usually typifies my classes’.
‘I believe the small number of children in my class (22) has helped the quality of teaching and learning in my classroom this year. Obviously I am less tired, stressed and more enthusiastic in my work’.
‘With a class of over 30 you really notice a difference - particularly with children of this age. It's a bit like a treadmill - working hard and getting nowhere fast!’
39
and others describes a number of studies which indicate that large class sizes are associated with increased teacher stress (French, 1993; Kyriacou & Sutcliffe 1978; Lowenstein, 1991; Rivera-Batiz & Marti, 1995 - all cited in Day et al, 1996) and can lead to teacher burn-out (Rivera-Batiz & Marti, 1995, in Day et al, 1996). As Day et al conclude, stress is costly in human terms (ill-health), teaching quality terms, and also in economic terms (absenteeism and staff turnover). Any savings in staff costs stemming from larger classes need therefore to be set against increased costs in human, teaching and economic terms.
Research and teachers' comments are, therefore, suggestive of links between size of class and teacher enthusiasm, satisfaction and stress; however, the evidence is often indirect and better evidence is needed. In the allied class size study, we have examined relationships between three core professional self perceptions as they might be labelled - teacher stress, enthusiasm and satisfaction - and class size. In this section we are interested in the extent to which classroom support affected these three aspects.
To do this we required a method that would allow us to obtain reliable and valid information from all the teachers involved in the study. The method needed, therefore, to be technically sound but easy to complete. Previous research on teacher job satisfaction and stress was reviewed and examined critically. It was felt that many of the existing schedules were not appropriate, for example, because of their excessive length and uncertainties about reliability. With regard to teacher stress, we did not wish to replicate detailed survey work on main factors leading to stress.
We decided to measure teacher self-perceptions in three main areas.
1. Teacher energy/enthusiasm
In a longitudinal study of factors influencing children's reading progress, Rowe (1995), examined ways in which teacher's self perceptions were implicated in their competence and pupils' progress. Using Elsworth and Coulter's Professonal Self Perception Questionnaire (1977), Rowe found that the first factor - 'energy/enthusiasm' - accounted for the largest proportion of variance (47.2%); the remaining 4 factors accounted for 20.8% of the variance between them. In multi-level modelling analyses, a large proportion of the variation in students' reading achievement was due to between class/teacher differences, and much of this variation was accounted for by differences in teachers' energy/enthusiasm.