University of Southern Queensland
Faculty of Engineering and Surveying
The Efficient Use of Building Mechanical Services for
Saving Energy
A dissertation submitted by
Joshua Searle
In fulfilment of the requirements of
ENG4111 and 4112 Research Project
towards the degree of
Bachelor of Mechanical Engineering
ABSTRACT
Energy consumption in buildings is responsible for 26% of Australia’s greenhouse gas emissions (CSIRO, 2010). Furthermore the energy consumption associated with cooling and heating plant in buildings typically accounts for over 50% of the total building energy use (CSIRO, 2010). As a result this project assesses the greenhouse gas emissions associated with possible air conditioning upgrade alternatives for a multi-storied building 295 Ann Street, Brisbane.
295 Ann Street, Brisbane was constructed in 1973 making the mechanical services plant approximately 38 years old. Due to the age and condition of the air conditioning plant the system is due for replacement.
The aims of the project are to analyse, compare and contrast various air conditioning upgrade alternatives to determine which will provide the greatest greenhouse gas emissions savings. A BCA2010 reference building will be modeled for each alternative to determine if the existing system or proposed upgrades are compliant with the Building Code of Australia.
University of Southern Queensland
Faculty of Engineering and Surveying
LIMITATIONS OF USE
ENG4111 Research Project Part 1 &
ENG4112 Research Project Part 2
Limitations of Use
The Council of the University of Southern Queensland, its Faculty of Engineering and Surveying, and the staff of the University of Southern Queensland, do not accept any responsibility for the truth, accuracy or completeness of material contained within or associated with this dissertation.
Persons using all or any part of this material do so at their own risk, and not at the risk of the Council of the University of Southern Queensland, its Faculty of Engineering and Surveying or the staff of the University of Southern Queensland.
This dissertation reports an educational exercise and has no purpose or validity beyond this exercise. The sole purpose of the course pair entitled “Research Project” is to contribute to the overall education within the student's chosen degree program. This document, the associated hardware, software, drawings, and other material set out in the associated appendices should not be used for any other purpose: if they are
so used, it is entirely at the risk of the user.
Professor Frank Bullen
Dean
CERTIFICATION
I certify that the ideas, designs and experimental work, results, analyses and conclusions set out in this dissertation are entirely my own effort, except where otherwise indicated and acknowledged.
I further certify that the work is original and has not been previously submitted for assessment in any other course or institution, except where specifically stated
Student Name: Joshua Searle Student Number: 0050000893
_________________________ Signature
ACKNOWLEDGEMENTS
I would like to thank my supervisor Dr Sourish Banerjee for his assistance and guidance throughout this project. His advice, guidance and encouragement throughout the completion of this research is acknowledged and greatly appreciated.
I would also like to thank the Facilities Operations Group who are the property managers of 295 Ann Street, Brisbane. Their permission to base this research project on their building, plus providing complete access to the buildings historical data was extremely vital to effectively complete this project.
TABLE OF CONTENTS
Abstract ... ii
Limitations of Use ... iii
Certification ... iv
Acknowledgements ...v
Table of Contents ... vi
List of Figures ... ix
List of Tables ... xi
1. INTRODUCTION ... 1
1.1 Project Aims ... 2
1.2 Background ... 2
2. LITERATURE REVIEW ... 5
2.1 Global Warming ... 5
2.2 Energy Production ... 5
2.2.1 Electricity Consumed from the Power Grid... 6
2.2.2 Natural Gas Consumption ... 7
2.3 Global Warming and the Built Environment ... 8
2.4 Air Conditioning Systems ... 10
2.4.1 Variable Air Volume ... 11
2.4.2 Chilled Beams ... 12
2.4.3 Trigeneration ... 13
2.5 Building Code of Australia ... 15
2.6 Modelling Software ... 19
3. PROJECT METHODOLOGY ... 21
3.1 Modelling the Existing Building and the Mechanical Services Systems .... 21
3.1.1 Select Weather Information ... 21
3.1.2 Creation of Rooms ... 22
3.1.2.1 Rooms ... 22
3.1.2.2 Roofs ... 23
3.1.2.3 Walls ... 23
3.1.2.4 Internal Loads ... 25
3.1.2.6 Partition/Floors ... 26
3.1.3 Create Systems ... 27
3.1.3.1 Fans ... 28
3.2 Modelling the BCA 2010 Reference Buildings ... 31
3.3 Modelling the Proposed Upgrades ... 34
3.3.1 Variable Air Volume ... 34
3.3.1.1 Central Air Handling ... 35
3.3.1.2 Floor Air Handling ... 37
3.3.2 Active Chilled Beams ... 39
3.3.2.1 Central Air Handling ... 40
3.3.2.2 Floor Air Handling Plant ... 41
4. ANALYSIS OF RESULTS ... 46
4.1 Actual Usage During Baseline Year ... 46
4.2 Existing Building Calculated Energy Usage ... 47
4.3 Calculated Consumption versus Actual Consumption ... 49
4.4 Existing Building BCA Compliance ... 52
4.5 Upgrade Alternatives Energy Usage ... 54
4.6 Building Code of Australia Compliance ... 73
4.7 Active Chilled Beams versus Variable Air Volume ... 75
4.8 Floor Air Handling Plant Compared to Central Air Handling Plant ... 76
5. CONCLUSION ... 78
5.1 Greenhouse Gas Emissions Saving ... 78
5.2 Building Code of Australia Compliance ... 79
5.3 Buildings of Similar Style and Usage ... 79
5.4 Opportunities for Further Studies ... 80
6. REFERENCES ... 81
APPENDIX A - Project Specification ... 83
APPENDIX B – TRACE 700 Compliance Letter ... 84
APPENDIX C –TRACE700 Modelling Screen Shots ... 85
APPENDIX D – TRACE 700 BRISBANE WEATHER FILES ... 96
APPENDIX E –295 ANN STREET TYPICAL FLOOR PLAN ... 103
APPENDIX F - BCA 2010 Glazing Calculator ... 104
APPENDIX H - Modelling Output for existing building ... 106
APPENDIX I - Modelling Output For Reference Building With Zone Mixing Boxes & Central Air Handling ... 109
APPENDIX J - Modelling Output For Variable Air Volume With Central Air Handling Plant ... 112
APPENDIX K - Modelling Output For Reference Building With Variable Air Volume And Central Air Handling Plant ... 115
APPENDIX L - Modelling Output For Variable Air Volume System With Floor Air Handling Plant ... 118
APPENDIX M - Modelling Output For Reference Building With Variable Air Volume And Floor Air Handling Plant ... 121
APPENDIX N - Modelling Output For Active Chilled Beams With Central Air Handling Plant ... 124
APPENDIX O - Modelling Output For Reference Building With Active Chilled
Beams and Central Air Handling Plant... 127
APPENDIX P - Modelling Output For Active Chilled Beams With Floor Air Handling Plant ... 130
APPENDIX Q - Modelling Output For Reference Building With Active Chilled Beams And Floor Air Handling Plant ... 133
APPENDIX R - Modelling Output For Trigeneration With Zone Mixing Boxes and Central Air Handling ... 136
APPENDIX S - Modelling Output For Trigeneration Combined With Variable Air Volume and Floor Air Handling ... 139
LIST OF FIGURES
Figure 1.1: Typical Air Handling Unit Configuration at 295 Ann Street, Brisbane 3
Figure 1.2: Typical Mixing Box Configuration at 295 Ann Street, Brisbane 4
Figure 2.1: Building Cooling Load Increase Versus Average Temperature Increase 8 Figure 2.2: Building Energy Usage Increase Versus Average Temperature Increase 9 Figure 2.3: Pressure Independent Variable Air Volume Box Configuration 11
Figure 2.4: Active Chilled Beam Configuration 12
Figure 2.5: Trigeneration Process Schematic 14
Figure 3.1: Zone Mixing Box Schematic 27
Figure 3.2: Variable Air Volume System Schematic 35
Figure 3.3: Active Chilled Beam System Schematic 39
Figure 4.1: Actual Electrical Energy Consumption Versus Calculated Electrical Energy Usage 51
Figure 4.2: Calculated Percentage of Actual Consumption 51
Figure 4.3: Existing Building Calculated Greenhouse Gas Emissions Versus BCA2010 Reference Building Emissions 54
Figure 4.4: Calculated Monthly Emissions of a Variable Air Volume System with Central Air Handling, BCA2010 Reference Building and Existing Building 57
Figure 4.6: Calculated Monthly Emissions of an Active Chilled Beams System with
Central Air Handling, BCA2010 Reference Building and Existing Building 63
Figure 4.7: Calculated Monthly Emissions of an Active Chilled Beams System with
Floor Air Handling, BCA2010 Reference Building and Existing Building 66
Figure 4.8: Calculated Monthly Emissions of Trigeneration Combined with Mixing
Boxes and Central Air Handling, BCA2010 Reference Building and Existing Building 68
Figure 4.9: Calculated Monthly Emissions of Trigeneration Combined With Variable
Air Volume Boxes and Floor Air Handling, BCA2010 Reference Building and Existing Building 70
Figure 4.10: Calculated Monthly Emissions of Trigeneration Combined with Active
Chilled Beams and Floor Air Handling Plant, BCA2010 Reference Building and Existing Building 73
Figure 4.11: Calculated Monthly Emissions Comparison Between the Variable Air
Volume Systems and Chilled Beams Systems 75
Figure 4.12: Calculated Monthly Emissions Comparison Between the Variable Air
Volume Alternatives 77
Figure 4.13: Calculated Monthly Emissions Comparison Between Active Chilled
LIST OF TABLES
Table 2.1: 2010 Emissions Factors for States of Australia 6
Table 2.2: Emissions Factors for the Consumption of Natural Gas 7
Table 3.1: Typical Room Properties at 295 Ann Street, Brisbane 23
Table 3.2: Typical Wall Properties at 295 Ann Street, Brisbane 24
Table 3.3: Typical Internal Loads at 295 Ann Street, Brisbane 25
Table 3.4: Outside Air/Infiltration Rates at 295 Ann Street, Brisbane 26
Table 3.5: Partition/Floor Descriptions at 295 Ann Street, Brisbane 26
Table 3.6: Fan Performance Data from Mechanical O&M Manuals 28
Table 3.7: Room to System Assignment for the Existing Building Model 29
Table 3.8: Existing Building Cooling and Heating Plant 30
Table 3.9: Reference Building Wall Thermal Performance 31
Table 3.10: BCA2010 Compliant Glazing for 295 Ann Street, Brisbane 33
Table 3.11: BCA2010 Reference Building Plant Performance 34
Table 3.12: Fan Performance – Variable Air Volume Combined with Central Air Handling 36
Table 3.13: Fan Performance – Variable Air Volume Combined with Floor Air Handling 37
Table 3.15: Fan Performance – Active Chilled Beams with Central Air Handling
Plant 40
Table 3.16: Fan Performance – Active Chilled Beams with Floor Air Handling
Plant 41
Table 3.17: Trigeneration Equipment Schedule 44
Table 4.1: Mechanical Plant Actual Electrical Energy Consumption During Baseline
Year 46
Table 4.2: Calculated Energy Consumption for the Existing Mechanical Plant 47
Table 4.3: Calculated Greenhouse Gas Emissions for the Existing Buildings
Mechanical Plant 49
Table 4.4: Calculated Electrical Energy Consumption Versus Actual Electrical
Energy Consumption 50
Table 4.5: BCA2010 Reference Building Calculated Energy Consumption and
Greenhouse Gas Emissions for the Existing Mechanical Services 53
Table 4.6: Calculated Energy Consumption and Greenhouse Gas Emissions for a
Variable Air Volume System With Central Air Handling 55
Table 4.7: BCA2010 Reference Building Calculated Energy Consumption and Gas
Emissions for a Variable Air Volume System with Central Air Handling 56
Table 4.8: Calculated Energy Consumption and Gas Emissions Associated with a
Variable Air Volume System with Floor Air Handling 58
Table 4.9: BCA2010 Reference Building Calculated Energy Consumption and Gas
Emissions for a Variable Air Volume System with Floor Air Handling 59
Table 4.10: Calculated Energy Consumption and Greenhouse Gas Emissions for
Table 4.11: BCA2010 Reference Building Calculated Energy Consumption and Gas
Emissions for Active Chilled Beams with Central Air Handling 62
Table 4.12: Calculated Energy Consumption and Greenhouse Gas Emissions for
Active Chilled Beams with Floor Air Handling 64
Table 4.13: BCA2010 Reference Building Calculated Energy Consumption and Gas
Emissions for Active Chilled Beams with Floor Air Handling 65
Table 4.14: Calculated Energy Consumption and Greenhouse Gas Emissions for
Trigeneration Combined with Mixing Boxes 67
Table 4.15: Calculated Energy Consumption and Greenhouse Gas Emissions for
Trigeneration Combined with Variable Air Volume and Floor Air Handling 69
Table 4.16: Calculated Energy Consumption and Greenhouse Gas Emissions for
Trigeneration Combined with Active Chilled Beams and Floor Air Handling 71
Table 4.17: BCA2010 Compliance Based on the Calculated Annual Energy
Consumption 74
1.
INTRODUCTION
Since the industrial revolution greenhouse gas emissions in the earth's atmosphere have risen significantly (Preston, Jones, 2006). The radiation absorbed by these gases is re-emitted in all directions resulting in a warming of the earth's surface (Australian Government, 2011).
Energy consumption in buildings is responsible for 26% of Australia's greenhouse gas emissions (CSIRO, 2010). Furthermore the energy consumption associated with a buildings cooling and heating plant typically accounts for over 50% of a buildings total energy usage (CSIRO, 2010). The aims of the project are to analyse, compare and contrast various air conditioning upgrade alternatives for the building 295 Ann Street, Brisbane, to determine which will provide the greatest greenhouse gas emissions savings.
In order to energy model the various upgrade alternatives, the TRACE 700 Load and Energy Analysis software was used. The existing building in its current form was the first system modelled to determine the current energy usage and the associated greenhouse gas emissions. The results were compared with the buildings actual energy usage data to verify the modelling software. Energy models for the seven upgrade alternatives were then modelled to determine the greenhouse gas emissions associated with each. For each alternative a Building Code of Australia reference building was modelled to determine which was compliant with the Building Code of Australia. A reference building is a hypothetical building that is used to calculate the maximum allowable energy load (Australian Building Codes Board, 2010).
1.1
Project Aims
The aims of the project are to analyse, compare and contrast a number of air conditioning upgrade alternatives to determine which will provide the greatest greenhouse gas emissions savings. The study is performed to a building at 295 Ann
Street, Brisbane.
The upgrade alternatives to be analysed include:
Variable air volume system with central air handling plant. Variable air volume system with floor air handling plant. Active chilled beams system with central air handling plant. Active chilled beams system with floor air handling plant. Trigeneration energy production plant combined with zone mixing boxes and central air handling. Trigeneration energy production plant combined with variable air volume and floor air handling plant. Trigeneration energy production plant combined with active chilled beams and floor air handling plant.1.2
Background
295 Ann Street is a 16 storey office building situated in the Brisbane CBD. The building was constructed in 1973 making the mechanical services plant approximately 38 years old. Due to the age and condition of the air conditioning plant, the system is due for replacement.
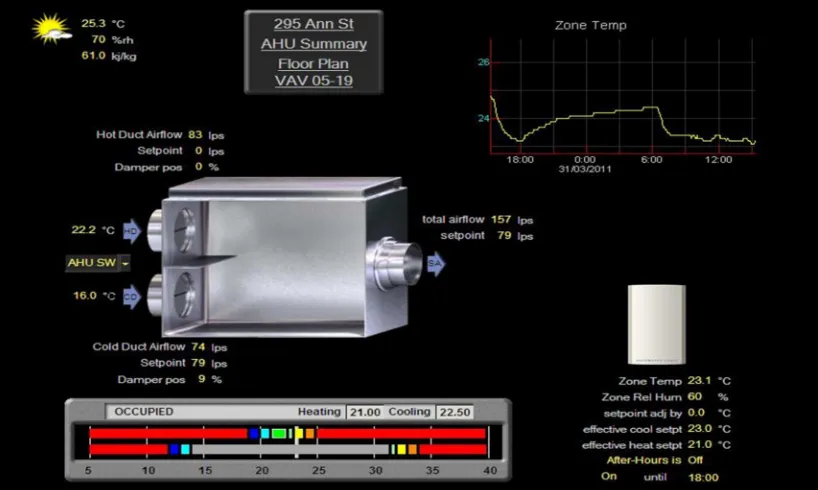
Each of the air handling units consists of a chilled water cooling coil and a hot water heating coil. A cold deck fan and a hot deck fan provide cold and hot supply air to the floor mixing boxes via individual ductwork reticulation systems. A return air fan draws air from the conditioned space and returns it back to the air handling unit. Here the return air mixes with outside air to repeat the process. Figure 1.1 shows a typical air handling unit configuration.
Figure 1.1: Typical Air Handling Unit Configuration at 295 Ann Street, Brisbane
2.
LITERATURE REVIEW
2.1
Global Warming
Global warming is the gradual increase of the Earth’s average surface temperature as a result of greenhouse gases in the atmosphere (Australian Government, 2010). The
earth’s atmosphere contains a natural level of greenhouse gases (Australian Government, 2010). The main constituents include water vapour, carbon dioxide and other important trace gases such as methane, nitrous oxide, ozone and anthropogenic halocarbon compounds (Australian Government, 2011). The radiation absorbed by these gases is re-emitted in all directions resulting in a warming of the earth’s surface (Australian Government, 2011).
Since the industrial revolution, greenhouse gas emissions have risen significantly (Preston, Jones, 2006). Carbon dioxide levels have increased by over 30%, from 280 to 380 parts per million, nitrous oxide has increased by 17% and methane has increased by 151% (Preston, Jones, 2006). The increase of greenhouse gases into the atmosphere is a result of human activities, including:
Burning fossil fuels including coal, oil and gas (Australian Government, 2010). Using energy generated by burning fossil fuels (Australian Government, 2010). Various aspects of farming such as raising livestock, using fertilisers and growing crops (Australian Government, 2010). Clearing land (Australian Government, 2010). Various industrial processes (Australian Government, 2010).2.2
Energy Production
In Australia, the principal greenhouse gas generated by energy production is carbon dioxide (CO2), (Australian Government, July 2010). Methane, nitrous oxide and
2.2.1 Electricity Consumed from the Power Grid
Emission factors are used for calculating the total emissions generated as a result of energy production. Emission factors are expressed in the form of a quantity of emitted greenhouse gas per unit of energy (kg CO2-e/kW). All emitted greenhouse
gases are expressed as a carbon dioxide equivalent (kg CO2-e/kW), (Australian
Government, July 2010).
There are three categories used to report the types of emissions generated being Scope 1, Scope 2 and Scope 3.
Scope 1 emissions are direct or point source, for example emissions from a manufacturing process, mining activity or onsite waste disposal (Australian Government, July 2010). Scope 2 emissions are indirect and are used to describe the emissions from the generation of purchased and consumed electricity by an organisation (Australian Government, July 2010). Scope 3 emissions are those attributed to the losses within the electricity distribution network (Australian Government, July 2010).
Due to the varying fuels used for the production of energy within Australia, emissions factors vary from state to state. Table 2.1 details the latest estimated Scope 2 & 3 emissions factors for each state of Australia.
Table 2.1: 2010 Emissions Factors for States of Australia (Australian Government, July 2010)
Location EF for Scope 2
(kg CO2-e/kWh)
EF for Scope 3
(kg CO2-e/kWh)
EF for Scope 2 +
EF for Scope 3
(kg CO2-e/kWh)
Victoria 1.23 0.14 1.37
Queensland 0.89 0.13 1.02
South Australia 0.72 0.13 0.85
Western Australia 0.82 0.10 0.93
Northern
Territory
0.68 0.09 0.77
From Table 2.1, it can be concluded that Queensland’s emissions factors are poor in comparison with other states of Australia and needs to be improved. This can be done by investigating more efficient means for producing and distributing energy throughout the state.
2.2.2 Natural Gas Consumption
The combustion of natural gas is an option for energy consumption within buildings. The emissions factors for the consumption of natural gas distributed in a pipeline are detailed in Table 2.2.
Table 2.2: Emissions Factors for the Consumption of Natural Gas (Australian Government, July
2010)
Fuel Combusted Emission Factor (kg CO2-e/GJ)
CO2 CH4 N2O
Natural Gas Distributed in a Pipeline 51.2 0.1 0.03
The following formula is used to estimate the greenhouse gas emissions from the
combustion of gaseous fuels:
= × ... (i) (Australian Government, July 2010)
Where,
E, is the emissions of the respective gas type (kg CO2-e).
Q, is the quantity of fuel type (GJ).
2.3
Global Warming and the Built Environment
Energy consumption in buildings is responsible for 26% of Australia’s greenhouse gas emissions (CSIRO, 2010). Furthermore, the energy consumption associated with a buildings cooling and heating plant typically accounts for over 50% of the buildings total energy usage (CSIRO, 2010).
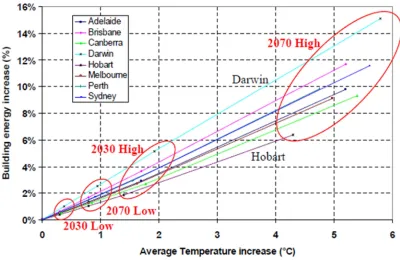
In 2006 Lishan Guan undertook a research project titled “The Implications of Global Warming on the Energy Performance and Indoor Thermal Environment of Air-Conditioned Office Buildings in Australia”. Results of her research showed that there is a near linear relationship between the increase of ambient air temperatures and the increase of building energy use (Guan, 2006).
Figure 2.1 and 2.2, shows the effects of global warming on a buildings cooling load and the total building energy use in cities throughout Australia.
Figure 2.2: Building Energy Usage Increase versus Average Temperature Increase (Guan, 2006)
From Figures 2.1 and 2.2 it can be seen that building energy consumption is proportional to the ambient air temperature and global warming. As a result a cycling effect is evident. Global warming leads to greater building energy loads, which causes more greenhouse gas emissions, which leads to global warming. As building
air conditioning systems account for a large proportion of greenhouse gas emissions, alternate energy efficient air conditioning systems should be investigated and analysed.
A recommendation for future research from “The Implications of Global Warming on the Energy Performance and Indoor Thermal Environment of Air-Conditioned Office Building in Australia” is to undertake a study of air conditioning systems selection
2.4
Air Conditioning Systems
As detailed in Section 2.3, energy consumption in buildings is responsible for 26% of Australia’s greenhouse gas emissions with 50% of the emissions associated with the air conditioning plant (CSIRO, 2010).
The cooling requirements of a building are dependent on a variety of factors which include but are not limited to the following:
The climate zone the building is situated (Bhatia, 2011). The required space temperature (Bhatia, 2011). The type of construction and the thermal properties of the building fabric (Bhatia, 2011). The building orientation and how much shade is on the building (Bhatia, 2011). The physical size of the building to be conditioned (Bhatia, 2011). The quantity of ambient air infiltration into the building (Bhatia, 2011). The occupancy levels of the building (Bhatia, 2011). Activities undertaken within the building (Bhatia, 2011). Amount and type of lighting within the building (Bhatia, 2011).Due to the wide variety of factors which affect the cooling requirements of a building it can be said that no two buildings are the same and each buildings has its own unique characteristics. As a result when determining heat loads and selecting the most energy efficient equipment it should be done on a case by case basis, as an appropriate selection for one building may not be the most appropriate for another.
The below subsections detail the air conditioning systems which are to be
investigated in detail. The systems include:
Variable air volume, Active Chilled beams,2.4.1 Variable Air Volume
A variable air volume (VAV) air conditioning system varies the quantity of supply air to meet the changing load conditions of the space (Trane, 2001). A VAV system is typically made up of the following main components:
An air handling unit consisting of a variable speed supply air fan (Trane, 2001). A minimum of one variable air volume box downstream of the air handling unit. The primary components of the variable air volume box include an air modulation device such as a rotating blade damper, and control hardware (Trane, 2001). A thermostat dedicated to each variable air volume box (Trane, 2001).There are two main control strategies for variable air volume boxes being pressure dependant and pressure independent control. Pressure dependant systems use the space temperature to control the position of the modulating device. The quantity of supply air delivered to the space is dependent on the static pressure within the duct and the position of the modulating device (Trane, 2001). A pressure independent unit controls the actual supply air delivered to the space utilising a velocity sensor in the supply air stream. Pressure independent variable air volume devices are the most popular form of control (Trane, 2001).
Figure 2.3: Pressure Independent Variable Air Volume Box Configuration (Trane,
[image:24.595.153.498.497.698.2]There are two primary advantages associated with using a variable air volume system. The first is the system’s ability to provide both fan and refrigeration part load energy savings. When the cooling demand is minimal within the space the damper modulates closed which creates an opportunity to reduce the speed of the fan which reduces fan energy. This reduced airflow across the cooling coil reduces the energy demand on the refrigeration system thus saving energy in the main cooling plant (Trane, 2001).
The second advantage associated with variable air volume systems is the improved comfort control. The system is capable of providing control to many spaces with varying cooling and heating requirements utilising one air handling unit fan and a variable air volume box to each individual space.
2.4.2 Chilled Beams
There are two main types of chilled beam air terminal devices namely active and passive (AIRAH, 2011). An active chilled beam utilises primary supply air for inducing room air over the chilled beam heat exchanger (AIRAH, 2011). It can be seen in Figure 2.4 that primary air is delivered to the mixing chamber through the primary air nozzles. This induces air from the conditioned space to rise through the secondary heat exchanger and mix with the primary air in the mixing chamber. The mixed air is then delivered to the space as supply air (AIRAH, 2011).
A passive chilled beam has no direct supply air and relies on the room’s natural air convection (Rumsey, Weale, 2011). Warm air rises to the beams coils, causing the air to cool and fall into the occupied zone (Rumsey, Weale, 2011). Passive chilled beams can handle low ventilation requirements and are less flexible than active
technology (Rumsey, Weale, 2011). As a result active chilled beams will be used in this energy analysis.
The advantages associated with chilled beam technology include:
Chilled beams use higher chilled water temperatures than conventional systems. A chiller dedicated to chilled beams has a lower temperature lift and can operatewith a 15-20% higher efficiency (Roth, Dieckmann, Zogg, Brodrick, 2007).
The combination of higher chilled water temperatures and the fact active chilled beams entrain large quantities of room air greatly reduces the need for energy consuming reheat of the cooled air (Roth, Dieckmann, Zogg, Brodrick, 2007). Chilled beams reduce ventilation fan energy consumption (Roth, Dieckmann, Zogg, Brodrick, 2007).A study of the energy performance of active chilled beams and variable air volume systems for a building in Sydney found similar energy performances for the two buildings (Roth, Dieckmann, Zogg, Brodrick, 2007). During the summer months, the chilled beams system consumed less energy than the variable air volume system but during the winter months consumed more because of the reduced quantity of supply air precluded the use of an air side economizer (Roth, Dieckmann, Zogg, Brodrick, 2007). Studies of other buildings in Australia found that the energy impact varied appreciably depending on the specifics of the given project (Roth, Dieckmann, Zogg, Brodrick, 2007).
2.4.3 Trigeneration
useful heat can be either used for heating or transformed into cooling energy by an absorption chiller (Australian Government, 2010).
Absorption chillers use heat in lieu of mechanical energy to provide cooling. A thermal compressor consists of an absorber, a generator, a pump and a throttling device and replaces the mechanical vapour compressor (REI, 2011). Absorption chillers have a low coefficient of performance (capacity output divided by the energy
input) in comparison to typical mechanical chillers. Although they have a poor coefficient of performance they can substantially reduce operating costs because they are powered by low grade waste heat from the gas turbine (REI, 2011).
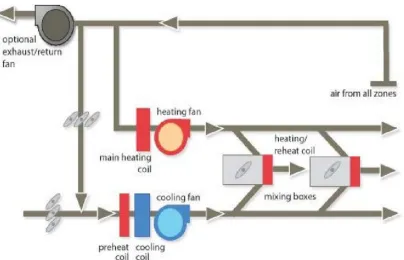
Figure 2.5, shows a typical trigeneration schematic. From this diagram it can be seen that natural gas supplies the generator and boiler. Electrical power is provided to the building from two sources being the electrical grid and the generator. Waste heat
from the generator can be used for both heating and cooling as necessary.
Figure 2.5: Trigeneration Process Schematic (Clinch, R, Selth, J, 2009)
The advantages of a trigeneration system is that it can make use of 70-75% of the energy in the original fuel, in comparison to a conventional coal fired power station
2.5
Building Code of Australia
The objective of Section J of the Building Code of Australia is to reduce building greenhouse gas emissions (Australian Building Codes Board, 2010). In order to reduce greenhouse gas emissions a building including its services must have features that facility the efficient use of energy (Australian Building Codes Board, 2010).
The Building Code of Australia (BCA) 2010 was effective from the 1 May 2010 and was superseded by the BCA2011 on the 1 May 2011 (Australian Building Codes Board, 2010). As this research project commenced prior to the 1 May 2011, the BCA2010 was adopted as the defining code for this research project.
For a building to comply with Section J of the BCA2010, it can be done so in one of two ways. The first is complying with the Deemed-to-Satisfy Provisions detailed
within Parts J1 to J7. The title of each of these parts is listed below:
Part J1: Building Fabric. Part J2: Glazing. Part J3: Building Sealing. Part J4: Not defined in BCA2010 Part J5: Air-Conditioning and Ventilation Systems. Part J6: Artificial Lighting and Power. Part J7: Hot Water Supply and Swimming Pool and Spa Pool Plant.Parts J1 to J7 can be categorised into two categories being building envelope requirements and building services requirements (Australian Building Codes Board, 2010). Parts J1, J2 and J3 make up the building envelope requirements while Parts J5, J6 and J7 make up the building services requirements.
(i) The proposed building is modelled with the proposed services; and
(ii) The proposed building is modelled with the same services as the reference building (Australian Building Codes Board, 2010).
As detailed above verification using a reference building compares the annual energy consumptions of the proposed building with the annual energy consumption of the reference building. As the objective of the Building Code of Australia is to reduce greenhouse gas emissions, for this research project, annual greenhouse gas emissions will be compared instead of annual energy consumption. This will provide a more accurate analysis as to which upgrade is the most energy efficient in terms of which emits the least greenhouse gases. Gas and electrical energy consumptions will be
converted to greenhouse gas emissions using the formulas described in Chapter 2.2 of this report.
As defined by the Building Code of Australia 2010, a reference building is a hypothetical building that is used to calculate the maximum allowable annual energy load, or maximum allowable annual energy consumption for the proposed building (Australian Building Codes Board, 2010). The Deemed-to-Satisfy Provisions from
Parts J1 to J7 are to be used to model the reference buildings. A further description of these performance requirements are detailed later in this section.
As 295 Ann Street Brisbane is an existing building with an age of approximately 38 years, the existing building envelope and building services do not comply with the Deemed-to-Satisfy Provisions. Due to the size and age of the building it would be unfeasible to upgrade the building envelope to comply with the Deemed-to-Satisfy
Provisions. This would involve replacing all the single pane glass with double pane glass, and insulating all external walls and roofs. For this reason verification using a reference building will be used to assess the compliance of the upgrade alternatives modelled throughout this research project.
The implications of not upgrading the building envelope result in the proposed building using more energy than the reference buildings when the proposed building
This is due to the reference building being modelled with a Deemed-to-Satisfy envelope and services, while comparing this to the proposed building with a non-compliant envelope and Deemed-to-Satisfy services. For this reason, to determine BCA compliance for an existing building the proposed building will be modelled
with the proposed services as per requirement (i).
The main performance requirements of the BCA2010 reference building are summarised below:
Roof thermal resistance (R-Value) of 4.2 for a building in climate zone 2 (Australian Building Codes Board, 2010). Wall thermal resistance (R-Value) of 3.3 for a building in climate zone 2 (Australian Building Codes Board, 2010). Have an outdoor air economy cycle when the air conditioning unit capacity is over 50 kWr (Australian Building Codes Board, 2010). A gas boiler shall have a minimum gross thermal efficiency of 80% when the rated capacity is not more than 750 kW (Australian Building Codes Board, 2010). A Minimum energy efficiency ratio for refrigerant chillers of 4.2 under full load operation (Australian Building Codes Board, 2010). A solar absorptance of 0.6 for external walls and 0.7 for roofs (Australian Building Codes Board, 2010). For perimeter zones an air infiltration value of 1 air change per hour (Australian Building Codes Board, 2010).× + × + × + × + × + ×
... (2), (Australian Building Codes Board, 2010).
Where,
A1,2= the area of each glazing element
CA, B and C= the energy constants A, B and C for the specific orientation.
SHGC 1,2, etc= the shading glass coefficient of each glazing element
SH1,2, etc = the heating shading multiplier for each glazing element obtained from the BCA2010.
SC1,2, etc = the cooling shading multiplier for each glazing element obtained from the BCA2010.
U1,2= the area of each glazing element
The Building Code of Australia website provides an excel spread sheet to perform equation (2).
For consistency between the proposed building model and reference building model, section JV3, (d),(ii) of the Building Code of Australia 2010 details the features which are required to be kept consistent between the reference building and the proposed building model. One of the items includes the air conditioning system configuration and zones shall be kept consistent between the two models. As a result for each upgrade alternative a reference building shall be modelled with the same air conditioning system configurations and zones.
2.6
Modelling Software
The energy modelling software package being used for this analysis is TRACE 700 version 6.2. Trace 700 is a load, system, energy and economic analysis program. The software has the ability to analyse architectural features, heating, ventilation and air conditioning systems, building utilisation, scheduling and economic options (Trane, 2011).
As required by the Australian Building Codes Board (ABCB), TRACE 700 version 6.2.6 has been tested in compliance with ANSI/ASHRAE Standard 140-2007, Standard Method of Test for the Evaluation of Building Energy Analysis Computer Programs (Trane, 2011). To comply with this standard the software passed the BESTEST which compared the program with similar analysis programs. A letter verifying this compliance can be seen in Appendix B.
In order to gain a full appreciation of the software results it is necessary to understand the software’s limitations. The limitations which have been identified include:
it cannot be determined which system provides more consistent temperatures and air distribution, and which has a higher level of occupancy comfort.
3.
PROJECT METHODOLOGY
This Chapter details the project methodology and tasks required to undertake this research. Each of the major tasks and milestones are detailed in the following sub headings.
3.1
Modelling the Existing Building and the Mechanical Services
Systems
The first stage of the energy analyses was to model the existing building and the air conditioning systems within the building. This step determined the energy efficiency of the existing mechanical systems and provided a reference point to compare the upgrade alternatives to. Information used to model the existing building and its services was gathered from site audits, the buildings operation and maintenance manuals, as-installed drawings and the Building Management System (BMS). The below subsections detail the steps involved to model the existing systems. Appendix C contains screenshots of the TRACE 700 software for the existing building model.
3.1.1 Select Weather Information
As described in Section 2.4 climate greatly affects the energy consumption of buildings mechanical services. TRACE 700 has inbuilt weather files for a range of locations throughout the world. Information stored within these files includes:
Maximum outside air dry bulb. Maximum outside air wet bulb. Humidity ratio. Cloud Cover Modifier. Wind speed.The building modelled is located at 295 Ann Street in the Brisbane CBD and as a result the Brisbane weather file was selected. Appendix D displays the Brisbane weather file which was used for this assessment.
3.1.2 Creation of Rooms
In order to model the existing building each floor was split into 18 individual rooms. Each level was assumed to be typical in terms of layout, construction and occupancy. The floor was divided into rooms by assuming one air mixing box was dedicated to each room thereby creating 18 rooms. Appendix E contains a typical floor plan which shows the segregation of the rooms. The subsections below detail the modelling associated with each room.
3.1.2.1 Rooms
The rooms sub-tab was used to define the following room properties:
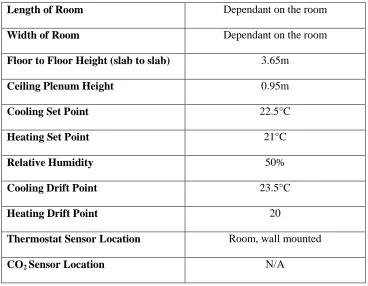
The length and width of the room. The height of the room including the slab to slab height and the ceiling plenum height. The cooling temperature set point. The heating temperature set point. Relative humidity set point. Cooling drift point which is the maximum range at which the temperature shall deviate from set point. The heating drift point which is the maximum range at which the temperature shall deviate from set point. The thermostat and CO2 sensor positions.Table 3.1: Typical Room Properties at 295 Ann Street, Brisbane
Length of Room Dependant on the room Width of Room Dependant on the room Floor to Floor Height (slab to slab) 3.65m
Ceiling Plenum Height 0.95m
Cooling Set Point 22.5°C
Heating Set Point 21°C
Relative Humidity 50%
Cooling Drift Point 23.5°C
Heating Drift Point 20
Thermostat Sensor Location Room, wall mounted
CO2 Sensor Location N/A
The set points detailed in Table 3.1 were obtained from the Building Management System.
3.1.2.2 Roofs
The roofs sub-tab was used to input the roof construction and the associated thermal properties. As the top floor of 295 Ann Street is a non air conditioned plant room the thermal properties of the roof does not affect the energy consumption within the
building.
3.1.2.3 Walls
The walls sub-tab was used to define the wall construction, direction and thermal properties of all external walls. The following properties were defined within the walls tab:
Typical wall and glass properties within the building are detailed in Table 3.2.
Table 3.2: Typical Wall Properties at 295 Ann Street, Brisbane
Direction of Wall Dependant on the room The Length of Wall Dependant on the room
Height of Wall 3.65m
External Wall Construction 200mm concrete lined with 20mm of plaster
Heat Transfer Coefficient
(U-Factor) of External Walls
1.4479 W/m2°C
Length of Glass Within Wall Dependant on the room
Height of Glass 1.76m
Type of Glass Single Clear 1/8”
Heat Transfer Coefficient
(U-Factor) of Glass
5.9 W/m2°C
Shading Coefficient of Glass 0.8
3.1.2.4 Internal Loads
The internal loads sub-tab was used to define the internal loads within each room. These internal loads include:
The occupancy levels and the activities being undertaken by occupants. Number of workstations per person. The type of lighting and the lighting heat gain within the room. Any miscellaneous loads within the roomThe typical internal loads are detailed in Table 3.3.
Table 3.3: Typical Internal loads at 295 Ann Street, Brisbane
People Activity Office
People Density 10 sq m/person
Workstation Density 1 workstation/person Lighting Type Fluorescent, 100% load to space Heat Gain From Lighting 15 W/m2
AS 1668.2-1991, The Use of Mechanical Ventilation and Air-Conditioning in Buildings states that for an office building the typical floor area per person is 1 person per 10m2 (Standards Australia, 1991). The people density in Table 3.3 is based on this standard. The lighting heat gain of 15 W/m2 was an assumption made based on typical industry figures from the period the building was constructed.
3.1.2.5 Airflows
Table 3.4: Outside Air/Infiltration Rates at 295 Ann Street, Brisbane
Ventilation in Cooling Mode 10 L/s/person Ventilation in Heating Mode 10 L/s/person Infiltration in Cooling Mode 1 air change/hour Infiltration in Heating Mode 1 air change/hour
The outside air rates detailed in Table 3.4 were obtained from the mechanical operation and maintenance manuals. The infiltration rate of 1 air change/hour was an assumption made and is consistent with the requirements of the BCA.
3.1.2.6 Partition/Floors
The Partition/Floors sub-tab was used to nominate partition walls and floors which affect the heat load of a space. A partition wall is a wall which divides an air conditioned space from a non air conditioned space thereby resulting in heat transfer from one room to another. A wall which divides a conditioned room from another conditioned room of same temperature is not deemed to be a partition as there will be no heat transfer between spaces.
For the 295 Ann Street model the only partition wall is that between the office space and the building core. On ground level the floor was modelled as a partition as it divides the air conditioned ground floor with the non air conditioned plant room level below. Similarly, the level 16 floor was modelled as a partition as it divides the air conditioned level 15 from the non air conditioned plant room on level 16. Details of each partition can be seen in Table 3.5.
Table 3.5: Partition/Floors Descriptions at 295 Ann Street, Brisbane
Partition Wall Construction 8” concrete block Partition Wall Heat Transfer Coefficient (U-Factor) 2.288 W/m2°C
Slab Construction 12” Concrete
The heat transfer coefficients detailed in Table 3.5 were obtained by selecting the appropriate construction type scheduled within the TRACE 700 program. These construction types were identified during a site inspection of the premises.
3.1.3 Create Systems
[image:40.595.119.523.422.682.2]The create system tab was the location to select and define the air side system. As described earlier in this report the air distribution subsystem in the existing building consists of eight central air handling units. Each of the air handling units consists of a chilled water cooling coil and a hot water heating coil. A cold deck fan and a hot deck fan provide cold and hot supply air to the floor mixing boxes via individual ductwork reticulation systems. A return air fan draws air from the conditioned space and returns it back to the air handling unit. Here the return air mixes with outside air to repeat the process. A schematic of a zone mixing box system can be seen in Figure 3.1.
3.1.3.1 Fans
For each of the 8 air distribution systems, fan performance data was entered into the fans sub-tab. The fan information was obtained from the buildings operation and maintenance manuals. The performance data for the cooling, heating and return air fans for each system are summarised in Table 3.6.
Table 3.6: Fan Performance Data from Mechanical O&M Manuals
System
Description Fan Fan Type
Static Pressure
Drop
AHU NW (Level 1-7)
Cooling Supply Centrifugal, variable speed motor 650 Pa Heating Supply Axial fan, variable speed motor 650 Pa Return Air Fan Axial fan, variable speed motor 395 Pa
AHU NE (Levels 1-7)
Cooling Supply Centrifugal, variable speed motor 450 Pa Heating Supply Axial fan, variable speed motor 450 Pa Return Air Fan Axial fan, variable speed motor 315 Pa
AHU SW (Levels 1-7)
Cooling Supply Centrifugal, variable speed motor 430 Pa Heating Supply Axial fan, variable speed motor 430 Pa Return Air Fan Axial fan, variable speed motor 320 Pa
AHU SE (Levels 1-7)
Cooling Supply Centrifugal, variable speed motor 440 Pa Heating Supply Axial fan, variable speed motor 440 Pa Return Air Fan Axial fan, variable speed motor 300 Pa
AHU NW (Levels 8-15)
Cooling Supply Centrifugal, variable speed motor 500 Pa Heating Supply Axial fan, variable speed motor 500 Pa Return Air Fan Axial fan, variable speed motor 380 Pa
AHU NE (Levels 8-15)
AHU SW (Levels 8-15)
Cooling Supply Centrifugal, variable speed motor 445 Pa Heating Supply Axial fan, variable speed motor 445 Pa Return Air Fan Axial fan, variable speed motor 390 Pa
AHU SE (Levels 8-15)
Cooling Supply Centrifugal, variable speed motor 520 Pa Heating Supply Axial fan, variable speed motor 520 Pa Return Air Fan Axial fan, variable speed motor 380 Pa
3.1.4 Assign Rooms to Systems
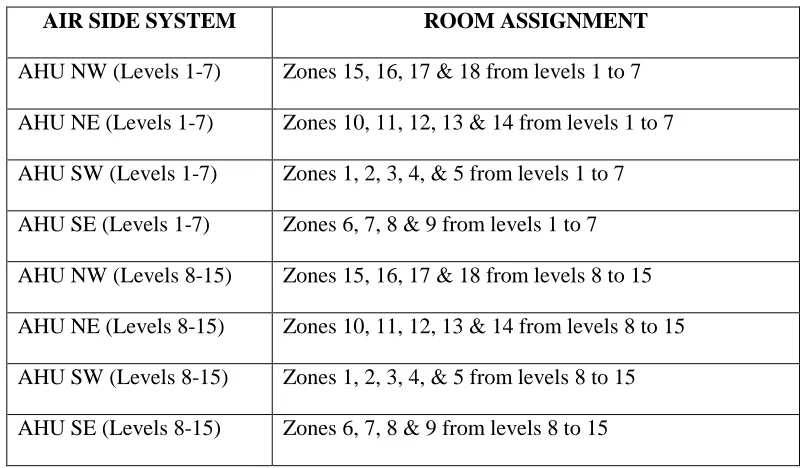
[image:42.595.110.513.353.587.2]The purpose of the assign rooms to system tab was to define the rooms each airside system serves. Table 3.7 details the room assignments used throughout this model.
Table 3.7: Room to System Assignment for the Existing Building Model
AIR SIDE SYSTEM ROOM ASSIGNMENT
AHU NW (Levels 1-7) Zones 15, 16, 17 & 18 from levels 1 to 7 AHU NE (Levels 1-7) Zones 10, 11, 12, 13 & 14 from levels 1 to 7 AHU SW (Levels 1-7) Zones 1, 2, 3, 4, & 5 from levels 1 to 7 AHU SE (Levels 1-7) Zones 6, 7, 8 & 9 from levels 1 to 7 AHU NW (Levels 8-15) Zones 15, 16, 17 & 18 from levels 8 to 15 AHU NE (Levels 8-15) Zones 10, 11, 12, 13 & 14 from levels 8 to 15 AHU SW (Levels 8-15) Zones 1, 2, 3, 4, & 5 from levels 8 to 15 AHU SE (Levels 8-15) Zones 6, 7, 8 & 9 from levels 8 to 15
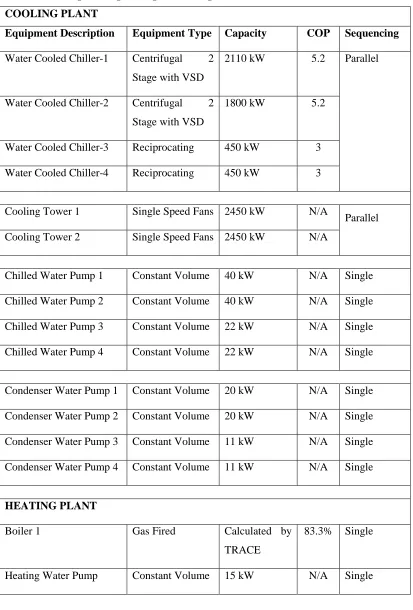
3.1.5 Create Plants
The main cooling and heating plants were created and defined in the create plants tab. A summary of the cooling and heating plants existing within the building are detailed in Table 3.8. This information was obtained from the buildings operation and
Table 3.8: Existing Building Cooling and Heating Plant
COOLING PLANT
Equipment Description Equipment Type Capacity COP Sequencing
Water Cooled Chiller-1 Centrifugal 2 Stage with VSD
2110 kW 5.2 Parallel
Water Cooled Chiller-2 Centrifugal 2 Stage with VSD
1800 kW 5.2
Water Cooled Chiller-3 Reciprocating 450 kW 3 Water Cooled Chiller-4 Reciprocating 450 kW 3
Cooling Tower 1 Single Speed Fans 2450 kW N/A
Parallel Cooling Tower 2 Single Speed Fans 2450 kW N/A
Chilled Water Pump 1 Constant Volume 40 kW N/A Single Chilled Water Pump 2 Constant Volume 40 kW N/A Single Chilled Water Pump 3 Constant Volume 22 kW N/A Single Chilled Water Pump 4 Constant Volume 22 kW N/A Single
Condenser Water Pump 1 Constant Volume 20 kW N/A Single Condenser Water Pump 2 Constant Volume 20 kW N/A Single Condenser Water Pump 3 Constant Volume 11 kW N/A Single Condenser Water Pump 4 Constant Volume 11 kW N/A Single
HEATING PLANT
Boiler 1 Gas Fired Calculated by
TRACE
83.3% Single
3.1.6 Assign Systems to Plants
The final stage in the modelling process was to assign the air side systems to the main cooling and heating plants. Systems were assigned to plants by assigning all the cooling coils to the main cooling plant and all heating coils to the heating plant.
3.2
Modelling the BCA 2010 Reference Buildings
As described in Section 2.5 of this report, in order to assess if a building is compliant with the Building Code of Australia 2010, its proposed greenhouse gas emissions must be compared with that of a reference building. A reference building is a hypothetical building that is used to calculate the maximum allowable greenhouse gas emissions for the proposed building. The following subsections detail the modelling of the reference buildings.
3.2.1 Wall Thermal Performance Values
Table 3.9 details the difference in the wall thermal performance values between the
existing building and the reference building. The reference building performance values were obtained from Part J1 of the Building Code of Australia 2010, which is
the Building Fabric Deemed-to-Satisfy Provisions.
Table 3.9: Reference Building Roof and Wall Thermal Performance
Existing Building
Value
Reference Building Value
Wall Heat Transfer Coefficient
(U-Value)
1.4479 W/m2°C 0.303 W/m2°C
Wall Solar Absorptance 0.9 0.6
Infiltration Rates 1 air changes/hour 1 air change/hour
3.2.2 Glazing
To determine the glazing performance of the reference building, the BCA2010 glazing calculator was used. The calculator performs equation (2) detailed in Section 2.5 of this report. The following data was required to be inputted into the spread sheet in order to perform the calculation:
The facade area in each direction. The height and width of each glazing element. The thermal performance of the glass including the heat transfer coefficient and the glass shading coefficient. Dimensions of the physical shading around the windows including overhangs and reveals. The climate zone of which the building is located.Appendix F contains the glazing calculator using the existing buildings glass properties. As all floors are typical the calculation has been performed for one level only. It can be seen in the far right hand column of the spread sheet that the glass does not comply due to:
The aggregate air conditioning energy value attributed to the glazing in the north-western direction is 163% of the allowable quantity. The aggregate air conditioning energy value attributed to the glazing in the north-eastern direction is 201% of the allowable quantity. The aggregate air conditioning energy value attributed to the glazing in the south-western direction is 115% of the allowable quantity. The aggregate air conditioning energy value attributed to the glazing in the south-eastern direction is 131% of the allowable quantity.As described earlier, the allowable energy value associated with the glazing is obtained by multiplying the facade area exposed to the conditioned space by the energy index. The energy index for a building in climate zone 2 is 0.173.
performance is increased until the aggregate air conditioning energy value is 100% of the allowable quantity. The glazing calculator is presented in Appendix G and the compliant glass properties detailed in Table 3.10.
Table 3.10: BCA2010 Compliant Glazing for 295 Ann Street, Brisbane
Aspect Heat Transfer Coefficient
(U-Value)
Shading Coefficient (SHGC)
North-West 3.4 0.48
North-East 3.4 0.4
South-West 3.4 0.69
South-East 3.4 0.61
3.2.3 System and Plant Level
Section JV3, d, (ii) of the BCA2010 requires that the proposed building and the
reference building be modelled with the same air conditioning system configuration and zones. As a result, for this project a reference building was modelled for the following system configurations:
Mixing box with central air handling plant. Variable air volume with central air handling plant. Variable air volume with floor air handling plant. Active chilled beams with central air handling plant. Active chilled beams with floor air handling plant.As described in Section 2.4.3, trigeneration is an energy production plant rather than an air conditioning system. The trigeneration alternatives modelled as part of this research project are in combination with the air conditioning systems listed above. For this reason a separate reference building was not required to be modelled for the trigeneration alternatives as the reference buildings detailed above will be suitable.
Table 3.11: BCA2010 Reference Building Plant Performance
Existing Building
Value
Reference Building Value
Airside System Economiser None Outdoor air economy cycle
Boiler Efficiency 83% 80%
Chiller Coefficient of
Performance (COP)
5.2 & 3 4.2
It can be seen in Table 3.11, that the existing building has chillers with better energy efficiency than that required by the reference building. The existing buildings chillers have a coefficient of performance (COP) of 5.2 & 3 in comparison to the reference building with a COP of 4.2.
3.3
Modelling the Proposed Upgrades
After modelling the existing building and the Building Code of Australia reference buildings the proposed upgrades were modelled. The below subsections describes the modelling of the proposed upgrades.
3.3.1 Variable Air Volume
Figure 3.2: Variable Air Volume System Schematic
For a high rise application such as 295 Ann Street, a variable air volume system can be configured in two ways. The first configuration is central air handling plant. An air handling plant is made up of the primary fan, cooling coil and heating coil. The air handling plant shall be located in a centralised plant room and serve the same zones over a number of floors.
The second configuration is floor air handling plant. This configuration involves an air handling unit being located on each floor with one air handling unit serving the entire floor. The supply air fan on each floor shall provide supply air to the 18 variable air volume boxes on the respective floor. Both of these configurations have been modelled as part of this assessment and are detailed in the sub sections below.
3.3.1.1 Central Air Handling
the north-east, south-east, south-west and north-west zones on levels ground to 7 inclusive.
In order to model this upgrade alternative the rooms and plants created in the existing building model were copied for continuity between the files. Eight variable air volume systems were then created under the systems tab as per Table 3.12.
Table 3.12: Fan Performance – Variable Air Volume Combined With Central Air Handling
System
Description Fan Fan Type
Static
Pressure
Drop
AHU NW
(Level 1-7)
Cooling Supply Centrifugal, variable speed motor 650 Pa Return Air Fan Axial fan, variable speed motor 395 Pa
AHU NE
(Levels 1-7)
Cooling Supply Centrifugal, variable speed motor 450 Pa Return Air Fan Axial fan, variable speed motor 315 Pa
AHU SW
(Levels 1-7)
Cooling Supply Centrifugal, variable speed motor 430 Pa Return Air Fan Axial fan, variable speed motor 320 Pa
AHU SE
(Levels 1-7)
Cooling Supply Centrifugal, variable speed motor 440 Pa Return Air Fan Axial fan, variable speed motor 300 Pa
AHU NW
(Levels 8-15)
Cooling Supply Centrifugal, variable speed motor 500 Pa Return Air Fan Axial fan, variable speed motor 380 Pa
AHU NE
(Levels 8-15)
Cooling Supply Centrifugal, variable speed motor 510 Pa Return Air Fan Axial fan, variable speed motor 380 Pa
AHU SW
(Levels 8-15)
Cooling Supply Centrifugal, variable speed motor 445 Pa Return Air Fan Axial fan, variable speed motor 390 Pa
AHU SE
(Levels 8-15)
The fan static pressure drop used in this system was the same as that used in the existing building. This is assuming duct is sized efficiently and similar duct runs are used for the upgraded system. It can be seen in Table 3.12 that the variable air volume system contains only a cooling supply fan and a return air fan, in comparison
to the existing mixing box system which also contains a heating supply fan.
3.3.1.2 Floor Air Handling
In order to model a variable air volume system with floor air handling plant the rooms and plants created in the existing building model were copied for continuity. As there shall be an air handling unit dedicated to each floor, sixteen variable air volume systems were created under the systems tab. Similar to the existing building model fan performances were detailed in the fans sub-tab and are summarised in Table 3.13.
Table 3.13: Fan Performance - Variable Air Volume Combined With Floor Air Handling
System
Description Fan Fan Type
Static Pressure
Drop AHU Ground Supply Air Fan Centrifugal, variable speed motor 448 Pa
AHU Level 6 Supply Air Fan Centrifugal, variable speed motor 448 Pa Return Air Fan Centrifugal, variable speed motor 312 Pa AHU Level 7 Supply Air Fan Centrifugal, variable speed motor 448 Pa Return Air Fan Centrifugal, variable speed motor 312 Pa AHU Level 8 Supply Air Fan Centrifugal, variable speed motor 448 Pa Return Air Fan Centrifugal, variable speed motor 312 Pa AHU Level 9 Supply Air Fan Centrifugal, variable speed motor 448 Pa Return Air Fan Centrifugal, variable speed motor 312 Pa AHU Level 10 Supply Air Fan Centrifugal, variable speed motor 448 Pa Return Air Fan Centrifugal, variable speed motor 312 Pa AHU Level 11 Supply Air Fan Centrifugal, variable speed motor 448 Pa Return Air Fan Centrifugal, variable speed motor 312 Pa AHU Level 12 Supply Air Fan Centrifugal, variable speed motor 448 Pa Return Air Fan Centrifugal, variable speed motor 312 Pa AHU Level 13 Supply Air Fan Centrifugal, variable speed motor 448 Pa Return Air Fan Centrifugal, variable speed motor 312 Pa AHU Level 14 Supply Air Fan Centrifugal, variable speed motor 448 Pa Return Air Fan Centrifugal, variable speed motor 312 Pa AHU Level 15 Supply Air Fan Centrifugal, variable speed motor 448 Pa Return Air Fan Centrifugal, variable speed motor 312 Pa
Table 3.14: Floor Air Handling Supply and Return Air Fan Pressure Drop Calculation
Supply Air Fan Return Air Fan
Average Cooling Supply Fan Pressure Drop from the Existing System
493 357
Approximate Riser Pressure Losses 50 50
Approximate Static Pressure Drop for
Floor Air Handling Configuration
448 312
3.3.2 Active Chilled Beams
A schematic of an active chilled beams system from the TRACE 700 software can be seen in the Figure 3.3.
Figure 3.3: Active Chilled Beams System Schematic
3.3.2.1 Central Air Handling
To ensure consistency between the files the rooms and main cooling and heating plants were copied from the existing building model. Eight active chilled beam systems were then created under the systems tab.
Similar to the existing system this upgrade alternative shall consist of eight central air handling plants. Four central air handling units shall be located in the Level 16 plant room and be dedicated to the north-east, south-east, south-west and north-west zones on levels 8 to 15 inclusive. The remaining four central air handling units shall be located in the lower ground plant room and serve the north-east, east, south-west and north-south-west zones on levels ground to 7 inclusive.
[image:53.595.115.518.443.743.2]The static pressure drop used in this system was the same as that used in the existing building model. This was based on the assumption that the duct sizing and configuration will be the same as the existing. The fan performance details for the active chilled beam system with central air handling plant are presented in Table 3.15.
Table 3.15: Fan Performance - Active Chilled Beams With Central Air Handling Plant
System
Description Fan Fan Type
Static Pressure
Drop
AHU NW (Level 1-7)
Cooling Supply Centrifugal, variable speed motor 650 Pa Return Air Fan Axial fan, variable speed motor 395 Pa AHU NE
(Levels 1-7)
Cooling Supply Centrifugal, variable speed motor 450 Pa Return Air Fan Axial fan, variable speed motor 315 Pa AHU SW
(Levels 1-7)
Cooling Supply Centrifugal, variable speed motor 430 Pa Return Air Fan Axial fan, variable speed motor 320 Pa AHU SE
(Levels 1-7)
Cooling Supply Centrifugal, variable speed motor 440 Pa Return Air Fan Axial fan, variable speed motor 300 Pa AHU NW
(Levels 8-15)
AHU NE (Levels 8-15)
Cooling Supply Centrifugal, variable speed motor 510 Pa Return Air Fan Axial fan, variable speed motor 380 Pa AHU SW
(Levels 8-15)
Cooling Supply Centrifugal, variable speed motor 445 Pa Return Air Fan Axial fan, variable speed motor 390 Pa AHU SE
(Levels 8-15)
Cooling Supply Centrifugal, variable speed motor 520 Pa Return Air Fan Axial fan, variable speed motor 380 Pa
Similar to the variable air volume system the active chilled beams system contains a cooling supply fan and a return air fan, in comparison to the existing mixing box system which also contains a heating supply fan.
3.3.2.2 Floor Air Handling Plant
To model the floor air handling active chilled beams system the rooms and main cooling and heating plants created in the existing building model were copied and reused to ensure consistency between the models. As there will be an air handling unit dedicated per floor sixteen active chilled beams systems were created under the systems tab. Fan performances were detailed in the fans sub-tab and are summarised in Table