Dual-Tree Complex Wavelet Packet Transform and
Feature Selection Techniques for Infant Cry
Classification
Wei Jer Lim
1, Hariharan Muthusamy
2, Vikneswaran Vijean
1, Haniza Yazid
1Thiyagar Nadarajaw
3, Sazali Yaacob
41School of Mechatronic Engineering, Universiti Malaysia Perlis (UniMAP), 02600, Perlis, Malaysia. 2Department of Biomedical Engineering SRM University, Kattan kulathur – 603 203, Tamil Nadu, India. 3Head of Department, Consultant Pediatrician & Adolescent, Medicine Specialist, Department of Pediatrics, Hospital
Sultanah Bahiyah, Alor Setar, Kedah.
4Universiti Kuala Lumpur Malaysian Spanish Institute, Kulim Hi-Tech Park, 09000 Kulim, Kedah, Malaysia. [email protected]
Abstract—A Dual-Tree Complex Wavelet Packet Transform
(DT-CWPT) feature extraction has been used in infant cry signal classification to extract the feature. Total of 124 energy features and 124 Shannon entropy features were extracted from each sub-band after five level decomposition by DT-CWPT. Feature selection techniques used to deal with massive information obtained from DT-CWPT extraction. The feature selection techniques reduced the number of features by select and form feature subset for classification phase. ELM classifier with 10-fold cross-validation scheme was used to classify the infant cry signal. Three experiments were conducted with different feature sets for three binary classification problems (Asphyxia versus Normal, Deaf versus Normal, and Hunger versus Pain). The results reported that features selection techniques reduced the number of features and achieved high accuracy.
Index Terms—Infant Cry Classification; Feature Selection;
Dual-Tree Complex Wavelet Packet Transform.
I. INTRODUCTION
The cry is the only and the first communication way between infant and parent. Crying of infant carries much information, such as pain, hunger, discomfort and so on. Each type of crying has a different acoustic characteristic, while trained professional and experienced parent can identify these crying easily. Pathological babies are commonly detected several months or even years after the infant is born. If these diseases can be detected earlier, this may avoid opportune treatments and therapies.
Infant cry classification becomes popular research in the past decade. Researchers using automatic infant cry recognition techniques to differentiate the reason behind infant cries have addressed in the literature. Prior works on infant cry analysis have investigated the difference between pathological (deaf and asphyxia) and normal cries [1-3]. Feature extraction plays an important role in the infant cry recognition process. Some researchers proposed feature extraction techniques to analyse the infant cry through Mel Frequency Cepstral Coefficient (MFCC) and Linear Prediction Coding (LPC) [2,4]. Feature selection has become a necessity in many applications to reduce the dimension of irrelevant features. R.Sahak [5] used Principal Component Analysis (PCA) and Support Vector Machine (SVM) to classify the asphyxia and normal cries by integrating the PCA
to reduce the dimension of the input vectors to SVM. The classification reported in this paper is 95.86%. Silvia Orlandi [6] used WEKA tool to reduce the number of attributes for classification; there are more than 3000 cry units (recordings of 28 full term and ten preterm newborns) with twenty-two acoustical parameters. Silvia Orlandi [6] has experimented with four different classifiers (Logistic Curve, Multilayer Perceptron, Support Vector Machine, and Random Forest). Results show that the proposed method achieved 87.34% with only ten attributes out of 22 attributes. A. Zabidi [7] implemented a feature selection technique to select Mel Frequency Cepstrum (MFC) features for classification. A feature selection technique called Binary Particle Swarm Optimization (BPSO) was used by A.Zaibidi to distinguish the healthy infants and the infants with hypothyroidism from the infant cry signals. BPSO selected the significant coefficients after the MFC analysis on the infant cry helps to reduce the computation load of the classifier. The outcome of the research shown that highest classification accuracy of 99.65% was achieved. Chuan Yu Chang [8] used sequential forward floating feature selection (SFFS) to select high discriminative features and classified three types of infant crying (feeling sleepy, hunger and pain) using direct acyclic graph support vector machine (DAG-SVM). Classification with 15 extracted features from infant cry signals was time consuming, thus features selection was applied to select the discriminative features. Experimental results have shown that the SVM classification accuracy was up to 92.17% with 4 selected features by SFFS. Orion Fausto Reyes Galaviz9 has added feature selection to select the best features for the classification process. The babies cry soundwaves were extracted by Linear Predictive Coefficients and Mel Frequency Cepstral Coefficients with different segment samples. Principal Component Analysis and proposed genetic feature selection system reduced the feature vectors for neural network classification. The results shown improvement in the proposed genetic system where infant cry recognition achieved 96.79%. Many researchers have tried different classifiers for infant cry classification. M.Hariharan [3] used simple feature extraction method (short time Fourier Transform (STFT)) to conduct the infant cry classification experiment with 10 fold cross-validation and conventional validation scheme for the classification and results shown PNN and GRNN performed better compared to MLP and
TDNN. Other than conventional classifier, fuzzy algorithm [10-11] has been implemented in feature selection to shrink the number of features and achieves a higher classification accuracy. The best result computed from FRNN was 98.00% for Deaf and Normal classification. A. Rosales-Pérez [12] has applied Genetic Selection of a Fuzzy Model (GSFM) for feature selection phase to select the suitable feature set for classification. With the implemented GSFM, the author has achieved classification accuracies within 90.68% to 99.42% for the two-class classification.
II. MATERIALS AND METHODS
A. Automatic Infant Cry Recognition Process
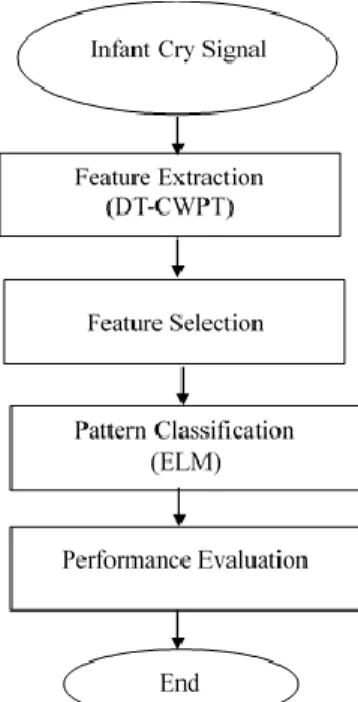
The infant automatic classification process is similar to automatic speech recognition. This process has the following steps as shown in Figure 1 which includes, feature extraction to extract the input cry signal, dimension of features will reduce in feature selection process, pattern classification using ELM and accuracy of classification evaluated during performance evaluation.
Figure 1: Flow of automatic infant cry recognition process
This experiment used the Baby Chillanto database downloaded from http://ingenieria.uatx.mx/orionfrg/cry/. This database is the property of the Instituto Nacional de AstrofisicaOptica y Electronica (INAOE) – CONACYT, Mexico [13]. This database contains both pathological and physiological cry signals. Asphyxia and deaf are pathological cry signals while normal, pain and hunger are considered as physiological cry signals [14]. This database consists of 2268 samples of five different infant cry signals (879 samples of the deaf, 507 samples of normal, 350 samples of hungry, 340 samples of asphyxia and 192 samples of pain).
B. Feature Extraction
Feature extraction needs much attention because pattern classification performance depends on this phase. The objective of the feature extraction is to compute a sequence of feature vector providing the information of the input signal. There were two feature extraction methods (Discrete Wavelet
Transform (DWT) and Discrete Wavelet Packet Transform (DWPT)) widely used in signal and image processing. The input signals are decomposed by DWT and DWPT into two subspaces (low and high-frequency band) [15]. The decomposition of DWT and DWPT have some limitations which the decomposition is far from being shift-invariant and does not provide a geometrically oriented decomposition in multiple dimension [16]. Thus DT-CWPT was implemented in this paper to overcome the imperfection of DWT and DWPT. Figure 2 shows the DT-CWPT consists of two DWPT operating in parallel on an input signal. The hierarchical DT-CWPT uses a family of wavelet function and their associated scaling functions to decompose the original signal into following sub-bands. The decomposition process was applied to both low and high-frequency sub-bands to generate the next level of the hierarchy. The second wavelet packet sub-band is obtained by replacing the first stage filter
(1)
( )
i
h
n
byh
i(1)(
n
−
1)
and by replacingh n
i( )
byh n
i'( )
for
i
0,1
[16]. In this experiment, five-level decomposition by DT-CWPT has a total of 124 wavelet packet coefficients. For a particular sequence of wavelet packet coefficients, energy and Shannon entropy were extracted for classification. M. Hariharan1 shown more detailon energy and Shannon entropy features can refer in the paper.
C. Feature Selection
Many types of research have always been facing a large pool of information in pattern classification. Feature selection techniques have been used to reduce and select useful information from the application data. The objectives of feature selection techniques are to avoid overfitting and improve classification experiment performance. Besides, these techniques also create a more cost-effective model [17]. Three different feature selection techniques were applied in this work to select and reduce the number of features.
Correlation Feature Selection (CFS) [18] is a filter algorithm that used the correlation based heuristic evaluation function to rank the feature subsets. The CFS filter out the irrelevant features, which have a low correlation with the class. CFS use the search algorithm together with an evaluation function to search for correlated features. The general equation of CFS shown in Equation (1).
𝑀𝑒𝑟𝑠=
𝑁𝑟̅̅̅̅𝑐𝑓
√𝑁 + 𝑁(𝑁 − 1)𝑟̅̅̅̅𝑓𝑓
(1)
where 𝑀𝑒𝑟𝑠 is the “merit” of a feature subset 𝑆 containing 𝑁
features, and 𝑟̅̅̅̅𝑐𝑓 is the mean of feature-class correlation,
while 𝑟̅̅̅̅𝑓𝑓 is the average feature-feature inter-correlation. The
numerator shows how predictive of the class a group of features are while denominator shows how much redundancy there is among them [18]. CFS was applied to the extracted energy and Shannon entropy features to reduce the dimensionality. The feature selection by CFS gives a good feature subsets contain highly correlated with the class and yet uncorrelated with each other [19].
Principal Component Analysis (PCA) [20] is a standard technique for dimensionality reduction and has been applied to a broad class of computer vision problems. PCA was useful in choosing variables which are correlated with one another
[5]. PCA accounts the hidden information from the original feature space by maximising the variance of the projected vectors. PCA orthogonalizes the components of the input vectors so that with one with the largest variation come first. The eigenvalues were given to the vectors. Thus, those vectors with Eigenvalue greater than ‘1’ were selected to form the subset of features [21].
Information Gain (IG) is one of the popular methods used in feature reduction [22]. IG measures the amount of information in the class prediction and values were given for each feature. In this experiment, IG was computed for each of the energy and Shannon entropy features. The mean value of all the calculated IG values was computed and used as a threshold. The features which have greater than threshold was chosen for best features and used for classification [23].
Figure 2: The decomposition level of a four-stage DT-CWPT [16].
D. Pattern Classification
Classification algorithms implemented in the pattern classification phase. Extreme Learning Machine (ELM) was popular with higher scalability and less computational complexity and also has the classification capability instead of universal approximation capability [24]. The classification was done using 10-fold cross-validation scheme [25] where the data set is divided into ten disjoint subsets. In each fold, a subset is kept for testing while the remaining subsets used for training. This process is repeated until all the subsets have been used for testing and training. RBF kernel was used in ELM [26].
In this experiment, Cry signals are decomposed into five levels using DT-CWPT and energy and Shannon entropy features were extracted from each sub-band to form a feature
vector of length 124. After the DT-CWPT decomposition, there are 124 features for energy and Shannon entropy respectively. All these features were used in three experiments in this paper. Experiment 1 is classification with only 124 energy features, experiment 2 used only 124 Shannon entropy features for classification, while experiment 3 is a combination of both energy and Shannon entropy features for classification. Thus, there are 248 numbers of features in experiment 3. The objectives of these experiments are to reduce the dimensionality by selecting the feature subsets for classification. The regularisation coefficient and RBF kernel parameter of ELM classifier were set between -10 and -10.
To measure the performance of the classifiers, performance measure was used in this paper. We calculated the performance of the classifiers using the equations below:
(True Positive + True Negative) Accuracy=
(Total Number of Samples) (2)
True Positive is when the classifier classified as Pathology. True Negative is when the classifier classified as Normal. The results were computed in Table 1 and Table 2.
III. RESULTS AND DISCUSSIONS
Table 1 summarises the results obtained from experiment 1, 2 and 3 for binary problem identifying between asphyxia and normal (A vs N) cries, deaf and normal (D vs N) cries, the lastly hunger and pain (H V P) cry. ALL_F in Table 1 means the classification by using all length of features, the value of the bracket ‘( )’ presented the number of features selected by the feature selection techniques. We applied the three feature selection techniques (PCA, IG and CFS) to reduce the dimensionality and the selected subset features were used for classification. In Table 1, we computed a classification with the full length of features set for experiment 1, 2 and 3. The results were recorded and compared with PCA, IG and CFS.
For experiment 1, feature selection technique significantly reduced the number of features as less as 3 for D vs N (CFS). The performances of selected subset were degraded for A vs N and D vs N but improved for CFS (with 22 features and achieved 84.31% classification accuracy) in H vs P classification. CFS successfully removed 102 irrelevant features from 124 energy features. 124 Shannon entropy features used in Experiment 2 for classification. With entire feature set of 124 features, the accuracies for binary problem obtained for A vs N, D vs N, and H vs P are 97.75%, 99.92% and 85.60% respectively. Instead of reducing the number of features, PCA achieved better performance compared to other two feature selections. In D vs N classification, PCA selects the features which with Eigenvalue bigger than ‘1’ to form a feature subset for classification, PCA managed to achieve 99.92% accuracy with only 52 features which were same as the accuracy with the full feature set.
Feature selection techniques used to test with a length of 248 features in experiment 3. The accuracies using combined features (Shannon entropy and energy features) for classification were higher compared to experiment 1 and experiment 2. More useful information can be selected from the combined features and increased the accuracies. For the A vs N classification, we found that CFS selected 12 features
for classification, but with 94.21% accuracy, 44 features were chosen by PCA and achieved 97.28% classification accuracy, while IG selects 115 features with 96.44% accuracy. Thus, PCA has performed better compared to CFS and IG.
Table 1
Results of Classification for ELM
Feature Selection Experiment 1
A vs N D vs N H vs P ALL_F 96.57% 99.92% 83.94% PCA 96.22%(7) 99.85%(7) 80.62%(6) IG 95.74%(57) 99.85%(86) 80.07%(58) CFS 93.27%(7) 99.85%(3) 84.31%(22) Experiment 2 A vs N D vs N H vs P ALL_F 97.75% 100.00% 85.60% PCA 97.00%(37) 99.92%(52) 85.42%(48) IG 95.98%(58) 98.91%(73) 80.99%(62) CFS 92.32%(5) 99.27%(7) 82.10%(20) Experiment 3 A vs N D vs N H vs P ALL_F 97.87% 99.92% 87.26% PCA 97.28%(44) 99.92%(59) 85.97%(54) IG 96.44%(115) 99.78%(159) 82.10%(120) CFS 94.21%(12) 99.85%(10) 84.50%(42) Table 2
Comparison with Related Works
Best accuracy GSFM [12] FRNN [11] FRNN [10] Asphyxia vs. normal 97.87% 90.68% 88.67% 84.00% Deaf vs. normal 100.00% 99.42% 97.55% 98.00% Hunger vs. pain 87.26% 97.96% 96.03% 95.24%
Table 2 shows the best results obtained from experiments and the reported by S. E. Barajas [10], A. Rosales-Pérez [11, 12].
Table 2 shows that our implemented methods have better performance compared to GSFM and FRNN in asphyxia versus normal and deaf versus normal with 97.87% and 100.00% respectively.
IV. CONCLUSION
In this paper, the classification of infant cry signals into five classes of asphyxia, deaf, hunger, pain and normal cries has been presented. Energy and Shannon entropy features extracted from each sub-band of DT-CWPT wavelet packet coefficients. PCA, IG and CFS select feature vectors with different lengths have been passed on to ELM classifier. The experimental results show that the implemented feature selection methods achieved high accuracies. In our future work, non-linear feature extraction methods will be explored and to enhance the classification performance as well.
ACKNOWLEDGEMENT
We appreciate the support of this research received under the Fundamental Research Grant Scheme (FRGS) from Ministry of Education, Malaysia. [Grant No: 9003-00485] and Hospital Sultanah Bahiyah.
REFERENCES
[1] M. Hariharan, S. Yaacob, and S. A. Awang, “Pathological infant cry analysis using wavelet packet transform and probabilistic neural network,” Expert Syst. Appl., vol. 38, no. 12, pp. 15377–15382, 2011. [2] M. Hariharan, L. S. Chee, and S. Yaacob, “Analysis of infant cry
through weighted linear prediction cepstral coefficients and probabilistic neural network,” J. Med. Syst., vol. 36, no. 3, pp. 1309– 1315, 2012.
[3] M. Hariharan, J. Saraswathy, R. Sindhu, W. Khairunizam, and S. Yaacob, “Infant cry classification to identify asphyxia using time-frequency analysis and radial basis neural networks,” Expert Syst. Appl., vol. 39, no. 10, pp. 9515–9523, 2012.
[4] Y. Abdulaziz and S. M. S. Ahmad, “Infant cry recognition system: A comparison of system performance based on mel frequency and linear prediction cepstral coefficients,” Information Retrieval & Knowledge Management, (CAMP), 2010 International Conference on. pp. 260– 263, 2010.
[5] R. Sahak, W. Mansor, Y. K. Lee, A. I. M. Yassin, and A. Zabidi, “Performance of combined support vector machine and principal component analysis in recognizing infant cry with asphyxia,” in Engineering in Medicine and Biology Society (EMBC), 2010 Annual International Conference of the IEEE, 2010, pp. 6292–6295. [6] S. Orlandi, C. A. Reyes Garcia, A. Bandini, G. Donzelli, and C.
Manfredi, “Application of Pattern Recognition Techniques to the Classification of Full-Term and Preterm Infant Cry,” Journal of Voice, 2015.
[7] A. Zabidi, W. Mansor, Y. K. Lee, I. M. Yassin, and R. Sahak, “Binary Particle Swarm Optimization for selection of features in the recognition of infants cries with asphyxia,” Signal Processing and its Applications (CSPA), 2011 IEEE 7th International Colloquium on. pp. 272–276, 2011.
[8] C.-Y. Chang, C.-W. Chang, S. Kathiravan, C. Lin, and S.-T. Chen, “DAG-SVM based infant cry classification system using sequential forward floating feature selection,” Multidimens. Syst. Signal Process., pp. 1–16, 2016.
[9] O. F. R. Galaviz and C. A. R. García, “Infant Cry Classification to Identify Hypo Acoustics and Asphyxia Comparing an Evolutionary-Neural System with a Evolutionary-Neural Network System,” in MICAI 2005: Advances in Artificial Intelligence: 4th Mexican International Conference on Artificial Intelligence, Monterrey, Mexico, November 14-18, 2005. Proceedings, A. Gelbukh, Á. de Albornoz, and H. Terashima-Marín, Eds. Berlin, Heidelberg: Springer Berlin Heidelberg, 2005, pp. 949–958.
[10] S. E. Barajas and C. A. Reyes, “Your Fuzzy Relational Neural Network Parameters Optimization with a Genetic Algorithm,” Fuzzy Systems, 2005. FUZZ ’05. The 14th IEEE International Conference on. pp. 684– 689, 2005.
[11] A. Rosales-Pérez, C. A. Reyes-García, and P. Gómez-Gil, “Genetic fuzzy relational neural network for infant cry classification,” in Pattern Recognition, Springer, 2011, pp. 288–296.
[12] A. Rosales-Pérez, C. A. García, J. A. Gonzalez, O. F. Reyes-Galaviz, H. J. Escalante, and S. Orlandi, “Classifying infant cry patterns by the Genetic Selection of a Fuzzy Model,” Biomed. Signal Process. Control, vol. 17, pp. 38–46, 2015.
[13] O. F. Reyes-Galaviz, S. D. Cano-Ortiz, and C. A. Reyes-García, “Evolutionary-Neural System to Classify Infant Cry Units for Pathologies Identification in Recently Born Babies,” 2008 Seventh Mex. Int. Conf. Artif. Intell., pp. 330–335, 2008.
[14] C. F. Z. Boukydis and B. M. Lester, “Infant crying: Theoretical and research perspectives”. Springer Science & Business Media, 2012. [15] W. Ting, Y. Guo-zheng, Y. Bang-hua, and S. Hong, “EEG feature
extraction based on wavelet packet decomposition for brain computer interface,” Measurement, vol. 41, no. 6, pp. 618–625, 2008.
[16] I. Bayram and I. W. Selesnick, “On the Dual-Tree Complex Wavelet Packet and M-Band Transforms,” IEEE Trans. Signal Process., vol. 56, no. 6, pp. 2298–2310, 2008.
[17] Y. Saeys, I. Inza, and P. Larrañaga, “A review of feature selection techniques in bioinformatics,” Bioinformatics, vol. 23, no. 19. pp. 2507–2517, 2007.
[18] M. A. Hall, “Correlation-based feature selection for machine learning.”
The University of Waikato, 1999.
[19] M. A. Hall and L. A. Smith, “Feature subset selection: a correlation based filter approach,” 1997.
[20] I. T. Jolliffe, “Principal Component Analysis.”. Springer New York, 1986.
[21] J. Orozco and C. A. R. García, “Detecting pathologies from infant cry applying scaled conjugate gradient neural networks,” in European Symposium on Artificial Neural Networks, Bruges (Belgium), 2003, pp. 349–354.
[22] Y. Yang and J. O. Pedersen, “A Comparative Study on Feature Selection in Text Categorization,” Proc. Fourteenth Int. Conf. Mach. Learn., pp. 412–420, 1997.
[23] N. Spolaôr, E. A. Cherman, M. C. Monard, and H. D. Lee, “Filter Approach Feature Selection Methods to Support Multi-label Learning Based on ReliefF and Information Gain,” in Advances in Artificial Intelligence - SBIA 2012: 21th Brazilian Symposium on Artificial Intelligence, Curitiba, Brazil, October 20-25, 2012. Proceedings, L. N. Barros, M. Finger, A. T. Pozo, G. A. Gimenénez-Lugo, and M. Castilho, Eds. Berlin, Heidelberg: Springer Berlin Heidelberg, 2012, pp. 72–81.
[24] G.-B. Huang, H. Zhou, X. Ding, and R. Zhang, “Extreme Learning Machine for Regression and Multiclass Classification.,” IEEE Trans. Syst. Man. Cybern. B. Cybern., vol. 42, no. x, pp. 1–17, 2011. [25] R. Kohavi, “A Study of Cross-Validation and Bootstrap for Accuracy
Estimation and Model Selection,” Int. Jt. Conf. Artif. Intell., vol. 14, no. 12, pp. 1137–1143, 1995.
[26] S. D. C. Ortiz, D. I. E. Beceiro, and T. Ekkel, “A radial basis function network oriented for infant cry classification,” in Progress in Pattern Recognition, Image Analysis and Applications, Springer, 2004, pp. 374–380.
![Figure 2: The decomposition level of a four-stage DT-CWPT [16].](https://thumb-us.123doks.com/thumbv2/123dok_us/9899607.2483424/3.893.87.366.350.876/figure-decomposition-level-stage-dt-cwpt.webp)
![Table 2 shows the best results obtained from experiments and the reported by S. E. Barajas [10], A](https://thumb-us.123doks.com/thumbv2/123dok_us/9899607.2483424/4.893.74.435.534.647/table-shows-best-results-obtained-experiments-reported-barajas.webp)
