University of Southern Queensland Faculty of Engineering and Surveying
EVALUATION OF THE CAPACITY OF SIGNALISED
TWO LANE ROUNDABOUTS
A dissertation submitted by
Jarrod Lee Taylor
In the fulfilment of the requirements of
Courses: ENG4111 & ENG4112 Research Project
Towards the degree of
Bachelor of Engineering (Civil)
ABSTRACT
There has been ever increasing demand in the signalisation of roundabouts with the intention of improving the capacity and safety of the intersection. The signalisation may be incorporated to reduce reliance on gap acceptance in heavily saturated conditions, control the dominance of a singular heavy leg demand, improve safety for cyclists and pedestrians or control all entry flows into the roundabout intersection.
This report evaluates the capacity of two lane signalised roundabouts under saturated conditions. Computer models were developed in LinSig and Excel to calculate the effective capacity of the intersections up to a level of service F. Models were developed based on differing variables such as inscribed diameters, queue discharge headways, phase sequences and signal cycle times. Relationships between the variables and the impact they had on the capacity of the signalised roundabout intersection were evaluated. The variables used in the capacity models were based on field research conducted under Australian driving conditions and research gathered from around the world. These models were then compared to un-signalised capacities calculated from previous research across the world.
LIMITATIONS OF USE
University of Southern Queensland
Faculty of Engineering and Surveying
ENG4111 Research Project Part 1 &
ENG4112 Research Project Part 2
Limitations of Use
The Council of the University of Southern Queensland, its Faculty of Engineering and Surveying, and the staff of the University of Southern Queensland, do not accept any responsibility for the truth, accuracy or completeness of material contained within or associated with this dissertation.
Persons using all or any part of this material do so at their own risk, and not at the risk of the Council of the University of Southern Queensland, its Faculty of Engineering and Surveying or the staff of the University of Southern Queensland.
This dissertation reports an educational exercise and has no purpose or validity beyond this exercise. The sole purpose of the course pair entitled “Research Project” is to contribute to the overall education within the student's chosen degree program. This document, the associated hardware, software, drawings, and other material set out in the associated appendices should not be used for any other purpose: if they are so used, it is entirely at the risk of the user.
Professor Frank Bullen Dean
ACKNOWLEDGEMENTS
I would like to thank firstly my project supervisor Soma Somasundaraswaran (USQ) and Mr Ray Stafford (RMS) for helping me with information and guidance throughout this project. I would also like to thank Andrew Dorrian (RMS) and John Nightingale (JCT) for the support and help with the computer modelling software LinSig.
TABLE OF CONTENTS
ABSTRACT ... ii
LIMITATIONS OF USE ... iii
CERTIFICATION...iv
ACKNOWLEDGEMENTS ... v
TABLE OF CONTENTS ...vi
LIST OF FIGURES ... ix
LIST OF TABLES ... xi
GLOSSARY ... xiv
1. INTRODUCTION ... 1
1.1 Problem Statement ... 2
1.2 Project Objectives ... 2
2. BACKGROUND... 4
2.1 Un‐signalised Roundabouts ... 4
2.1.1 Australia ... 5
2.2 Signalised Roundabouts ... 7
3. LITERATURE REVIEW ... 9
3.1 Un‐signalised roundabouts ... 10
3.1.1 General ... 10
3.1.2 Capacity ... 12
3.2 Signalised Roundabouts ... 18
3.2.1 General ... 18
3.2.2 Signalisation and Phasing ... 19
3.2.3 Capacity ... 21
3.3 Traffic flow characteristics ... 25
3.3.1 Gap Acceptance ... 25
3.3.2 Headways ... 27
3.3.3 Traffic Composition ... 30
3.3.4 Saturation Flow ... 31
3.3.5 Roundabout Geometry ... 31
3.3.6 Lane Widths ... 33
3.4 Analytical Methods & Capacity Measures ... 34
3.4.1 Analysis Methods for Un‐Signalised Roundabouts ... 34
3.4.2 Analysis Methods for Signalised Roundabouts ... 37
3.4.3 Control Delay ... 37
3.4.4 Level of Service (LOS) ... 38
3.5 Computer Software Modelling ... 41
3.5.1 LinSig ... 41
4. DESIGN AND METHODOLOGY ... 43
4.1 Aims and Objectives ... 43
4.2 Methodology ... 44
4.3 Data inputs for Linsig Models ... 47
4.4 Phase Sequence ... 48
4.4.1 Signal Controller Settings ... 49
4.5 Inscribed diameters of existing two lane roundabouts in NSW, Australia ... 51
4.6 Field Research ... 55
4.6.1 Geometric Delay ... 55
4.6.2 Queue Discharge Headways ... 58
4.7 Implications/Consequential Effects ... 63
4.7.1 Safety ... 63
4.7.2 Sustainability ... 63
5. LINSIG MODELS ... 64
5.1 Signalised Roundabout 50m diameter ... 66
5.1.1 Standard Phasing ... 66
5.1.2 UK Phasing ... 68
5.2 Signalised Roundabout 60m diameter ... 69
5.2.1 Standard Phasing ... 70
5.2.2 UK Phasing ... 71
6. RESULTS ... 74
6.1 Signalised Roundabout 50m diameter ... 74
6.1.1 Standard Phasing ... 74
6.1.2 UK Phasing – No pedestrian movements ... 84
6.2 Signalised Roundabout 60m diameter ... 87
6.2.1 Standard Phasing ... 87
6.2.2 UK Phasing – No pedestrian movements ... 90
7. CAPACITY OF SIGNALISED ROUNDABOUTS ... 93
7.1 Effects of inscribed diameter ... 93
7.1.1 Standard Phasing ... 93
7.1.2 UK Phasing – No pedestrian movements ... 96
7.2 Effects of queue discharge headway ... 97
7.2.1 Standard Phasing ... 97
7.2.2 UK Phasing – No pedestrian movements ... 98
7.3 Effects of cycle times ... 99
7.3.1 Standard Phasing ... 99
7.3.2 UK Phasing – No pedestrian movements ... 100
7.4 Comparison to un‐signalised roundabouts ... 101
7.4.1 Standard Phasing ... 102
7.4.2 UK Phasing – No pedestrian movements ... 103
8. RECOMMENDATIONS ... 104
9. AREAS OF FURTHER RESEARCH ... 105
11. REFERENCES ... 107
APPENDIX A – PROJECT SPECIFICATION ... 110
APPENDIX B – SAMPLE OF SIGNAL TIMINGS ... 111
APPENDIX C – DATA SHEETS FROM FIELD TESTS ... 112
APPENDIX D – DIAGRAMATIC VIEW OF UK PHASE SEQUENCE 60 SECOND PHASE ... 116
APPENDIX E – SCALE A3 DRAWINGS OF ROUNDABOUT MODELS ... 118
APPENDIX F – LINSIG & EXCEL STANDARD PHASING RESULTS ... 121
APPENDIX G – LINSIG UK PHASING RESULTS 50m INSCRIBED DIAMETER ... 135
APPENDIX H – LINSIG UK PHASING RESULTS 60m INSCRIBED DIAMETER ... 141
LIST OF FIGURES
Figure 3.1 – Geometric elements of a roundabout. (Austroads 2007, p 36) ... 11
Figure 3.2 – Approach capacity of a two‐lane roundabout (FHWA 2000, p 88) ... 14
Figure 3.3 – Capacity of Single‐Lane and Multilane entries (HCM 2010, Exhibit 21‐7) ... 15
Figure 3.4 – The relation of α and Lba (Tan 2001, Fig.1) ... 16
Figure 3.5 – Capacity reduction factor for a two lane roundabout assuming pedestrian priority. (Brilon, Stuwe, and Drews 1993) ... 17
Figure 3.6 – Geometric elements of a signalised roundabout without pedestrian and cyclist demand ... 18
Figure 3.7 – Geometric elements of a signalised roundabout with pedestrian and cyclist demand ... 19
Figure 3.8 – General phasing structure of signalised roundabouts in the United Kingdom ... 20
Figure 3.9 – Staging of the phase sequence of signalised roundabouts in the United Kingdom ... 20
Figure 3.10 – Piazza Maggi Layout (Bernetti, ... 23
Figure 3.11 – Results comparison in terms of mean delays (Bernetti, ... 24
Figure 3.12 – Definition of a gap (Irvena 2010, Figure 3.3) ... 25
Figure 3.13 – Definition of lag (Irvena, 2010, Figure 3.4) ... 26
Figure 3.14 – Typical Gap Acceptance behaviour (Austroads 2008, Figure 5.1) ... 26
Figure 3.15 – Critical gap with increased circulating flow (Akçelik, 2011) ... 27
Figure 3.16 – Definition of headway (Irvena 2010, Figure 3.6) ... 28
Figure 3.17 – Definition follow‐up headway (Irvena 2010, Figure 3.5) ... 28
Figure 3.18 – Signalised intersection acceleration headways (HCM 2010, Exhibit 4‐6)... 29
Figure 3.19 – Concept of saturation flow rate and lost time (HCM 2010, Exhibit 4‐7) ... 29
Figure 3.20 – Effective intersection capacity and critical degree of saturation as a function of inscribed diameter estimated by Australian gap acceptance theory (Akçelik 2011, Figure 5) ... 31
Figure 3.21 – Step function nature of Level of Service (HCM 2010, Exhibit 5‐1) ... 39
Figure 4.1 – Roundabout Analysis Methodology (HCM 2010, Exhibit 21‐9) ... 44
Figure 4.2 – Signalised Intersection Analysis Methodology (HCM 2010, Exhibit 18‐11) ... 45
Figure 4.3 – Phase sequence used to examine capacity of signalised roundabout ... 48
Figure 4.4 – All‐red time as a function of speed and clearance distance (Austroads 2003, Figure C.5) ... 50
Figure 4.6 – Central Coast existing roundabout locations ... 52
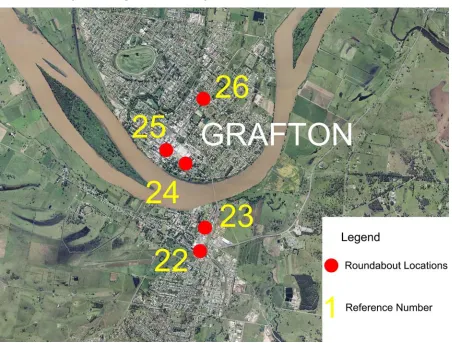
Figure 4.7 – Grafton existing roundabout locations ... 53
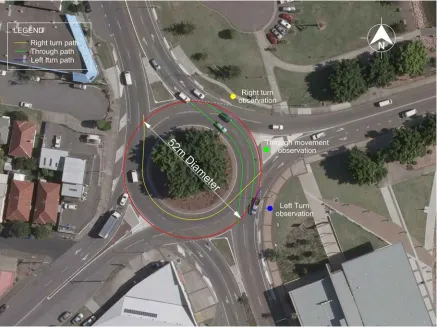
Figure 4.8 – Geometric delay observations 52m inscribed diameter roundabout ... 55
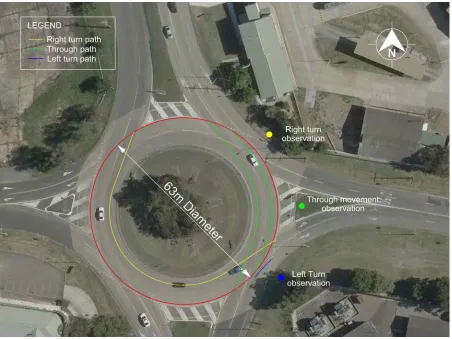
Figure 4.9 – Geometric delay observations 63m inscribed diameter roundabout ... 56
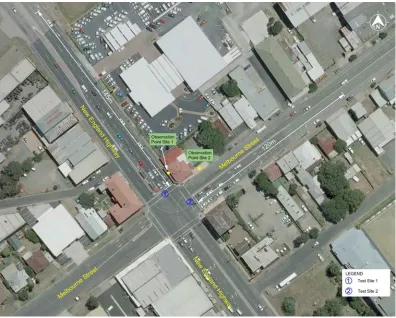
Figure 4.10 – Test sites to determine headway and saturation flow through signals, semi rural urban environment East Maitland. ... 58
Figure 4.11 – Test sites to determine headway and saturation flow through signals, urban environment Newcastle. ... 60
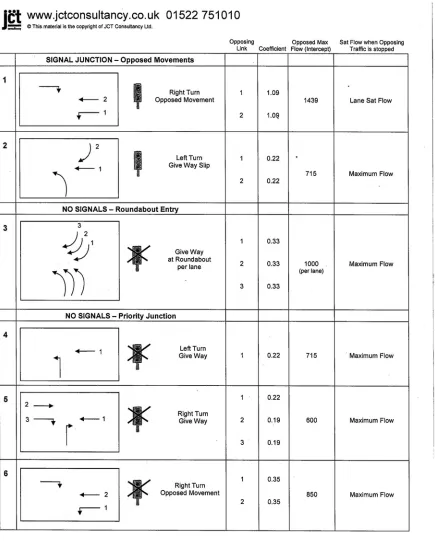
Figure 5.1 – Saturation flows and coefficients for opposed movements developed by JCT Consulting ... 65
Figure 5.2 – 50m signalised roundabout LinSig Model – Standard phasing... 67
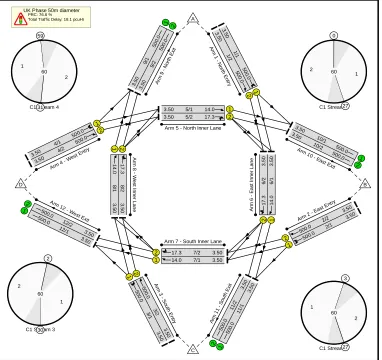
Figure 5.3 – 50m signalised roundabout LinSig Model – UK phasing ... 68
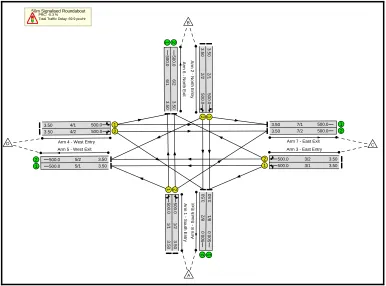
Figure 5.4 – 60m signalised roundabout LinSig Model – Standard phasing... 70
Figure 5.5 – 60m signalised roundabout LinSig Model – UK phasing ... 72
Figure 6.1 – Capacity of signalised roundabout based on 80 second control delay ... 75
Figure 6.2 – Capacity of signalised roundabout based on hour interval ... 77
Figure 6.3 – Capacity of Signalised Roundabout with 3 second clearance time ... 79
Figure 6.4 – Capacity of Signalised Roundabout with 2 second all‐red interval Urban environment ... 80
Figure 6.5 – Capacity of signalised roundabout based on hour interval ... 82
Figure 6.6 – Capacity of Signalised Roundabout with 3 second clearance time ... 84
Figure 6.7 – Capacity of Signalised Roundabout with 3 second clearance time Semi‐rural / Urban environment ... 89
Figure 6.8 – Capacity of Signalised Roundabout with 3 second clearance time Urban environment ... 89
Figure 7.1 – Capacity for signalised roundabout for different inscribed diameters ... 93
Figure 7.2 – Capacity for signalised roundabout for different inscribed diameters ... 95
Figure 7.3 – Capacity for signalised roundabout for different inscribed diameters ... 95
Figure 7.4 – Capacity for signalised roundabout for different inscribed diameters UK phasing ... 96
Figure 7.5 – Difference in capacities based on queue discharge headways ... 97
LIST OF TABLES
Table 3.2 – Descriptions of key roundabout features. ... 11
Table 3.3 – Conversion factors for passenger car equivalents (pce) (HCM 2010, Exhibit 4‐5) ... 30
Table 3.4 – Analytical methods used across the world un‐signalised roundabouts (Bernetti, Dall’Acqua & Longo 2003, p 3) ... 34
Table 3.5 – Level of service definitions for vehicles based on delay (Source: Akçelik 2009, Table 4) ... 38
Table 3.6 – Descriptions of Level of service for interrupted flow ... 39
Table 3.7 – Level of service definitions for vehicles based on both delay and degree of saturation (Source: Akçelik 2009, Table 5) ... 40
Table 4.1 – Input data for LinSig models ... 47
Table 4.2 – Austroads Signal Controller Settings ... 49
Table 4.3 –Newcastle/Hunter Valley inscribed diameters ... 52
Table 4.4 –Central Coast inscribed diameters ... 53
Table 4.5 –Grafton inscribed diameters ... 54
Table 4.6 – Average cruise speed and geometric delay for a 52m inscribed diameter roundabout ... 56
Table 4.7 – Average cruise speed and geometric delay for a 63m inscribed diameter roundabout ... 57
Table 4.8 – Distances of various turning movements for the corresponding roundabout diameters based on Austroad standards ... 57
Table 4.9 – Headway and saturation flow data East Maitland site ... 59
Table 4.10 – Headway and saturation flow data Newcastle site ... 61
Table 5.1 – 50m Inscribed diameter geometric elements ... 66
Table 5.2 – All‐red interval time for 50m inscribed diameter ... 67
Table 5.3 – 60m Inscribed diameter geometric elements ... 70
Table 5.4 – All‐red interval time for 60m inscribed diameter ... 71
Table 6.1 – Maximum U turn movements for 50m signalised roundabout ... 74
Table 6.2 – Uniform traffic flows corresponding to total capacity of signalised roundabout ... 75
Table 6.3 – Capacity values Excel for 105s phase time Semi Rural / Urban Environment ... 76
Table 6.4 – Uniform traffic flows corresponding to total capacity of signalised roundabout ... 80
Table 6.5 – Capacity values Excel for 105s phase time Semi‐Rural / Urban Environment ... 81
Table 6.7 – Capacity values LinSig for 60s phase time Urban Environment ... 86
Table 6.8 – Maximum U turn movements for 60m signalised roundabout ... 87
Table 6.9 – Capacity values LinSig for 60s phase time Semi Rural / Urban Environment ... 91
Table 6.10 – Capacity values LinSig for 60s phase time Urban Environment ... 92
Table 7.1 – Excess clearance time at 30km/h entering vehicle speed ... 94
Table 7.2 – Coefficient values used for un‐signalised roundabout capacities using Tan (2001) formulae ... 101
Table 7.3 – Capacities based on entry capacity for an hour interval ... 102
Table F.1 – Capacity values for 50m inscribed diameter LinSig model 60s phase time Semi Rural / Urban Environment ... 121
Table F.2 – Capacity values for 50m inscribed diameter LinSig model 75s phase time Semi Rural / Urban Environment ... 122
Table F.3 – Capacity values for 50m inscribed diameter LinSig model 90s phase time Semi Rural / Urban Environment ... 123
Table F.4 – Capacity values for 50m inscribed diameter LinSig model 105s phase time Semi Rural / Urban Environment ... 124
Table F.5 – Capacity values for 50m inscribed diameter LinSig model 60s phase time no all‐red interval Semi Rural / Urban Environment ... 125
Table F.6 – Capacity values for 50m inscribed diameter 3 second clearance time Excel values Semi Rural / Urban Environment ... 126
Table F.7 – Capacity values for 50m inscribed diameter LinSig model 60s phase time Urban Environment ... 127
Table F.8 – Capacity values for 50m inscribed diameter LinSig model 75s phase time Urban Environment ... 128
Table F.9 – Capacity values for 50m inscribed diameter LinSig model 90s phase time Urban Environment ... 129
Table F.10 – Capacity values for 50m inscribed diameter LinSig model 105s phase time Urban Environment ... 130
Table F.11 – Capacity values for 50m inscribed diameter LinSig model 60s phase time no all‐red interval Urban Environment ... 131
Table F.12 – Capacity values for 50m inscribed diameter 3 second clearance time Excel values Urban Environment ... 132
Table F.13 – Capacity values for 60m inscribed diameter 3 second clearance time Excel values Semi‐rural / Urban Environment ... 133
Table G.1 – Controlled delay for journey times LinSig model 60s phase time Semi Rural / Urban
Environment ... 135
Table G.2 – Capacity values LinSig model 60s phase time Semi Rural / Urban Environment ... 136
Table G.3 – Controlled delay for journey times LinSig model 60s phase Urban Environment ... 138
Table G.4 – Capacity values LinSig model 60s phase time Urban Environment ... 139
Table H.1 – Controlled delay for journey times LinSig model 60s phase time Semi Rural / Urban Environment ... 141
Table H.2 – Capacity values LinSig model 60s phase time Semi Rural / Urban Environment ... 142
Table H.3 – Controlled delay for journey times LinSig model 60s phase time Urban Environment ... 144
Table H.4 – Capacity values LinSig model 60s phase time Urban Environment ... 145
Table I.1 – Capacity of un‐signalised roundabout based on uniform flow from HCM 2010 ... 147
Table I.2 – Capacity of un‐signalised roundabout based on uniform flow from Tan 2001 ... 147
Table I.3 – Capacity of un‐signalised roundabout based on variable flow from Tan 2001 ... 148
GLOSSARY
Term Definition
acceleration (m/s²) The act of accelerating; increase of speed or velocity
all-red interval (s) The time interval between when all signals are under a red phase.
capacity (veh/hr) The maximum hourly rate at which persons or vehicles can reasonably be expected to traverse a point or uniform section of a lane or roadway during a given time period under
prevailing roadway, traffic and control conditions.
carriageway one of the two sides of a motorway/highway where traffic travels in one direction only usually in two or three lanes cycle time (s) The total time for a signalised intersection to complete all its
phases.
deflection The deviation of a vehicle from conducting a straight through movement
delay The period of time one is stopped from completing their desired movement
gap The time interval between the departure at a point of one vehicle and the arrival at the same point of the next vehicle. geometric delay The distance one is forced to conduct from completing their
desired movement
giveway The act of slowing down or stopping to check or stop for a an oncoming vehicle at an intersection.
grade separated interchange
An intersection that separates the two conflicting roads vertically so they are free to complete their desired movement without the act of giving way.
headway The distance in time or space that seperates two vehicles travelling the same route
intersection at grade An intersection where carriageways cross at a common level. lane saturation The volume of traffic that occupies the lane at present time
divided by the total capacity the lane is able to occupy. level of service A qualitative measure describing operational conditions
within a traffic stream, and their perception by motorists and/or passengers.
LinSig A computer software program developed in the UK to determine the capacities of intersections.
passenger car equivalent (pce)
The equivalent ratio that a mode of transport has on the capacity of the intersection compared to a single car. passenger car unit
(pcu) The equivalent ratio that a mode of transport has on the capacity of the intersection compared to a single car. pedestrian A person travelling on foot
queue A line of waiting people or vehicles red clearance time
(s)
The time in seconds relating to the clearance between two entering vehicles into an intersection from two opposing legs. roundabout A road junction at which traffic moves in one direction round
a central island to reach one of the roads converging on it. rural Of relating to, or characteristic of the country
through lane A lane provided for the use of vehicles proceeding straight ahead.
traffic The passage of people or vehicles along routes of transportation.
traffic circle Large roundabouts that allowed entering traffic the right of way.
urban Of relating to, or located in a city.
1. INTRODUCTION
Roundabouts have been adopted throughout the world to govern the traffic flow at intersections for variable traffic demands. They generally consist of four approaching legs of traffic, that give way to circulating traffic navigating around a central island (usually circular).
Roundabouts can be used in many different situations within a road network. They can be adopted in both low and high traffic volumes with the measures to increase safety and improve capacity of an intersection. A few key features determine what specific type of roundabout is needed, these features include:
• traffic demand • size
• environment
These factors impact on the design characteristics such as the speed of entry and exits, the diameter of roundabout, number of circulating lanes and ability to service daily traffic flows. The Federal Highway Administration (FHWA, 2010) class roundabouts into six main categories, these include:
1. Small residential roundabouts 2. Compact urban roundabouts 3. Urban single lane roundabouts 4. Rural single lane roundabouts 5. Urban two lane roundabouts 6. Rural two lane roundabouts
This report will examine the capacity for urban and rural two lane signalised roundabouts. LinSig and excel computer software will be used to determine the capacities of signalised roundabouts under a certain signal phase. Traffic flow characteristics will be input into the LinSig and excel models based on an Australian analytical approaches with supportive research based from around the world.
These capacities will be compared to conventional un-signalised roundabouts to determine if the signalisation of a roundabout is an effective means to increase the capacity of the intersection.
1.1 Problem
Statement
The research undertaken in this report has been developed in response of replacing existing roundabouts that are failing to provide an adequate level of service to increasing traffic demands. The normal progression in Australia has been to replace non-performing roundabouts with a typical signalised intersection or to a greater extent grade separated interchange. This incurs costs of removing the existing roundabout as well as its footprint and reshaping the intersection to the desired signalised intersection geometry.
This report will examine whether installing (retro-fitting) signals to an existing un-signalised roundabout will help improve the capacity of the roundabout and in turn improve the life span of the intersection at a more cost effective solution than replacing with a new signalised intersection layout.
1.2 Project
Objectives
• A complete review of local and overseas researches on traffic flow characteristics at un-signalised and signalised roundabouts.
• Develop traffic capacity models with various radii using Excel and LinSig, LinSig is a computer software programme that assesses the design of signalised roundabouts and intersections.
• Establish relationships between design parameters (radius, cycle times, queue discharge headways) and the capacity of a signalised roundabout.
2. BACKGROUND
This section aims to provide background information based from research sought globally on the history, research and implementation of roundabouts around the world. The information from the background will be used as the basis in the required aims and hypotheses of the project.
2.1 Un-signalised
Roundabouts
‘Traffic circles have been part of the transportation system in the United States since 1905, when the Columbus Circle designed by William Phelps Eno opened in New York City’ (FHWA 2000, p 2). These traffic circles were unlike modern roundabouts today as they gave entering traffic the right of way, thus causing the circulating traffic to give way. This developed numerous problems with roundabouts which involved locking up of traffic around the central island, aiding high speed entry and the merging and weaving of vehicles leading to severe crashes.
After numerous traffic mishaps within these traffic circle intersections in the United States, the Americans decided to abandon the traffic circle designed intersections. The British decided to continue to develop and refine the design of these traffic circles and came up with the mandatory give way rule that allowed the development of modern roundabouts to continue to become safe and effective intersections.
‘In 1966, the United Kingdom adopted mandatory “give-way” rule at circular intersections, which required entering traffic to give way, or yield, to circulating traffic’ (FHWA 2000, p 2). By adopting this rule, roundabouts became free flowing as it did not allow vehicles to enter the roundabout until there was a sufficient gap in the circulating traffic.
The differences of modern roundabouts from the traditional traffic circles include:
• Roundabouts require entering drivers to give way to all traffic within the roundabout. • Roundabouts allow the inner lane of a multi lane roundabout to exit.
• Deflection on entry is used to maintain low speed operation in roundabouts. • Pedestrians are permitted from the central island of a roundabout.
The United States of America finally adopted the design of the modern roundabout in 1990 in Summerlin, Las Vegas. Since then USA have adopted the modern roundabout and as of December 2009 the number of modern roundabouts in the USA was approximately 2,300.
In 1984, the French government adopted the mandatory give way rule to circulating traffic and as of mid-1997 there are about 15,000 modern roundabouts in France (Jacquemart 1998). In addition to their popularity in Great Britain and France, roundabouts are very common in Germany, Switzerland, Spain and Portugal. ‘Outside of Europe the modern roundabout is a standard feature in Australia and it is becoming more common in New Zealand, South Africa and Israel’ (Jacquemart 1998, p 11).
2.1.1 Australia
Roundabouts were adopted extensively during the 1980’s in Australia due to the benefit of less severe crashes and a relatively low crash rate between motor vehicles compared to other intersections. The three main factors which have led to the replacement of roundabouts to a signalised intersection are as follows:
1. Capacity issues in saturated flow periods. 2. Safety for Cyclists
3. Safety for Pedestrians
Capacity issues arise in saturated conditions due to limited gap space for entering vehicles. This is compounded when there is a dominant leg which creates large queue lengths for the opposing entering traffic. Capacity issues will be discussed more in depth in the next section of the report.
A study in New South Wales by Robinson (1998) found:
• 6% of those injured at cross sections were cyclists compare with 18% at roundabouts. • At non-metropolitan roundabouts, 32% of those injured in 2-party crashes were
cyclists.
• Cyclist were responsible for 16% of the crashes in which they were involved.
‘Under National Transport Commission, (Road Transport Legislation, Australian Road Rules) Regulations 2006 vehicles leaving a roundabout are not obliged to give way to pedestrians’ (Austroads 2011, p 48). This makes roundabouts inappropriate when there is a high level demand of pedestrians.
2.2 Signalised
Roundabouts
‘Signalisation of roundabouts was first experimented in 1959 in the United Kingdom (UK) to prevent circulating traffic from blocking entering traffic during peak periods’ (DFT, 2009). Although with the introduction to the mandatory give way rule in 1966, which allowed un-signalised roundabouts to become more effective, they still had issues arising from unbalanced flows causing limited gap space for entering vehicles.
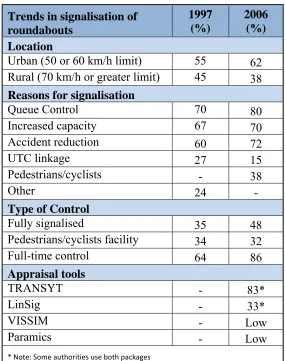
[image:22.595.155.441.353.714.2]‘There has been a rapid increase in the installation of signal controlled roundabouts in the UK since the early 1990s’ (DFT, 2009). Table 2.1 shows a comparison from 1997 & 2006 of the reasons for signalisation on roundabouts, taken from 49 authorities on 161 signalised roundabouts within the United Kingdom.
Table 2.1 – Comparison of Surveys 1997/2006 (DFT, 2009)
Trends in signalisation of roundabouts
1997 (%)
2006 (%)
Location
Urban (50 or 60 km/h limit) 55 62 Rural (70 km/h or greater limit) 45 38 Reasons for signalisation
Queue Control 70 80
Increased capacity 67 70
Accident reduction 60 72
UTC linkage 27 15
Pedestrians/cyclists - 38
Other 24 -
Type of Control
Fully signalised 35 48
Pedestrians/cyclists facility 34 32
Full-time control 64 86
Appraisal tools
TRANSYT - 83*
LinSig - 33*
VISSIM - Low
Paramics - Low
The data received from the comparison show a greater trend towards full time signal control to improve queue control, increase capacity and improve safety.
Safety of pedestrians and cyclists through roundabouts has been a major issue around the world with various designs used to enable these movements throughout modern roundabouts. Signalisation of roundabouts provides an effective and safe route for both pedestrians and cyclists which have led to the increase in signalisation of roundabouts.
3. LITERATURE REVIEW
This literature review will detail the necessary information to ensure the variables affecting the capacity of roundabouts are understood and accounted for. This information will provide the structure for the variable inputs into the computer software modelling to determine the capacity of a two lane signalised roundabout.
3.1 Un-signalised
roundabouts
3.1.1 General
‘Roundabouts are circular intersections with specific design and traffic control features. These features include give-way control of all entering traffic, channelised approaches and appropriate geometric curvature to ensure that travel speeds on the circulatory roadway are typically less than 50km/h’ (FHWA 2000, p 5). Roundabouts can be classed into six main categories as shown in Table 3.1 below.
Table 3.1 – Design characteristics for each six roundabout categories (FHWA 2000, p 13)
Design Element RoundaboutMini CompactUrban SingleUrbanLane DoubleUrbanLane SingleRuralLane DoubleRuralLane
Recommended maximum entry
design speed
25 km/h
(15 mph) (15 mph) 25 km/h (20 mph) 35 km/h (25 mph) 40 km/h (25 mph) 40 km/h (30 mph) 50 km/h
Maximum number of entering lanes
per approach
1 1 1 2 1 2
Typical inscribed
circle diameter (45ft to 80ft) 13m to 25m
25m to 30m (80ft to 100ft) 30m to 40m (100ft to 130ft) 45m to 55m (150ft to 180ft) 35m to 40m (115ft to 130ft) 55m to 60m (180ft to 200ft) Splitter island treatment Raised if possible, crosswalk cut if raised Raised, with crosswalk cut Raised, with
crosswalk cut crosswalk cut Raised, with
Raised and extended, with crosswalk cut Raised and extended, with crosswalk cut Typical daily service volumes on 4‐leg roundabout (veh/day)
10,000 15,000 20,000 40,000 to 50,000 20,000 40,000 to 50,000
This report will be focused on rural two lane roundabouts. The key geometric elements of a rural two lane roundabout are shown in Figure 3.1.
Figure 3.1 – Geometric elements of a roundabout. (Austroads 2007, p 36)
Table 3.2 – Descriptions of key roundabout features.
Feature Description
Approach Curve The approached curve is used to slow the operating speed of vehicles coming from a high speed environment.
Entry Curve The entry curve is used to deflect and slow entering vehicles to an appropriate speed to safely circulate the roundabout.
Entry Width The entry width is the width of the entry where it meets the circulating carriageway.
Holding Line The holding line is pavement marking that defines where the vehicles have to give way to the circulating traffic. It is generally marked along the inscribed circle.
Circulating Carriageway
The circulating carriageway is a curved path used by vehicles to travel around the central island. This is defined by painted line marking. Circulating
Carriageway Width
Defines the roadway width for vehicle circulation around the central island. The circulating carriageway width has to be wide enough to accommodate the largest design vehicles turning path.
Exit Width The exit width is the width of the exit where it meets the circulating carriageway.
3.1.2 Capacity
The Highway Capacity Manual (HCM, 2010) defines the capacity of a facility as ‘the maximum hourly rate at which persons or vehicles can reasonably be expected to traverse a point or uniform section of a lane or roadway during a given time period under prevailing roadway, traffic and control conditions.’
The capacity of a roundabout depends on two major principles: • The effect of traffic flow and driver behaviour,
• The effect of roundabout geometry.
3.1.2.1 Effect of traffic flow and driver behaviour
Different driver behaviours are experienced around the world. Some drivers in certain countries may approach a roundabout at a higher speed or accept a smaller gap upon entry into the roundabout, which has an impact on the capacity of the roundabout.
There are several effects of driver behaviour that are consistent across the world that have an impact on the capacity of a roundabout. The effects from driver behaviour on traffic flow are:
• Effect of exiting vehicles – The effect of exiting vehicles may have an impact on when the entering vehicle feels comfortable to enter the circulating carriageway. This effect is similar to a vehicle wishing to turn left into the lane a vehicle is exiting, the driver may not feel comfortable to exit until the vehicle is in the motion of turning even if the vehicle has indicated on turning left.
• Changes in effective priority – When the roundabout is under saturated conditions driver behaviour becomes more aggressive. Instead of entering traffic providing the required gap as to not disrupt the circulating traffic, the vehicles are more likely to forcefully enter requiring the circulating traffic to give way to the entering traffic. • Origin to destination patterns – This has an impact if there is a heavy through or right
The effects of driver behaviour can be so variable that it is difficult to model for capacities accurately based on computer software. Inputs for driver behaviour within computer software modelling should be based on extensive field testing on real life conditions with similar geographic conditions.
3.1.2.2 Effect of roundabout geometry
The geometry of a roundabout can have an impact on the capacity of a roundabout in the following areas:
• ‘It affects the speed of vehicles through the intersection, thus influencing their travel time by virtue of geometry alone (geometric delay)’ (FHWA 2010, p4-5).
• The larger the diameter of the roundabout provides more capacity within the circulating carriageway.
• The width of the circulating carriageway, entry widths and exit widths have an impact on the capacity and can govern the speed at which drivers feel comfortable to enter and navigate around the roundabout.
• ‘It can affect the degree to which flow in a given lane is facilitated or constrained. For example, the angle at which a vehicle enters affects the speed of that vehicle, with entries that are more perpendicular requiring slower speeds and thus longer headways. Likewise, the geometry of multilane entries may influence the degree to which drivers are comfortable entering next to one another’ (FHWA 2010, p4-5).
• ‘It may affect the driver’s perception of how to navigate the roundabout and their corresponding lane choice approaching the entry’ (FHWA 2010, p4-5).
The capacity of a roundabout is mainly dependent on the amount of approaching lanes and circulating lanes. The capacity is also affected more subtly by entry curves, entry widths and lane widths. There has been extensive research done into the capacity of two lane roundabouts across the world. Generally it is found that the capacity of a two-lane roundabout is expected to be between 40,000 to 50,000 vehicles per day.
Figure 3.2 shows research conducted by the Federal Highway Administration into the capacity of a two lane roundabout. The capacity forecast is based on simplified UK empirical regression methods that differ from Australia and USA methods of gap acceptance theory.
It identifies that the maximum entry flow reaches a maximum of 2400 veh/hr when there is no circulatory flow. On the contrary it shows that when the circulatory flow reaches approximately 3400 vehicle per hour, no vehicles are able to enter into the roundabout adding to the capacity.
Figure 3.2 – Approach capacity of a two-lane roundabout (FHWA 2000, p 88)
The HCM (2010) defines the capacity of two lane roundabouts with two circulating flows as:
1Ce,R,pce = 1,130e(-0.0007)υc,pce
2Ce,L,pce = 1,130e(-0.00075)υc,pce
Where:
Ce,R,pce = capacity of the right entry lane, adjusted for heavy vehicles (pc/hr), Ce,L,pce = capacity of the left entry lane, adjusted for heavy vehicles (pc/hr), and υc,pce = conflicting flow rate (total of both lanes) (pc/hr).
1 Right lane corresponds to left lane in Australia and UK.
2 Left lane corresponds to right lane in Australia and UK.
(3.1)
Figure 3.3 has been developed based on these equations to produce the capacity estimates of single-lane and multilane entry capacities.
Figure 3.33 – Capacity of Single-Lane and Multilane entries (HCM 2010, Exhibit 21-7)
These findings represented in Figures 3.2 & 3.3 show the entering capacities for a leg into a roundabout against a conflicting circulating flow rate. This can make it hard when comparing the total capacity of the intersection to a signalised case. Tan (2001) determined a formula to assess the full capacity (Qfcr) of a roundabout under fully saturated conditions. The formula is:
Qfcr = 4F / {1/к + [β*Rh + 2Rr) + α ] *f} (3.3)
Where;
F = coefficient (represented in equation 3.4) f = coefficient (represented in equation 3.4) к = lane entry factor, 2 lanes in entry = 1.4 – 1.6
β = circulating carriageway lane factor, 2 lanes in circulating carriageway = 0.6 – 0.8 α = determined from Figure 3.4 (Lba is the distance between diverging point at exit and converging point at entry)
Rh = Ratio of through movements to all movements Rr = Ratio of right turn movements to all movements
Here we can see the effect the right turn movements have on the capacity of the roundabout. The entry capacity is affected by the right turn movements from the opposite entry lanes along with the through and right turn movement from the entry lanes on the right side of the entry.
Tan (2001) states that Swiss guide to roundabout design has determined the coefficients for F and f for fully saturated conditions based on the entry capacity researched in England, France and Switzerland (Qe):
Qe = F – Qg*f (3.4)
Where;
Qg = conflicting flow
The Swiss guide calculates the coefficients F & f based on:
Qe = к[1500 – (8/9)*Qg] Therefore, F = 1500
f = 8/9
These coefficients are to reflect at saturated conditions.
Pedestrians can reduce the entry capacity of a roundabout if they assert right-of-way on vehicles entering the roundabout. Worldwide there are different rules and regulations regarding the right-of-way of pedestrians in regards to roundabouts. In Australia vehicles are not obliged to give way to pedestrians upon exiting the roundabout according to the National Transport Commission.
Research by (Brilon, Stuwe, and Drews 1993) determined a reduction factor for pedestrians on the capacity for a two lane roundabout which is represented in Figure 3.5. This reduction factor can be used to compare capacities to signalised roundabouts which gives priority to pedestrians. This will provide similar intersection characteristics between un-signalised and signalised roundabouts.
Figure 3.5 – Capacity reduction factor for a two lane roundabout assuming pedestrian priority. (Brilon, Stuwe, and Drews 1993)
3.2 Signalised
Roundabouts
3.2.1 General
The geometric elements of a signalised roundabout are the same as the geometric elements of a standard un-signalised roundabout, accept with the addition of traffic signals and possible hold lines within the circulating carriageway. Hold lines within the roundabout are used when there is a high pedestrian and cyclist demand to allow traffic completing a U-turn to give way to crossing pedestrians and cyclists.
Shown in Figure 3.6 is a geometric layout of a proposed signalised roundabout without pedestrian and cyclist demand.
Figure 3.7 shows a typical configuration of a signalised roundabout with pedestrian and cyclist demand.
Figure 3.7 – Geometric elements of a signalised roundabout with pedestrian and cyclist demand
3.2.2 Signalisation and Phasing
Shown below in Figures 3.8 and 3.9 is the general phasing structure used for signalised roundabouts in the United Kingdom. The entry lanes are represented by the letters B, D, F, H and the inner phase is represented by the letters A, C, E, G in Figure 3.7.
A
B
C
D
E
F
G
H
Figure 3.8 – General phasing structure of signalised roundabouts in the United Kingdom
A
B
1 Min >= 7
A
B
2 Min >= 7
C
D
1 Min >= 7
C
D
2 Min >= 7
E
F
1 Min >= 7
E
F
2 Min >= 7
G
H
1 Min >= 7
G
H
2 Min >= 7
The staging of the phase sequence can be seen from Figure 3.9 where the inner phases of A, C, E and G proceed before the entry lanes represented by B, D, F and H. The phase sequence follows a clockwise rotation around the roundabout with the inner phases proceeding before the entry lane phase to clear the roundabout before the addition of more vehicles within the circulating carriageway. This can be seen more diagrammatically in Appendix D.
The general inter-green time between all phases is set at two seconds to allow the clearance of the last vehicle entering under the current green phase from the approach of the following green phase. The phasing is optimised between both inner and outer phases that work concurrently with other grouped inner and outer phases. For example phase A can run concurrently with phases D, E and H and phase B can run concurrently with phases C, F and G. Attached in Appendix B is an example of a signal timings scheme for a 60 second cycle time.
Generally phase times within signalised roundabouts are kept short to allow quick rotation between phases to clear the inner circulating carriageway. Using this procedure allows the entering vehicles to be unaffected by stored queues within the circulating carriageway and allows them to effectively navigate to their desired destination.
3.2.3 Capacity
The installation of traffic signals has numerous effects on the capacity of a roundabout both in a saturated and un-saturated flow period. In saturated flows it eliminates the need for vehicles to find an acceptable gap to enter the roundabout and can control queuing caused from the demand of a singular heavy leg.
However it alters the traffic flow characteristics of the intersection to resemble a typical signalised intersection. This makes the intersection insufficient when there is a low traffic demand as it takes away the free flowing characteristics of an un-signalised roundabout forcing vehicles to stop in accordance with the phasing.
signalisation eliminating the drivers need for gap acceptance, which heavily reduces the impact on driver behaviour towards capacity.
The entry capacity for a signalised roundabout treatment can be effectively worked out by:
Q = su (3.5)
Where,
Q = capacity (veh/hr)
s = saturation flow rate (queue discharge) (veh/hr)
u = proportion of time vehicles can depart from the queue
In order to get the saturation flow rate for vehicles entering into the intersection the following equation is used:
s = 3600/hs (3.6)
Where,
hs = queue discharge headway (seconds)
To find the proportion of time the vehicles are able to discharge into the intersection the following equation is used:
u = g/c (3.7)
Where,
g = effective green time (seconds) c = cycle time (seconds)
The capacity of a signalised roundabout is still affected by the roundabout geometry much the same as the impact it has on un-signalised roundabouts.
There are three key features between signalised roundabouts and conventional signal controlled intersections that impact on the capacity of the intersection. These are:
• The geometric elements of the intersections.
• The ability to store vehicles within the circulating carriageway of a roundabout.
These features make comparing capacities of signalised roundabouts to signal controlled intersections unreliable and should not be used as a basis to judge the capacity of a signalised roundabout on.
Although there is extensive research done into the capacities of signalised intersections and how they compare to un-signalised roundabouts, there is little research done into the capacities of signalised roundabouts due to the relatively new implementation of them.
A recent study (Bernetti, Dall’Acqua & Longo 2003) based on the three lane circulating roundabout at Piazza Maggi (Milan) shown in Figure 3.10, compared the mean delays of the roundabout for un-signalised and signalised conditions based on three analytical approaches.
Figure 3.10 – Piazza Maggi Layout (Bernetti,Dall’Acqua & Longo 2003, Figure 1)
The three approaches used were as follows:
Un-signalised approaches
• The Austroads (1993) Australian method used in Part 6 Guide to Traffic Engineering Practice.
Signalised approach
• The mesoscopic model developed from proceedings of the European Transport Conference A Mesoscopic model for evaluating Performance of signalised intersections (2002).
Currently the intersection is a signalised four-leg roundabout that has approximately 7000 passenger car unit per hour pass through the intersection in peak hour flows. The average entry and circulatory widths are 13m and the inscribed circle diameter is 100m. Figure 3.11 shows the comparison of the mean delays for each approach relating to a percentage of the 7000 peak hour flow.
Figure 3.11 – Results comparison in terms of mean delays (Bernetti,Dall’Acqua & Longo 2003, Figure 6)
This figure immediately shows that when the percentage of traffic approaches peak hour flows, the signalised control of the intersection keeps mean delays consistently around 30 seconds. If the roundabout were to be un-signalised the mean delay would rapidly increase on approach to peak hour flows, increasing from 5 seconds at 80% of peak hour flow to 70 seconds at 95% of peak hour flow.
3.3 Traffic flow characteristics
As this report analyses the capacity of both signalised and un-signalised roundabouts, this section will detail the parameters and characteristic used to determine the traffic flow of a roundabout intersection.
There are several key characteristics of traffic flow that influence the capacity of roundabouts such as gap acceptance, headway distribution, roundabout geometry, traffic fleet and lane widths. These characteristics need to be analysed to suit the geographical behaviours of the designed roundabout due to the varying nature of these characteristics across the world.
3.3.1 Gap Acceptance
Gap acceptance is critical in dealing with capacities for un-signalised roundabouts, as a vehicle has to assess when it is safe to enter into the circulating carriageway. The driver will make a decision as to what they think is a safe gap which ideally will not impact the circulating traffic. However during high circulating flow periods drivers tend to forcefully enter causing circulating traffic to give-way to entering vehicles. This is known as a forced gap and reversed priority.
Gap
Austroads (2008) states that, a gap is the magnitude of the time interval considered acceptable to undertake a manoeuvre into a conflicting traffic stream and depends on the road geometry site, the characteristics of the traffic and the nature of the manoeuvre itself. The definition of a gap presented to an entering vehicle is shown in Figure 3.12.
Lag
The gap accepted by the driver can be used by more than one vehicle. The following vehicles that enter within the gap that the first vehicle accepts is said to be using the lag. Lag is the distance in time between the entering vehicle and the successive vehicle in the major stream and is shown in Figure 3.13 (Drew 1968, p 177).
Figure 3.13 – Definition of lag (Irvena, 2010, Figure 3.4)
Critical Gap
During vehicle entry into the circulating carriageway there is a critical gap which all drivers will accept. The gap is known as the critical gap which is the minimum accepted gap by all drivers at all times. It is generally based on the observed gap acceptances and rejections at existing roundabouts.
For example, ‘Raff and Hart (1950) proposed a method in which a diagram similar to Figure 3.14 is plotted from field observations and the critical gap is taken to be the gap ‘T’
corresponding to the intersection of the acceptance and rejection curves’ (Austroads 2008).
‘Akçelik (2011) documented a critical gap range of 2.2 to 8.0 seconds and a follow-up headway of 1.2 to 4.0 seconds’ (Seiberlich 2001). These figures were based on dominant and subdominant lane utilisation discussed in section 3.4.1.1 of this report.
Further research from Akçelik (2011) shown in Figure 3.15 determines that when circulating flow approaches a higher capacity the critical gap of the dominant lane will accept a smaller gap. This relates to driver behaviour, as drivers experiencing longer delays will become more aggressive in accepting gaps and may cause circulating traffic to give-way forcing reversed priority.
Figure 3.15 – Critical gap with increased circulating flow (Akçelik, 2011)
3.3.2 Headways
Headway Distribution
Figure 3.16 – Definition of headway (Irvena 2010, Figure 3.6)
Follow-up Headway
The time that occurs between the first entering vehicle and successive following vehicles is called the follow-up headway. This is the distance measured from the same reference point on each successive car and can only be measured when there is a queue situation. This is shown in Figure 3.17.
Figure 3.17 – Definition follow-up headway (Irvena 2010, Figure 3.5)
Figure 3.18 – Signalised intersection acceleration headways (HCM 2010, Exhibit 4-6)
The observed headways are varied due to the acceleration of entry into the intersection. The HCM (2010) shows that after the fourth vehicle follow-up headways become consistent.
The HCM (2010) recommends using the fifth vehicle following the beginning of a green as the starting point for saturation flow measurements as shown in Figure 3.19.
Figure 3.19 – Concept of saturation flow rate and lost time (HCM 2010, Exhibit 4-7)
The value h represents the saturation headway which is the average constant headway measured after the fourth entering vehicle after being stopped by a traffic signal. The
saturation flow rate is computed by:
s = 3600 / h
Where:
s = saturation flow rate (veh/hr)
h = saturation headway (s)
The saturation flow rate stated in equation 3.3 is based on a green signal displayed for a full hour with the flow of vehicles continuously approaching at the same rate and no large headways in between vehicles.
Austroads states that “In many cases, a key decision for the traffic analyst is the selection of the type of headway distribution that is either:
• Most likely to correspond with the traffic situation under consideration.
• Likely to best match a set of headways that has been observed in field measurements.”
For the second case this report will base its follow-up headways on observed headways taken from signalised intersection field studies.
3.3.3 Traffic Composition
Traffic composition needs to be considered when determining capacities for both un-signalised and un-signalised roundabouts. The increase of heavy vehicles will reduce the capacities of the intersection due to their slow follow-up headways and increased size.
Akçelik (1997) recommended that passenger car equivalents (pce) per hour be used instead of vehicles per hour when the proportion of heavy vehicles is greater than 5%. Passenger car equivalents allow heavy vehicles to resemble a standard passenger vehicle to better represent the capacity of an intersection.
Typically the passenger car equivalent of a heavy vehicle is taken as 2.0. The Transport Research Board HCM suggests that the conversion factors for passenger car equivalents shown in Table 3.3 be used:
Table 3.3 – Conversion factors for passenger car equivalents (pce) (HCM 2010, Exhibit 4-5)
Vehicle Type Passenger Car Equivalent (pce)
Car 1.0
Heavy Vehicle 2.0
3.3.4 Saturation Flow
Saturation flow measures the volume to capacity ratio of a lane. It is based on the ratio of the volume of vehicles travelling through the lane to the capacity that the lane is able to provide. When the degree of saturation reaches 100% the lane is unable to allow any extra demand in vehicles, if more traffic demand is required the lane will be subject to increasing queue lengths.
Typical values used in TRL UK methods, for lane saturation flows for signalised roundabouts are 1900 pcu/hr. For turning movements under full signalised conditions a typical value of 1800 pcu/hr is used.
3.3.5 Roundabout Geometry
Inscribed diameter Un-signalised roundabouts
Akçelik (2011) states that with increased inscribed diameter capacity increases for un-signalised roundabouts and then decreases for very large diameters. Shown in Figure 3.20 is the capacity and critical degree of saturation based on a percentage scale of a 40m un-signalised diameter roundabout.
This shows that once the roundabout diameter approaches 4 times that of a 40m roundabout (160m) the capacity actually decreases. As this report will be based on inscribed diameters of 40m to 60m which are the most common two lane roundabout sizes found within Australia, it assumes that with the increased inscribed circle diameter the capacity of an un-signalised roundabout will increase.
Inscribed diameter Signalised roundabouts
Although there is not as much research into the effect of the inscribed diameter on signalised roundabouts compared to un-signalised there are three key areas that the inscribed diameter will impact on the capacity.
• It can cause longer clearance times between phases due to longer travel path of vehicle around the central island.
• The ability to use the circulating carriageway as storage area for vehicles in between phases
• The ability to use longer clearance times along with the geometry of the roundabout to phase signals effectively so that vehicles are still travelling within phase changes.
These points will be assessed within this report and will examine what impact the increased diameter has on the capacity of signalised roundabouts.
Entry Lane width and Number of entry lanes
The Federal Highway Administration (2000), states that the number of entry lanes is a major factor for capacity. The increased number of entry lanes effectively doubles the capacity of the roundabout.
This report will be based on providing two entry lanes for all four approaches into the circulating carriageway of the roundabout. The entry lane widths will be 4m wide providing an entry width of 8m in total. These entry lane widths are based on Roads and Maritime Services (RMS) NSW and Austroads guidelines found in Austroads (2011).
Circulating lanes
Circulating lanes should correspond to the number of entry lanes provided into the roundabout. This report will examine a two lane circulating carriageway with a circulating road width of 11m based on RMS and Austroads (2011).
Entry angle
The entry angle is governed by the bearing of the entry arm and the radius of the entry curve into the roundabout. It is desirable to provide a sight angle between 70° to 90° to provide efficient sight line for approaching traffic.
Entry angles for this research will be based on 90 degree intersection of entry arms with 50m radius entry curves.
Grades
‘It is generally not desirable to locate roundabouts in locations where grades through the intersection are greater than four percent’ (FHWA, 2000). Generally large two lane roundabouts are constructed on relatively flat grades. Due to this case grading will not be taken into account when calculating capacities of the roundabout.
3.3.6 Lane Widths
Standard lane widths used in Australia at roundabout intersections are 3.5m lanes that increase to 4m on entry into the circulating carriageway. The impact lane widths have on the capacity of roundabouts is said to be negligible.
The 3.5m lane width has been tested to produce the most effective saturation of flow per lane at a safe clearance width for vehicles and still is cost effective to build. The increase to 4m upon approach to the roundabout intersection is to provide extra width for turning vehicles within the entry radius and increase driver comfort with extra width for entering the intersection.
3.4 Analytical Methods & Capacity Measures
3.4.1 Analysis Methods for Un-Signalised Roundabouts
Across the world there has been the development of two dominant types of methods to determine the capacities of un-signalised roundabouts. These include the gap acceptance theory which is typically used in Australia & USA and empirical regression model which is typically used in UK, France & Switzerland. Shown in Table 3.4 are the analytical methods used throughout the world.
Table 3.4 – Analytical methods used across the world un-signalised roundabouts (Bernetti, Dall’Acqua & Longo 2003, p 3)
Analysis Method
Gap Acceptance
Theory
Empirical
Regression
Australia (Austroads) Capacity & Delay
France (SETRA) Capacity & Delay
France (CETUR) Capacity
Germany (Brilon) Capacity Capacity
Switzerland (VSS) Capacity
Switzerland (Bovy) Capacity
United Kingdom (Kimber) Capacity & Delay
USA (HCM) Capacity & Delay
Findings from the National Cooperative Highway Research Program (NCHRP, 2007) on US roundabouts found that the capacity of an un-signalised roundabout cannot be based on geometry alone. In fact it found that driver behaviour is the largest variable affecting roundabout performance although ‘geometry in the aggregate sense (number of lanes) has a clear effect on the capacity of a roundabout entry’ (Akçelik 2009).
The gap acceptance theory has been extensively developed by Akcelik who is the founder of SIDRA Solutions. This theory has been adopted in Australia as parameters used in this theory have been based on extensive field testing on Australian roads. This section will give a background on the two dominant theories developed for determining capacities of un-signalised roundabouts.
3.4.1.1 Analytical (Gap Acceptance)
The simplified gap acceptance theory is based on gap acceptance and headway measures stated in section 3.1.1 and 3.1.2 respectively. It determines the effective gaps produced from the circulating flow that allow entering vehicles into the roundabout. With increased circulating flow, gap acceptance decreases for entering vehicles causing increased delay times and queue lengths.
Akçelik (2007) claims that the approach of the SIDRA software gap acceptance approach goes beyond the simplified gap acceptance theory approach. ‘The current Australian analysis is largely based on field data collected and analysis procedures developed at ARRB’ (Troutbeck 1989).
The base parameters that define the capacity of the roundabout in this theory include:
• Inscribed circle diameter • Average entry lane width • Number of circulating lanes • Number of entry lanes • Entry capacity
• Ratio of entry flow to circulating flow
The importance of the dominant and subdominant approach plays an important role when dealing with multi lane roundabouts. This is due to the fact that right lane entering vehicles (left lane for US) have to find a gap across two lanes of circulating traffic where the left lane can enter only giving away to one lane.
Also taken into account in Akçelik’s gap acceptance theory is the use of passenger car equivalents (pce) to account for heavy vehicles. Akçelik (1997) recommended that pce per hour be used in place of vehicles per hour when the proportion of heavy vehicles surpassed 5%.
3.4.1.2 Empirical Regression (Geometric)
The empirical regression model was first developed in the UK by Kimber (1980). ‘In Kimber’s initial laboratory report (1980) he states that the dependence on entry capacity on circulating flow depends on the roundabout geometry’ (Seiberlich 2001). The five geometric elements Kimber defines as having an impact on the capacity of a roundabout are:
• Entry width • Entry flare
• Inscribed circle diameter • Angle of entry
• Radius of entry
Kimber (1980) makes two interesting remarks on the use of the gap acceptance theory. Kimber states that the gap acceptance theory fails to represent the drivers behaviour in giving-way on approach to the roundabout. He also comments that because of the variance in driver behaviour it is not practical to apply this theory across the world.
The empirical method does not allow for unequal lane utilisation as it is not based on singular lane approach use. This limits the empirical method as it does not cater for uneven approach demands which can be a critical parameter in dealing with multi lane roundabouts.
3.4.2 Analysis Methods for Signalised Roundabouts
Analysis methods for signalised roundabouts will be based on traffic theory approaches towards typical signal controlled sites. The main difference signalised roundabouts have to the typical signal controlled site is:
• Roundabout geometry is larger, therefore requiring a longer travel time to navigate through the intersection.
• The ability to store vehicles within the intersection.
• The ability to use longer clearance times along with the geometry of the roundabout to phase signals effectively so that vehicles are still travelling within phase changes.
The analysis method will be based on computer simulation using the computer software LinSig and Excel. The parameters used within Linsig are dealt within Section 3 of this report.
3.4.3 Control Delay
Delay is an important measure when analysing interrupted flow system elements. There are several types of delay, but control delay – the delay brought about by the presence of a traffic control device – is the principal service measure in the HCM 2010 for evaluating the level of service (LOS) at signalised and un-signalised intersections (HCM 2010, p 4-15).
Akçelik (2009) produces tables based on control delay relating to the level of service of the intersection. The control delay times relating to level of service criteria is shown below in Table 3.5.
Table 3.5 – Level of service definitions for vehicles based on delay (Source: Akçelik 2009, Table 4)
This criteria will be used on assessing the capacity of signalised roundabouts along with discussion of level of service in section 3.4.4.
3.4.4 Level of Service (LOS)
Austroads (2008) quotes “Level of service is a qualitative measure describing operational conditions within a traffic stream, and their perception by motorists and/or passengers.”
The level of service criteria simplifies the traffic flow parameters such as delay, speed, travel time, comfort, safety and freedom to manoeuvre into a simplified A to F scale, where A represents ideal conditions based on the traveller’s perspective and F represents the worst conditions.
Table 3.6 – Descriptions of Level of service for interrupted flow
LOS A
Primarily free flow operations at average travel speeds, usually about 90% of the FFS (free flow speed) for the given street class. Vehicles are completely
unimpeded in their ability to manoeuvre within the traffic stream. Control delay at signalised intersections is minimal.
LOS B
Reasonably unimpeded operations at average travel speeds, usually about 70% of the FFS for the street class. The ability to manoeuvre within the traffic stream is only slightly restricted and control delays at signalised intersections are not significant.
LOS C
Stable operations; however, ability to manoeuvre and change lanes in mid-block locations may be more restricted than at LOS B and longer queues, adverse signal coordina