Int. J. Electrochem. Sci., 14 (2019) 1670 – 1683, doi: 10.20964/2019.02.18
International Journal of
ELECTROCHEMICAL
SCIENCE
www.electrochemsci.org
Highly Sensitive Ascorbic Acid Sensor Based on Ionic Liquid
Functionalized Graphene Oxide Nanocomposite
Chunli Xu, Bin Liu, Wenjun Ning, Xuyun Wang*
Qingdao University of Science & Technology, Qingdao 266042, PR China
*E-mail: [email protected]
Received: 18 September 2018 / Accepted: 14 November 2018 / Published: 5 January 2019
A simple, convenient and highly sensitive sensor for ascorbic acid (AA) detection is presented. The sensor was prepared based on graphene oxide (GO) and ionic liquid (IL) 1-butyl-3-methylimidazolium hexafluorophosphate (BMIMPF6) nanocomposites. Scanning electron microscopy and Fourier transform
infrared spectroscopy were used to study the morphology and functionalization of the sensing materials. The electrochemical detection of ascorbic acid was studied by differential pulse voltammetry, utilising a GO-IL modified glassy carbon electrode (GCE) in a linear response range from 0.01 mM to 4.0 mM, which exhibited a relatively low detection limit of 3.33 μM (S/N=3 ). In addition, the GO-IL nanocomposite exhibited appreciable stability, reproducibility and selectivity. The electrochemical sensor can be used for the determination of ascorbic acid in actual drugs.
Keywords: Graphene oxide Ionic liquid Electrochemical sensor Ascorbic acid Differential pulse voltammetry (DPV)
1. INTRODUCTION
Ionic liquid (IL), a new green solvent, has many unique physicochemical properties, such as tunable chemical structure, wide electrochemical window, high thermal stability and biocompatibility [6-8]. In electrochemistry, IL is widely used for its excellent ionic conductivity and low volatility [9].
In biological samples, dopamine (DA), ascorbic acid (AA) and uric acid (UA) usually coexist. However, their oxidation peaks appear almost at the same potential during sensing with an unmodified electrode, which results in overlapping voltammetric responses and thus difficulty in differentiation [10]. Various methods for the determination of AA have been reported, such as electrophoresis [11], fluorescence [12], chemiluminescence [13], liquid chromatography [14], and electrochemical methods [15-18]. These methods show promising results in detecting AA, but professional equipment and technical requirements have to be used in the analytical process. Therefore, in recent years, more and more attention has been paid to electrochemical methods for its low cost, simple operation and less involved preparation methodology.
In this investigation, an electrochemical sensor was simply prepared with 1-butyl-3-methylimidazolium hexafluorophosphate ionic liquid (IL) and graphene oxide nanocomposite for highly specific AA detection. In addition, not only the performance of the electrochemical sensor but also actual samples analysis were analyzed. Therefore, GO-IL/GCE can be used for the application of electrochemical and biological sensors.
2. EXPERIMENTAL
2.1 Materials
Graphene oxide (GO) was obtained from Qingdao Huakomoene Technology Co. LTD. 1-butyl-3-methylimidazolium hexafluorophosphate (BMIMPF6) was purchased from the Lanzhou Institute of
Applied Chemistry of Chinese Academy of Sciences. Ascorbic acid (AA), dopamine (DA) and uric acid (UA) were procured from Aladdin Chemical Reagent Co. (China). 0.1M phosphate buffer saline (PBS) was prepared by mixing 0.1M NaH2PO4 and 0.1M Na2HPO4 at a volume ratio of 39:61. Acetonitrile,
ethanol and potassium chloride were purchased from Sinopharm Chemical Reagent Co. LTD. All chemicals and solvents were used without any further purification unless otherwise stated. 2.2 Apparatus
The morphology of the materials were carried out by scanning electron microscopy (SEM, JSM-6700F, JEOL). Fourier transform infrared spectroscopy (FT-IR) experiments were examined via BRUKER-TENSOR 27 FTIR spectrometer (Germany) with a scan range of 500-3000 cm-1.
2.3 Synthesis of GO-IL nanocomposite
The GO-IL nanocomposite was prepared according to the process, as in Scheme 1 [19]. In greater detail, graphene oxide and IL were mixed in agate mortar for 30 minutes at a ratio of 10:1, forming a uniform black paste. For preparation of GO-IL nanocomposite suspension, the nanocomposite was dispersed in acetonitrile to prepare 1.0% suspension under sonification for 1 hour.
2.4 Preparation of GO-IL/GCE
Before the electrode modified, GCEs were polished to a mirror-like on the surface of the suede with 0.3 and 0.05 μm alumina polishing powder, and then cleaned in ultra-pure water and ethanol in an ultrasound machine prior to drying in the air. Afterwards, 8 μL GO-IL was freshly suspended on a clean GCE surface and dried at room temperature. The corresponding modified electrodes were recorded as GO-IL/GCE, GO/GCE was also constructed by similar methods for comparison.
3. RESULTS AND DISCUSSION
3.1. Morphology and structural characteristics
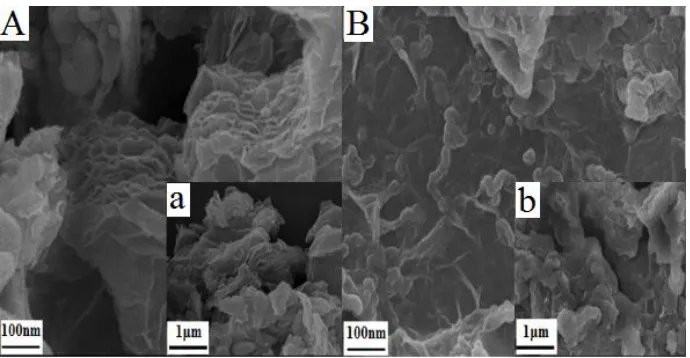
[image:3.596.121.466.507.686.2]Fig. 1 shows the SEM images of the GO under low (a) and high (A) magnification and of the synthesized GO-IL nanocomposite with low (b) and high (B) magnification. The graphene oxide material has a porous structures of loose nanosheets packed together, as evident from the high magnification image of Fig. 1. The nanocomposite produced by grinding graphene oxide and IL has an irregular porous fold structure (Fig. 1B). The irregular nanocomposite may be attributed to cation–π and/or π–π bonds between graphene oxide and ionic liquid.
The composition of nanocomposite materials was detected by FT-IR, and the results are shown in Fig. 2, where the absorption band of 1631cm-1 represents the skeleton vibration of graphene oxide
sheet. The C=O group in the acidic part on the edge of the graphene oxide sheet is near 1726 cm-1. It
should be noted that this structure feature should not hinder the electronic transfer performance of the graphene oxide. Furthermore, carboxyl group and epoxy group were observed around 1421 cm-1 and
1164 cm-1,respectively. When graphene oxide was mixed with IL, the bands at 1569 and 1463 cm-1 match
the stretching vibrations of the C-N bonds of ionic liquid imidazole aromatic system, while the bands of 836 cm-1 on behalf of the stretching vibration of P-F inside IL. The peak at 1726 cm-1 for C=O is also
[image:4.596.125.457.266.470.2]decrease. These results clearly indicate the successful preparation of the GO-IL nanocomposite.
Figure 2. FTIR spectra of GO (a) and GO-IL (b)
3.2. Electrochemical behaviors of electrodes
Electrochemical properties of different modified electrodes were characterized by cyclic voltammetry (CV) and electrochemical impedance spectroscopy (EIS) in 10 mM [Fe(CN)6]3−/4− solution
containing 0.1 M KCl. The resulting data is shown in Fig.3. The redox peak value of ferricyanide was gradually changed from low to high in GCE(curve a), GO/GCE(curve b) and GO-IL /GCE(curve c). We speculated that the increase of interfacial conductivity accelerates the electron transfer of potassium ferricyanide, and the active site and electrical conductivity of the binary composite were significantly improved after ionic liquid was added.
Electrochemical impedance spectroscopy (EIS) characterize the electron transfer resistance of GCE, GO/GCE and GO-IL/GCE. As shown in Fig.3(B), the impedance spectrum consists of a straight line and a semicircle representing the diffusion control process and the electrode surface charge transfer control process (Rct) [20]. Compared with the bare GCE, the GO/GCE has a clearly semicircular at higher frequencies, indicating that the GO on the GCE surface impeded the electron transfer of redox probe. Different from GO/GCE, after the addition of IL the Rct on GO-IL/GCE was decreased due to
3000 2500 2000 1500 1000 500
Tra
nsmit
ta
nce
Wavelength(cm-1) a
[image:5.596.57.542.144.333.2]
the exceptional electrical conductivity of IL, supporting that the GO-IL film on GCE can enhance the electron transfer process in the following electrochemical experiments. The conclusion could be that the synergy between GO and IL accelerates the electronic communication.
Figure 3. CVs (A) and Nyquist plots (B) of GCE (a), GO/GCE (b), GO-IL/GCE (c) in a mixture solution of 10.0 mM [Fe(CN)6]3-/4- and 0.1 M KCl with a scan rate of 100 mV/s.
3.3. Electrocatalytic oxidation of AA on modified electrodes
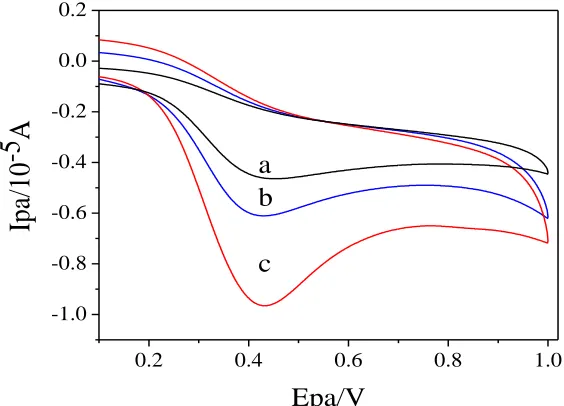
[image:5.596.143.425.502.705.2]Fig. 4 displays a comparison of sample CV responses obtained at various electrode systems for 0.5 mM AA in 0.1 M phosphate buffer (pH6.0). As shown in Fig. 4, a single peak corresponding to its electro-oxidation was observed in all the electrode systems.
Figure 4. Comparative CV responses recorded for 0.5 mM AA in 0.1 M phosphate buffers of pH 6.0 with a scan rate of 100 mV/s at (a) bare-GCE, (b) GO/GCE and (c) GO-IL/GCE.
0.2 0.4 0.6 0.8 1.0
-1.0 -0.8 -0.6 -0.4 -0.2 0.0 0.2
Ipa
/1
0
-5
A
Epa/V a
b
c
-0.2 0.0 0.2 0.4 0.6 0.8 -24
-16 -8 0 8 16 24
Ipa
/1
0
-5 A
Epa/V A
c
a
100 200 300 400 500 600 0
40 80 120 160 200
-Z''/o
h
m
Z'/ohm a
b
With the bare GCE the oxidation peak was observed at a peak potential of 0.43 V vs. Ag/AgCl 3 M KCl. After coating GO (Curve b), the peak intensity in CV significantly increased by almost 1.3-fold compared with bare-GCE. Surprisingly, GO-IL/GCE gave rise to the biggest oxidative peak with peak intensity in CV dramatically increasing by almost 2.1-fold compared with bare-GCE. From these electrochemical results noticed in CVs recorded over various electrode systems, it is safe to conclude that the presence of IL on GO significantly enhanced the electrocatalytic potential for facilitating the electron transfer kinetics of AA electro-oxidation [21]. The possible electrochemical reaction mechanism of AA on GO-IL/GCE was shown in scheme 1.
Scheme 1. The proposed electrochemical oxidation mechanism of AA adsorption on the GO-IL/GCE sensor.
3.4 Effects of pH
Figure 5. (A) CVs of 0.5 mM AA at GO-IL/GCE in 0.1 M PBS under different pH values: 3.0, 4.0, 5.0, 6.0, 7.0 and 8.0. (B) Effects of pH value on the peak current (a) and peak potential response (b) with a scan rate of 100 mV/s.
3.5. Effects of scan rate
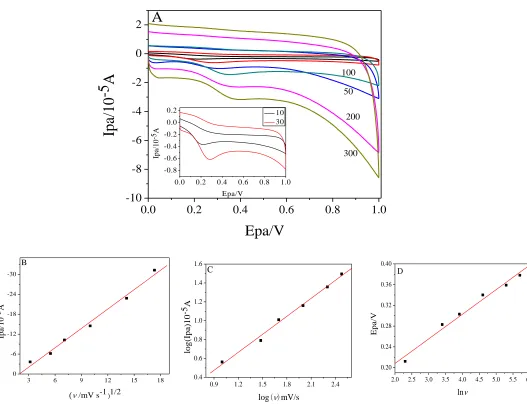
The effect of scan rate on kinetics of modified electrode was investigated. Fig. 6A shows the CVs. of AA at different scan rates of 10 to 300 mV/s−1. The peak current ( Ipa ) is linearly correlated with scan
rate squared root (Fig. 6B). The regression equation is
) 9943 . 0 ( 7486 . 3 ) / ( 9431 . 1 ) μ
( A =− v1/2 mV s + R=
Ipa , which indicates that the oxidation of AA is
controlled by diffusion. In Fig. 6C, the logarithm of peak current (log Ipa) has a linear relationship with logarithm of scan rate (logIpa=0.636logv−0.0978,R=0.9963). The slope value (0.636) is slightly higher than the theoretical value (0.5) of diffusion control process but less than that (1.0) indicating adsorption control [16]. This also confirms that the electrode process is diffusion-controlled. Besides, the regression equation of oxidation peak potential ( Epa ) and lnv is:
) 9909 . 0 ( 1129 . 0 ln 0475 . 0 )
(V = v+ R=
Epa (Fig. 6D). According to Laviron's theory, Epa can be expressed by Laviron equation [23] as follows:
nF)ln( / nF) ( / nF)ln
/ ( 0 0 RT RTk RT E
Epa = + + (1)
In the formula, α is the transfer coefficient of a completely irreversible electrode process, 0
k is
the standard rate constant, n is the number of electron transfers, v is scan rate, E0 is the formal redox potential, R is the gas constant, T is the absolute temperature and F is Faraday constant. According to the slope (equal to RT/nF) of the linear equation, the electron transfer number (n) is approximately 2(α=0.5,R=8.314J/(molK),T=298K,F=96485C/mol). Therefore, the oxidation of AA on GO-IL/GCE is a double electron and double proton process.
0.0 0.2 0.4 0.6 0.8 1.0
-2.4 -1.8 -1.2 -0.6 0.0 0.6 Ipa /1 0 -5 A Epa/V pH=3.0-8.0 A
3 4 5 6 7 8
Figure 6. (A) CVs of GO-IL/GCE in PBS pH=6.0 with 0.5 mM AA at different scan rate(10-300 mV/s). Inset is the enlarge figure of scan rate(10 -30 mV/s), (B) Ipa vs ν1/2, (C) logIpa vs logν and (D)
Epa vs lnν.
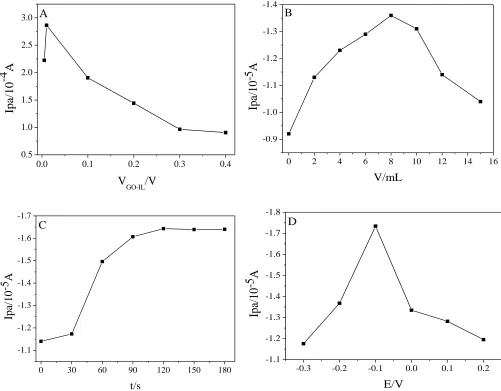
3.6. Effects of GO-IL content, accumulation time and potential
The effect of GO-IL proportion on the peak current response was subsequently investigated. As shown in Fig. 7A, it was found that when the acetonitrile dispersion ratio of GO-IL ranges from 0.5% to 1.0%, the peak current response rises constantly. On the contrary, peak current decreases when the ratio ranges from 1.0% to 40%, due to the difficulty of obtaining a dried modified electrode with higher ratios of GO-IL. Thus, we choose the ratio of 1.0% as the optimum condition. Furthermore, in Fig. 7B, the modifying amounts of GO-IL ranging from 0 μL to 15 μL were investigated and 8 μL of GO-IL suspension was selected as the ultimate amount.
0.0 0.2 0.4 0.6 0.8 1.0
-10 -8 -6 -4 -2 0 2
0.0 0.2 0.4 0.6 0.8 1.0 -0.8 -0.6 -0.4 -0.2 0.0 0.2 Ip a/ 10 -5A Epa/V 10 30
Ipa
/1
0
-5
A
Epa/V
A
100 50 200 3003 6 9 12 15 18
0 -6 -12 -18 -24 -30 Ipa /1 0 -5A
( /mV s-1)1/2
B
0.9 1.2 1.5 1.8 2.1 2.4
0.4 0.6 0.8 1.0 1.2 1.4 1.6 lo g (I p a)1 0 -5A
log()mV/s C
2.0 2.5 3.0 3.5 4.0 4.5 5.0 5.5 6.0
[image:8.596.32.559.85.489.2][image:9.596.52.553.201.592.2]
The effective concentration of AA on the electrode surface depends not only on the modification material but also on the performance of enrichment time and potential. In Fig. 7C, it shows a rising trend when the accumulation time increases from 0 to 120 s; it shows a slight downward trend, when the accumulation time increases from 120 to 180 s. Similarly, in Fig. 7D, the accumulation potential increases first and then decreases, the peak oxidation current of AA reaches its maximum at -0.1v. In conclusion, we choose the 120 s and -0.1 V as our optimized accumulation time and potential in the following experiments.
Figure 7. Effects of GO-IL content (A) and modifying amounts of GO-IL (B) accumulation time (C) and accumulation potential (D) on the oxidation peak current of 0.5mM AA in 0.1 M PBS (pH 6.0)
3.7. Chronocoulumetry
Additionally, the effective surface and saturated adsorption capacity (Γ) is usually used chronocoulometry and electrochemical effective surface area of the bare GCE, GO/GCE and GO-IL/GCE is used the following Anson equation (Fig. 8A) [24]:
0.0 0.1 0.2 0.3 0.4
0.5 1.0 1.5 2.0 2.5 3.0
Ipa
/1
0
-4 A
V
GO-IL/V
A
0 2 4 6 8 10 12 14 16
-0.9 -1.0 -1.1 -1.2 -1.3 -1.4
Ipa
/1
0
-5 A
V/mL B
0 30 60 90 120 150 180 -1.1
-1.2 -1.3 -1.4 -1.5 -1.6 -1.7
Ipa
/1
0
-5A
t/s C
-0.3 -0.2 -0.1 0.0 0.1 0.2 -1.1
-1.2 -1.3 -1.4 -1.5 -1.6 -1.7 -1.8
Ipa
/1
0
-5 A
ads Q Q t nFAcD t
Q( )=(2 1/21/2)/π1/2+ dl+ (2)
A is the electrode surface area, n is the number of electron transfer, F is Faraday constant, c is the substrate concentration, D is the diffusion coefficient (K3[Fe(CN)6], 7.6×10⁻⁶ cm2 s−1 at 25℃) [25],
dl
Q is capacitance electricity, Qds is the Faradaic charge. In Fig. 8A (inset), Q represents the corresponding linear relation of 1/2
t . The corresponding A values of bare GCE, GO/GCE and GO-IL/GCE were calculated as 0.0220, 0.0371 and 0.0563 cm2, respectively. It comes to a conclusion that
the effective electrode area of GO-IL/GCE increased obviously, the active part increased, and the detection sensitivity of AA increased significantly. The diffusion coefficient D and Qads of AA on GO-IL/GCE was measured in 0.1 M PBS (pH6.0) containing 0.5 mM AA by chronocoulometry (Fig. 8B). After the background deduction, the 1/2
t
Q− is also linear. Based on Eq. (2), D is 5.43×10⁻⁶cm2 s-1. According to the Laviron theory (Qads=nFAs), Γ is 8.71× 10⁻¹¹mol cm-2.
Figure 8. (A) Plot of Q-t curves of GCE (a), GO/GCE (b) and GO-IL/GCE (c) in 1 mM K3[Fe(CN)6]
containing 1 M KCl. Inset: plot of Q–t1/2 curve on GCE (a), GO/GCE (b) and GO-IL/GCE (c).
(B) Plot of Q–t curve of GO-IL/GCE in 0.1 M PBS (pH 6.0) containing 0.5 mM AA after background subtraction. Inset: plot of Q–t1/2 curve on GO-IL/GCE.
3.8. Differential pulse voltammetry (DPV) determination of AA
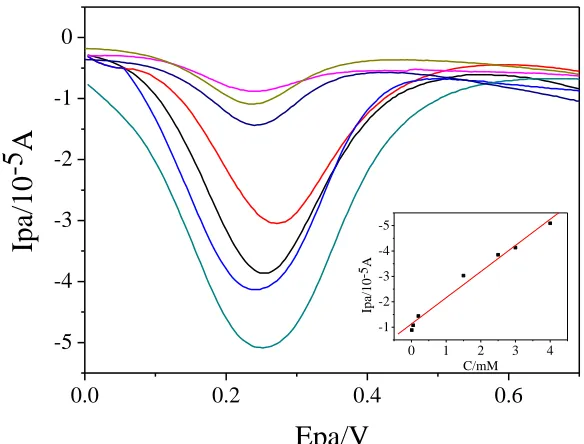
Under optimal conditions, DPV was used to conduct quantitative research of AA on GO-IL/GCE (Fig. 9). There is a linear relationship between peak current and AA concentration between 0.01 mM and 4.0 mM and the linear regression equation is Ipa(10−5A)=−1.03c(mM)−1.1293(R=0.9919). The limit of detection in this work was 3.33 μmol/L (S/N=3). This value is lower than those reported previously using other GO-related materials modified electrodes as illustrated in Table 1. These results clearly establish that the electrochemical sensing potential of GO-IL/GCE for AA is significantly better /comparable to materials purposefully designed for this purpose.
0.00 0.05 0.10 0.15 0.20 0.25
8 4 0 -4 -8 -12 -16
0 .1 0 .2 0 .3 0 .4 0 .5 0 -4 -8 -1 2 -1 6 Q/ C
t1 /2 /s1 /2 c b a Q/ C
t/s
c
b
a
A
0.00 0.05 0.10 0.15 0.20 0.25 0 -1 -2 -3 -4 -5 -6 -7
[image:10.596.58.520.287.504.2][image:11.596.132.424.94.316.2]
Figure 9. Differential pulse voltammogram of GO-IL/GCE in solution with different concentrations of AA (a-g : 0.01,0.05,0.2, 1.5, 2.5, 3.0 and 4.0 mM ) in the phosphate solution (pH 6.0) and calibration plot of AA with linear behavior in 0.01-4.0 mM (inset).
Table 1. Comparison of proposed sensor for the determination of AA with others
Modified electrodes Analytical method
linear range (mM)
Detection limit (μM)
Ref.
PPF/GNS/DE CV 0.4-6.0mM 120μM [26]
PrGO/PB-100/GCE CV 0.283-2.33mM 34.7 μM [27]
RGO/GCE DPV 0.04-1.0mM 4.2μM [28]
SGNF/IL/CS/GCE DPV 0.03-0.35mM 14.8 μM [6]
ATPMnG/GCE DPV 0.04-0.28mM 8.5 μM [29]
Trp-GR/GCE
Chitosan-graphene/GCE GO/PAN/GCE
ERGO/GCE PG/GCE
DPV DPV DPV DPV
Amperometry
0.2-3.4mM 3.4-12.9mM 0.05-1.2mM 0.15-1.05mM 0.5-2.0mM 0.009-2.314mM
10.09 μM 50 μM 50 μM 250 μM 6.45μM
[30] [31] [32] [33] [34]
GO-IL/GCE DPV 0.01-4.0 mM 3.33 μM This work
PPF/GNS:pyrolysed photoresist film/graphene nano-sheets;DE: a disc electrode(radius 1.5mm);
SGNF/IL/CS: stacked graphene platelet nanofibers/ionic liquid/chitosan;
ATPMnG: [5-(4-Aminophenyl) -10,15-20 –triphenylo porphyrin]Mn(III)-Graphene;
Trp-GR: tryptophan-functionalized graphene nanocomposite;
GO/PAN: graphene oxide-templated polyaniline;
ERGO: electrochemically reduced graphene oxide;PG: pristine graphene.
0.0 0.2 0.4 0.6
-5 -4 -3 -2 -1 0
0 1 2 3 4
-1 -2 -3 -4 -5
Ipa/10
-5A
C/mM
Ipa
/1
0
-5
A
3.9. Reproducibility, stability and interferences
To test the reproducibility of the proposed sensor for the estimation of AA, DPV measurements were carried out by reusing GO-IL/GCE for standard solutions of 0.5 mM AA in 0.1 M PBS of pH 6.0. During these measurements, it was noticed that the relative standard deviations (RSD) for the oxidation current of AA during these measurements were 4.3%. This indicates that GO-IL/GCE possesses excellent reproducibility. Five electrodes modified with GO-IL were prepared by the same method and 0.5 mM AA was measured. Relative standard deviation (RSD) was 4.1%. Additionally, the electrodes were placed at room temperature for 20 days to check their storage stability. The current peak signals were reduced by 8.90%, indicating good stability.
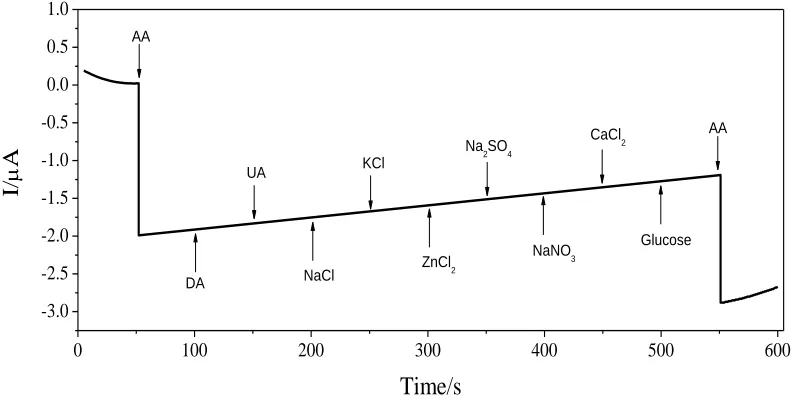
Amperometric i–t curves recorded for the successive additions of AA (pH 6.0) and possible interferants under homogenously stirred conditions are depicted in Fig. 10. The selectivity of sensor was examined by adding components that might co-exist, such as the concentration of DA and UA at 50 times. These interference species did not produce much amperometric response. In addition,, the effects of common interfering ions such as concentration of K+, Na+, Zn2+, Ca2+ , SO
42- , NO3- , Cl- and glucose
[image:12.596.101.499.429.631.2]at 100 times each on the amperometric response of the sensor was monitored, with each addition was introduced at an interval of 50 s. As evident from the i–t curves, even a very high concentration of these interfering ions had no interference on AA determination, where AA introduction showed a significant current response.
Figure 10. Amperometric i–t curves obtained using GO-IL/GCE electrode with the successive addition of AA (5×10⁻⁴ mol L-1) , DA (2.5×10⁻² mol L-1) , UA (2.5×10⁻² mol L-1) , NaCl (5×10⁻² mol L-1),
KCl (5×10⁻² mol L-1), ZnCl
2 (5×10⁻² mol L-1), Na2SO4 (5×10⁻² mol L-1), NaNO3 (5×10⁻² mol L-1),
CaCl2 (5×10⁻² mol L-1),glucose (5×10⁻² mol L-1) and AA (5×10⁻⁴ mol L-1) in 0.1 M PBS (pH 6.0)
at an interval of 50 s with applied potential 0.8 V.
0 100 200 300 400 500 600
-3.0 -2.5 -2.0 -1.5 -1.0 -0.5 0.0 0.5 1.0
AA
I/
A
Time/s
AA
DA UA
NaCl KCl
ZnCl2 Na2SO4
NaNO3 CaCl2
3.10. Practical analysis
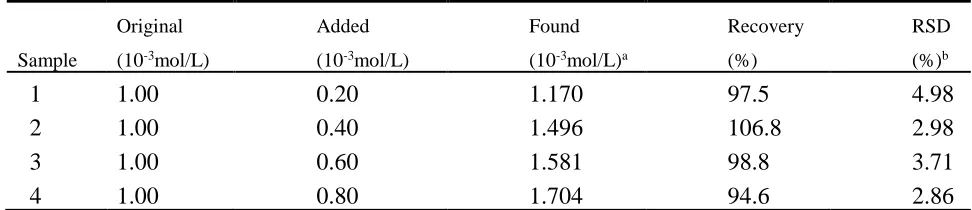
[image:13.596.54.540.253.358.2]The DPV technology was used to evaluate the actual performance of the sensor for quantitative determination of AA in drug samples, and the test results are shown in Table 2. For the preparation of the test solution with different concentration, vitamin C tablets (100 mg/tablet) were thoroughly ground in an agate mortar, dissolved in deionized water and filtered. The results showed that the recovery rate was between 94.6% and 106.8% and RSD was less than 4.98%. Therefore, GO-IL/GCE can be used to determine ascorbic acid in actual samples.
Table 2. Determination of AA in vitamin c tablets using GO-IL/GCE sensor (n=5)
a Mean of five measurements.
b Relative standard deviation for n = 5.
4. CONCLUSIONS
Such a simple, convenient and highly sensitive sensors coated with GO-IL sensitive layer are described for AA detection in this work. The introduction of ionic liquid ensures the GO-IL nanocomposite material own a large electroactive surface area and excellent sensitivity. The electrochemical sensor based on GO-IL nanocomposite showed a linear response range from 0.01 mM to 4.0 mM with a relatively low detection limit of 3.33 μM. Therefore, the sensitive electrochemical sensor can be widely used in determination of AA in drug sample.
ACKNOWLEDGEMENTS
The work was funded by the National Natural Science Foundation of China (21766032 and 51661008). References
1. S. Chambial, S. Dwivedi, K.K. Shukla, P.J. John and P. Sharma, Ind J Clin Biochem, 28 (2013) 314.
2. A. Abellán-Llobregat, L. Vidal, R. Rodríguez-Amaro, Á. Berenguer-Murcia, A. Canals and E. Morallón, Electrochim. Acta, 227 (2017) 275.
3. R. Brigeliusflohé, Ann. Nutr. Metab., 67 (2015) 13. 4. S.K. Vashist, J.H.T. Luong, Carbon, 84 (2015) 519.
Sample
Original
(10-3mol/L)
Added
(10-3mol/L)
Found
(10-3mol/L)a
Recovery
(%)
RSD
(%)b
1 1.00 0.20 1.170 97.5 4.98
2 1.00 0.40 1.496 106.8 2.98
3 1.00 0.60 1.581 98.8 3.71
5. E.L.K. Chng, M. Pumera, Chem.-Asian J., 6 (2011) 2899.
6. X.L. Niu, W. Yang, H. Guo, J. Ren, F.S. Yang and J.Z Gao, Talanta, 99 (2012) 984.
7. L.E. Barrosse-Antle, A.M. Bond, R.G. Compton, A.M. O'Mahony, E.I. Rogers and D.S. Silvester, Chem.-Asian J., 5 (2010) 202.
8. D.Wei, S.J. Wakeham, T.W. Ng, M.J. Thwaites, H. Brown and P. Beecher, Electrochem. Commun., 11 (2009) 2285.
9. E. Nagles, O. García-Beltrán and J.A. Calderón, Electrochim. Acta, 258 (2017) 512. 10.F.H. Li, J. Chai, H.F. Yang, D.X. Han and L. Niu, Talanta, 81 (2010) 1063.
11.J. Wang, M. Zhou, R. Dong, X. Cong, R. Zhang and X. Wang, Electroanalysis, 29 (2017) 2483. 12.R. Liu, R. Yang, C.J Qu, H.C. Mao, Y. Hu, J.J. Li and L.B. Qu, Sens. Actuators, B, 241 (2017) 644. 13.H.J. Chen, Q. Wang, Q.P. Shen, X. Liu, W. Li, Z. Nie and S.Z. Yao, Biosens. Bioelectron., 91
(2017) 878.
14.Y. SadamaSu, M. Morikawa, N. Sakamaki, K. Monma and C. KobayaShi, Food HYG.SAFE.SCI., 59 (2018) 11.
15.S. Pakapongpan, J.P. Mensing, D. Phokharatkul, T. Lomas and A. Tuantranont, Electrochim. Acta, 133 (2014) 294.
16.J. Lavanya, N. Gomathi, Talanta, 144 (2015) 655.
17.N.K. Bhajanthri, V.K. Arumugam, R. Chokkareddy and G.G. Redhi, J. Mol. Liq., 222 (2016) 370. 18.A. Abellán-Llobregat, C. González-Gaitán, L. Vidal, A. Canals and E. Morallón, Biosens.
Bioelectron., 109 (2018) 123.
19.S.R. Ng, C.X. Guo and C.M. Li, Electroanalysis, 23 (2011) 442.
20.T.R. Zhan, Z.W. Tan, X. Tian and W.G. Hou, Sens. Actuators, B, 246 (2017) 638.
21.S.A. Bhat, S.A. Pandit, M.A. Rather, G.M. Rather, N. Rashid, P.P. Ingole and M.A. Bhat, New J. Chem., 41 (2017) 8347.
22.F.R. Wang, J.Q. Yang and K.B. Wu, Anal. Chim. Acta, 638 (2009) 23. 23.E. Laviron, J. Electroanal. Chem. Interfacial Electrochem., 52 (1974) 355. 24.F.C. Anson, Anal. Chem., 36 (1964) 313.
25.L. Li, X.H. Liu, J.J. Lu, Y.L. Liu and X.Q. Lu, Anal. Methods, 7 (2015) 6595.
26.G.P. Keeley, A. O’Neill, N. Mcevoy, N. Peltekis, J.N. Coleman and G.S. Duesberg, J. Mater. Chem., 20 (2010) 7864.
27.P.L.D. Santos, V. Katic, K.C.F. Toledo and J.A. Bonacin, Sens. Actuators, B, 255 (2018) 2437. 28.P.K. Aneesh, S.R. Nambiar, T.P. Rao and A. Ajayaghosh, Anal. Methods, 6 (2014) 5322. 29.L. Chen, X.M. Guo, B. Guo, S.K. Cheng and F. Wang, J. Electroanal. Chem., 760 (2016) 105. 30.Q.W. Lian, Z.F. He, Q. He, A. Luo, K.W. Yan, D.X. Zhang, X.Q. Lu and X.B. Zhou, Anal. Chim.
Acta, 823 (2014) 32.
31.D.X. Han, T.T. Han, C.S. Shan, A. Ivaska and L. Niu, Electroanalysis, 22 (2010) 2001.
32.Y. Bao, J.X. Song, Y. Mao, D.X. Han, F. Yang, L. Niu and A. Ivaska, Electroanalysis, 23 (2011) 878.
33.L. Yang, D. Liu, J.S. Huang and T.Y. You, Sens. Actuators, B, 193 (2014) 166. 34.S.P. Qi, B. Zhao, H.Q. Tang and X.Q. Jiang, Electrochim. Acta, 161 (2015) 395.

![Figure 8. (A) Plot of Q-t curves of GCE (a), GO/GCE (b) and GO-IL/GCE (c) in 1 mM K3[Fe(CN)6] containing 1 M KCl](https://thumb-us.123doks.com/thumbv2/123dok_us/1756727.129251/10.596.58.520.287.504/figure-plot-curves-gce-gce-gce-containing-kcl.webp)