Int. J. Electrochem. Sci., 13 (2018) 8295 – 8302, doi: 10.20964/2018.09.04
International Journal of
ELECTROCHEMICAL
SCIENCE
www.electrochemsci.org
Short Communication
Synthesis and Characterization of Al
yCu
0.15Zn
0.85-yFe
2O
4Ferrite
Prepared by the Sol
-
Gel Method
Tagreed M. Al-Saadi1,*,Ahmed H.Abed2, Ayad Ahmed Salih1
1
Department of Physics, College of Education for Pure Science Ibn Al Haitham/ University of Baghdad, Baghdad, Iraq
2
The General Directorate for Education in Diyala, Diyala, Iraq
*
E-mail: [email protected]
Received: 3 May 2018 / Accepted: 3 July 2018 / Published: 5 August 2018
Nano powder of zinc ferrite with the chemical formula AlyCu0.15Zn0.85-yFe2O4 (y = 0.15, 0.30, 0.45,
0.60, 0.75) was synthesized by the sol-gel/auto combustion technique. The average crystallite size was found to be in the range of 28.82–42.27 nm, and the lattice constant decreased from 8.3958 to 8.2966 Å, while the density increased from 5.271 to 5.386 g/cm3 with increasing Al content. The dielectric loss factor (ɛ″), dielectric constant (ɛ′) and AC electric conductivity (σa.c) were studied, and it was
found that (ɛ′) and (ɛ″) decreased with increasing frequency, while the behavior of conductivity was the opposite. It was also found that there was a variation in the behavior of (ɛ′), (ɛ″) and (σa.c) based on
Al content, and the highest values were found for the sample with an Al content of x= 0.3.
Keywords: Al-Zinc ferrites, Nanoferrite, XRD, SEM, EDX, Dielectric properties.
1. INTRODUCTION
Zinc ferrites are a series of synthetic inorganic compounds of Zn and Fe (ferrite) with the formula of ZnxFe3−xO4, and this compound can be synthesized by different routes, such as chemical
sol–gel combustion [1,2], microwave-hydrothermal method [3], solid solution [4], and glyoxylate precursor [5], among other methods.
Zinc ferrites (ZnFe2O4) have a normal spinel structure with the space group Fd3m of the
general formula MFe2O4, and they have opened up a new outlook in the frontier area of materials
The recently developed wireless power transmission has been applied for many purposes, such as battery chargers for mobile devices, small home appliances and industrial distribution transfer systems, because of its advantage of massive power transfer [8].
The properties of these materials essentially depend on their structure, size and shape, which are highly determined by the sintering process, synthetic processes, and the type and amount of constituent elements or additives [9].
In this research, we report the preparation of nanoparticles of AlyCu0.15Zn0.85-yFe2O4 ferrites
(where y = 0.15, 0.3, 0.45, 0.6, 0.75) by using the sol–gel combustion technique. The prepared ferrites were investigated by XRD, SEM and EDX. The structural and dielectric properties of nanoparticles ferrites were studied.
2. EXPERIMENTAL
The nanopowders of ferrites were synthesized by using metal nitrates as a precursor. These nitrates include ferric nitrate (Fe(NO3)3.9H2O,99%), zinc nitrate (Zn(NO3)2.6H2O,99%), copper nitrate
(Cu(NO3)2.3H2O,99%) and aluminum nitrate (Al(NO3)3.9H2O,99%). In addition, citric acid (C6H8O7)
was used as a fuel in the ignition process. All metal nitrates used in the fabrication of (AlyCu0.15Zn 0.85-yFe2O4) ferrites (y =0.15, 0.3, 0.45, 0.6 and 0. 75, where the samples were named F1, F2, F3, F4 and F5
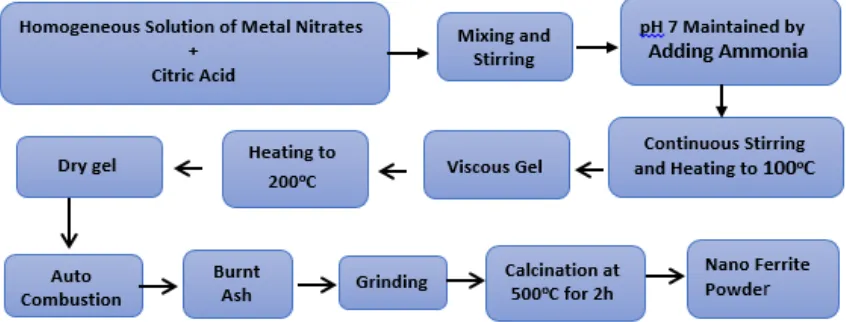
[image:2.596.89.512.538.699.2]respectively) were purchased from Merck, India without any purification. The nitrates were dissolved in a certain amount of distilled water by using a magnetic stirrer. After that, 1:1 molar ratio of citric acid to nitrates was added to the mixture. The pH of the mixture was adjusted to seven by adding ammonia drop by drop. When the pH of the solution reached 7, the temperature was raised to 100 °C until most of the water has evaporated and the formation of gels was observed. After that, the temperature was increased to 200°C. Then, the gel was ignited and turned into a thinning dry powder. After that, the powder was collected in a crucible and calcined at 500 °C for two hours. Figure (1) shows the schematic diagram of the preparation steps.
Figure 1. Schematic diagram representing the preparation of nanoferrites.
microscope (SEM) (model VEGA\\EasyProbe) and electron dispersive X-ray (EDX), which was attached to the SEM device and was used for the elemental chemical analysis. The dielectric features were investigated by using an LCR meter (6500p series, UK) in the frequency range of 50 Hz-1 MHz.
3. RESULTS AND DISCUSSION
3.1. X-ray Analysis
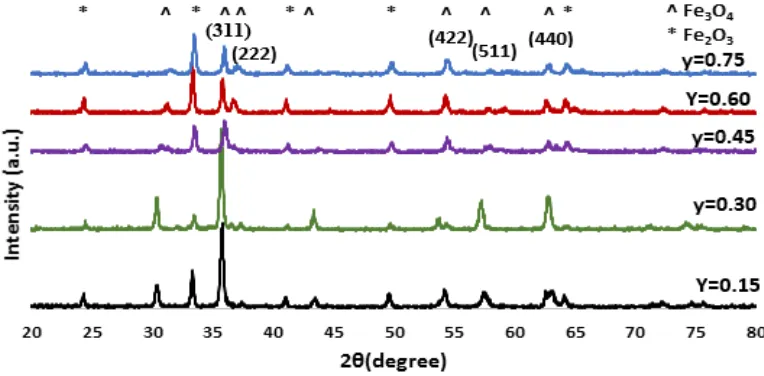
Figure 2 shows the patterns of X-ray diffraction of all samples calcined at 500 oC for 2 h. The structural properties of the synthesized samples were investigated in the range of 20° - 80°. From Figure (2), it can be observed that the XRD patterns perfectly match the standard pattern of JCPDS no. 19-0629 of the cubic spinel ferrite phase with the Fd3m space group. The most peaks of the AlyCu0.15Zn0.85-yFe2O4 were indexed to the crystal planes of spinel Zn ferrite (311, 222, 422, 511, and
[image:3.596.110.492.350.538.2]440) [10,11]. The extra reflection peaks of Zn ferrite were also found in all patterns, and the observation of these peaks is common, especially at low sintering temperatures [12].
Figure 2. XRD patterns of the AlyCu0.15Zn0.85-yFe2O4nanoferrites.
Table 1. The crystallite size, unit cell parameter and density for the AlyCu0.15Zn0.85-yFe2O4ferrites.
(y)Content Dave(nm) a(Å) Density g/cm3
0.15 28.82 8.3958 5.271
0.30 30.61 8.3732 5.301
0.45 32.56 8.3451 5.323
0.60 35.07 8.3174 5.343
0.75 42.27 8.2966 5.368
where ( ) is the (FWHM) in radians and 𝜆 is the wavelength of the X-ray. The lattice parameters were calculated by using Rietveld refinement. The average grain size, density and lattice parameters are shown in Table (1):
From Table (1), the average crystallite size of the nanoferrites samples was found to be in the range of 28.82 to 42.27 nm for different levels of Al3+ ions. Additionally, Table (1) shows the increasing size of the nanoparticles when the content of aluminum was increased. This can be attributed to several factors, including the flame temperature, i.e., the amount of fuel was not suitable for the automatic combustion process, and the appropriateness of the acid function; these two factors significantly affect the size of the nanoparticles, the crystal structure and the resulting powder morphology.[14]
The lattice constant (a) was decreased with the increase of Al3+ content, evidenced by the smaller ionic radii of the Al3+ ions (0.67 Å) than the Cu2+ ion (0.73 Å) and the Zn2+ ion (0.83 Å). The observed larger lattice parameter (8.3958 Å) of F1 may be due to the strong interactions between
Al-ZnFe2O4 compared to Cu- ZnFe2O4.[15]
3.2. The SEM Results
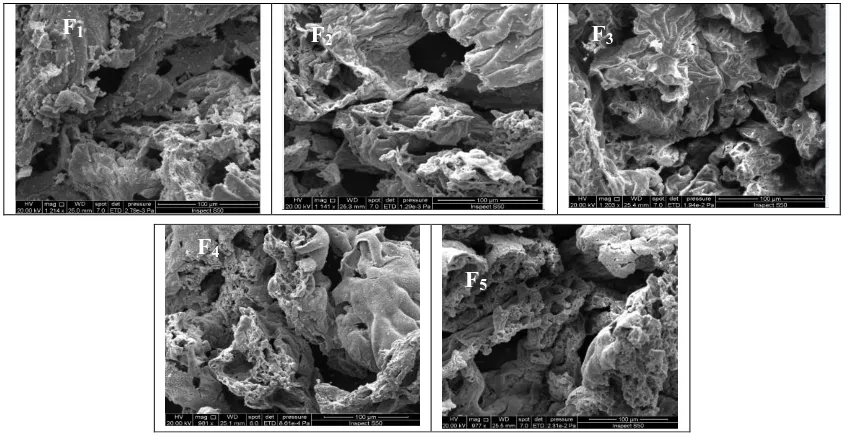
SEM characterization was used to identify the topography nature of AlxCu0.15 Zn0.85-x Fe2O4
nanoferrites. The two-dimensional surface morphological images are shown in Figure (3).
Figures (3) F1-F5 reveal the SEM images of AlyCu0.15Zn0.85-yFe2O4 nanoferrites, which show
highly agglomerated AlyCu0.15Zn0.85-yFe2O4 nanoferrites, which may be due to the magnetic
[image:4.596.87.512.497.715.2]interactions between the particles of ferrites and the limited magnification power of this device [16] or to the magnetic exchange interaction between the nanoparticles[17].
Figure 3. SEM images ofAlyCu0.15Zn0.85-yFe2O4nanoferrites for different Al contents.
F1 F2 F3
F4
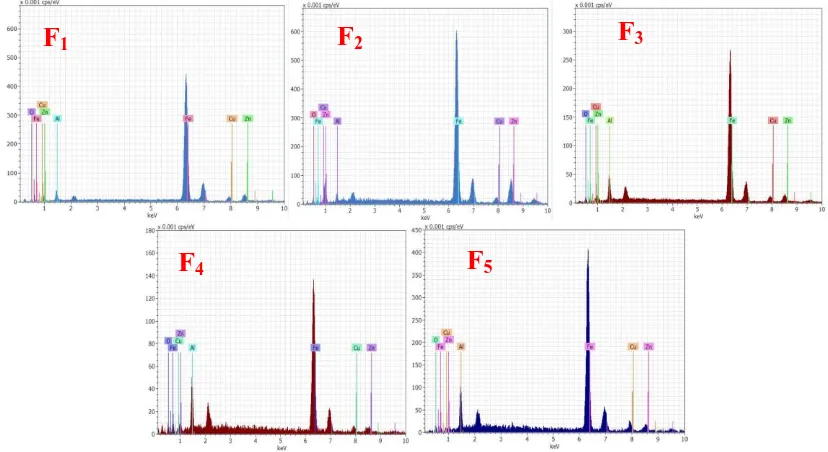
3.3. The EDX Results
The samples prepared by replacing the Cu ion with Al were studied using EDX. The observed peaks reveal the presence of Fe, Al, Cu and O, confirming the formation of the analyzed sample. EDX spectra (Figure 5) for the AlyCu0.15Zn0.85-yFe2O4samples proved the existence of Fe, Al, Cu, Zn and O,
[image:5.596.90.504.229.455.2]and that an auto combustion method is very effective because there is no loss in the elements during the synthesis [18].
Figure 4. EDX spectra of F1, F2, F3, F4 and F5 samples.
3.4. The Dielectric Properties
1 2 3 4 5 6 7
0 200000 400000 600000 800000 1000000
Dielectric
Const
ant
(
ɛ
′)
Frequency (Hz)
F1 F2 F3 F4 F5
F
1F
2F
3
Figure 5. Dielectric constant (ɛ′) as a function of the frequency for different contents of Al.
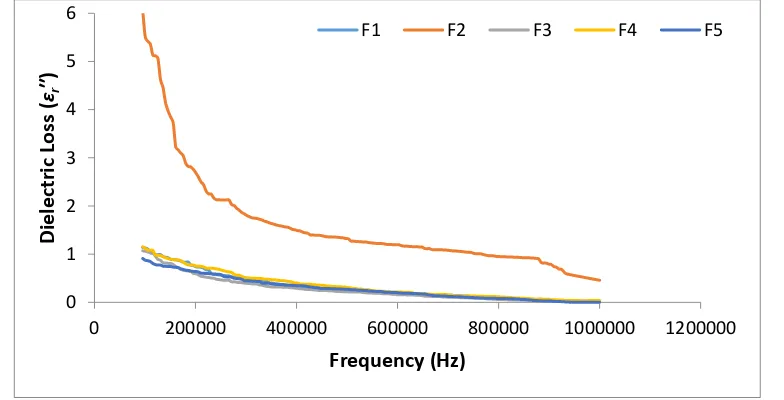
Figure 6. Dielectric loss factor (ɛ″) as a function of the frequency for different contents of Al.
Figures (5) and (6) reveal that when the frequency increased, the dielectric constant (ɛ) and dielectric loss (ɛ″) decreased. This behavior was observed for different contents of Al ion for all samples, which can be explained by Debby's type relaxation process [19]. Additionally, it can be interpreted by Wagner and Maxwell’s model and is compatible with the phenomenological theory of Koop [20].
The dielectric constant and the dielectric loss factor behavior are slightly affected by the Al content except for the sample of y=0.30. That behavior may be attributed to the formation of Fe2+ ions at the octahedral site. The dielectric loss factor shows the same behavior as the dielectric constant, and this might be attributed to the fact that Al ion substitution prefers to be at the octahedral site, which strengthens the dipole-dipole interaction restricting the rotation of the dipoles [21].
The variable conductivity (σa.c) of the prepared samples within the frequency range of (50 Hz-1
MHz) was measured at room temperature.
0 1 2 3 4 5 6
0 200000 400000 600000 800000 1000000 1200000
Dielectric
Lo
ss
(
ɛr
′′)
Frequency (Hz)
F1 F2 F3 F4 F5
0 5E-09 1E-08 1.5E-08 2E-08
0 200000 400000 600000 800000 1000000
AC
Cond
uc
tivity
(Ω.
cm)
-1)
Frequency (Hz)
Figure 7. Dependence of AC conductivity (σa.c) on the frequency for different contents of Al.
From Fig. 7, we can notice that the AC conductivity (σa.c) of AlyCu0.15Zn0.85-yFe2O4 ferrites
increased with the increase in the Al ratio of Al, especially at y = 0.30. On the other hand, the AC conductivity of all samples increased with the increase in the frequency. In the ferrites, the mechanism of conduction can be interpreted as electron hopping between Fe
2+
and Fe
3+
at the B site. The highest conductivity for the concentration of y=0.3 is perhaps related to the occurrence of a large number of Fe
2+
in the ferrites. It is expected that the presence of Fe
2+
is due to the partial reduction of Fe
3+
to Fe
2+
and the evaporation of Zn ions during the heat treatment [22,23].
4. CONCLUSIONS
AlyCu0.15Zn0.85-yFe2O4 nanoferrites with y= 0.15, 0.3, 0.45, 0.6 and 0.75 were synthesized by
the sol-gel method. The X-ray diffraction studies clearly confirmed that the crystalline structure of AlyCu0.15Zn0.85-yFe2O4 was cubic spinal structure with ferrite phase. The lattice parameter decreased
with increasing Al content. There was a clear increase in the dielectric loss factor and dielectric constant, especially at a concentration of y=0.3, but the behavior of AC conductivity was the opposite.
References
1. J. Azadmanjiri, Mater. Chem. Phys., 109(2008)109.
2. F. I .Hussain, R. A. Najem, Journal of Physics: Conf. Series, 1003 (2018) 012097.
3. R.S.Melo,F.C.Silva,K.R.M.Moura,A.S.de Menezes and F.S.M.Sinfrônio, J. Magn. Magn.. Mater., 381 (2015) 109.
4. Su M, Liao C, Chan T, Shih K, Xiao T, Chen D, Kong L, Song G., Environ Sci Technol., 52 (2018) 775.
5. S. Shabani ,S. M. Mirkazemi and S. M. Masoudpanah, J.Supc.Nov. Magn,, 27 (2014) 2795. 6. J. Zhang, Liming Yu, S. Yuan, S. Zhang and X. Zhao, J. Magn. Magn. Mater., 321 (2009) 3585. 7. G. Mahmoudzadeha , S. A. Khorramia, S. S. Madania and M. Frounchi, J. Ceram. Proc. Res., 13
(2012)368.
8. W.H. Lee, C.S. Hong and S.Y. Chang, Arch. Metall. Mater., 60 (2015) 1347.
9. P. Yadoji, R, Peelamedu, D. Agrawal and R. Roy, Mater. Sci. Eng. B, 98 (2003) 269.
10.N. M. Deraz, A. Alarifi, Int. J. Electrochem. Sci., 7 (2012) 6501.
11.Ahmed R. Abdil Majeed, Ibn Al-Haitham, J. Pure & Appl. Sci. 27 (2014) 164.
12.M.S. Tomar, S.P. Singh, O.P. Perez, R.P. Guzman, E. Calderon and C.R. Ramos, Microelectron. J., 36 (2005) 475.
13.F. Shahbaz,V. Daadmehr,A.T. Rezakhani, R.H. Akbarnejad, S. Gholipour, J. Supercond. Nov. Magn.
25(2012 )2443.
14.B.D. Cullity, S.R. Stock, Elements of X-Ray Diffraction, ( 2001) 3nd ed., Prentice Hall, New York. 15.A.Manikandan,J.Judith Vijaya,L.John Kennedy and M.Bououdina, J. Mol. Struct., 1035 (2013)
16.A. Loganathan and K. Kumar , Appl. Nanosci., 6 (2016) 629.
17.G. Aravind, D. Ravinder, and V. Nathanial, Phys. Res. Int., ( 2014 )11.
18.A.ManikandanJ.Judith Vijaya,L.John Kennedy and M.Bououdina, Ceram.Int., 39 (2013) 5909. 19.R. S. Devan, Y .D. Kolekar and B. K. Coagula, J. Phys.: Condens. Matter., 18 (2006) 9809.
20.J.Balavijayalakshmia, N.Suriyanarayananb, R.Jayaprakashc, V.Gopalakrishnanc, Physics Procedia , 49 (2013 ) 49 .
21.Anshu Sharma1, Kusum Parmar1, R.K. Kotnala and N.S. Negi ,Int. J. Adv. Eng.T ech., 5(2012)544.
22.P.K.Roy and J.Bera., J. Magn. Magn. Mater. ,298 (2006) 38.
23.Mukhlis M. Ismail and Nasma A. Jaber , Iraqi J. Phys. 16(2018) 140.