promoting access to White Rose research papers
White Rose Research Online
Universities of Leeds, Sheffield and York
http://eprints.whiterose.ac.uk/
This is supplementary material to the author’s post-print version of an article published in Philosophical Transactions of the Royal Society B: Biological Sciences
White Rose Research Online URL for this paper:
http://eprints.whiterose.ac.uk/id/eprint/76086
Published article:
Woodward, G, Brown, LE, Edwards, FK, Milner, AM, Ledger, ME, Hudson, LN and Reuman, DC (2012)Climate change impacts in multispecies systems: Drought alters food web size structure in a field experiment. Philosophical Transactions of the Royal Society B: Biological Sciences, 367 (1605). 2990 -2997. ISSN 0962-8436
Supplementary Figure S2. Trivariate food webs, for monthly drought [d1-d4] versus permanent flow [c1-c4] treatments. Each node is plotted as a function of its body mass (log10(M)) and abundance (log10(N)). The polygonal convex hulls fitted to each web bound all interactions,
excluding detritivorous feeding (note: detrital resources do not have a clearly defined individual mass and have therefore been placed in the bottom left hand corner of each web for illustrative purposes only).
0 2 4 6 8 1 0 1 2
60.92
c1
54.52
c2
59.14
c3
66.36
c4
15 10 5 0
0 2 4 6 8 1 0 1 2
38.1
d1
15 10 5 0
47.09
d2
15 10 5 0
43.26
d3
15 10 5 0
43.93
d4
log10 M mg
Supplementary Figure S3. Upper angleAupperversus lower angleAlowerof all 2-chains within each food web. Vertical and horizontal solid lines represent median lower and upper angles for all 2-chains (see Methods for details).
1 5 0 5 0 5 0 1 5 0
c1
c2
c3
c4
150 50 50 150
1 5 0 5 0 5 0 1 5 0
d1
150 50 50 150
d2
150 50 50 150
d3
150 50 50 150
Supplementary Figure S4. Network substructure in control (c1-c4) and drought (d1-d4) treatments: two span as a function of upper angleAbetween
within each food web (see Methods).
0 5 1 0 1 5 2 0 2 5 3 0
c1
c2
c3
c4
150 50 50 150
0 5 1 0 1 5 2 0 2 5 3 0
d1
150 50 50 150
d2
150 50 50 150
d3
150 50 50 150
Supplementary Table S1. Parameters and test statistics from logistic regressions performed on the likelihood of species being lost from the food
web on the basis of their body size (log10M) and rarity-at-size (residual; see Methods for details). Significance codes: ‘***’ 0.001 ‘**’ 0.01 ‘*’
0.05.
Estimate S.E. z-value P(>|z|)
Intercept 0.083 0.187 0.443 0.658
Log10M -0.22 0.036 -6.063 1.34e-09 ***
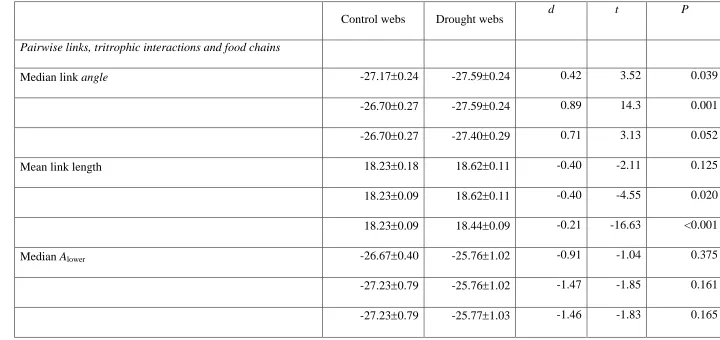
Table S1. MeanSE community structure measures for the control (c1-c4) and drought (d1-d4) treatments for (top rows per parameter)
connected species within the food web. See Methods for details. Pairedt-tests were performed to test for significance of mean differences (d)
from zero. Results for additional scenarios (mid and lower rows per parameter) testing for indirect effects (see Methods) are given in Table S1.
Control webs Drought webs d t P
Pairwise links, tritrophic interactions and food chains
Median linkangle -27.170.24 -27.590.24 0.42 3.52 0.039
-26.700.27 -27.590.24 0.89 14.3 0.001
-26.700.27 -27.400.29 0.71 3.13 0.052
Mean link length 18.230.18 18.620.11 -0.40 -2.11 0.125
18.230.09 18.620.11 -0.40 -4.55 0.020
18.230.09 18.440.09 -0.21 -16.63 <0.001
MedianAlower -26.670.40 -25.761.02 -0.91 -1.04 0.375
-27.230.79 -25.761.02 -1.47 -1.85 0.161
MedianAupper -31.801.09 -142.309.67 110.5 10.46 0.002
-106.224.4 -142.309.70 36.1 2.01 0.138
-106.224.4 -142.309.70 36.1 2.01 0.138
Log10number of tritrophic chains 2.050.20 1.290.01 0.77 4.05 0.027
1.370.24 1.290.01 0.08 0.37 0.733
1.370.24 1.280.02 0.09 0.41 0.710
MedianAbetween -8.993.93 -116.539.78 107.5 13.40 0.001
-77.724.50 -116.509.80 38.9 2.22 0.113
-77.724.50 -116.509.80 38.8 2.22 0.114
Mean 2-span 19.20.19 18.050.11 1.11 6.21 0.008
18.640.37 18.050.11 0.59 1.73 0.182
18.640.37 18.050.11 0.59 1.75 0.178
18.640.38 18.050.11 0.59 1.75 0.178
Mean food chain link count 1.490.17 1.090.01 0.39 2.32 0.103
1.180.07 1.100.01 0.08 1.15 0.334
1.180.07 1.120.01 0.06 0.93 0.423
Trophic level of apex predator (chain length) 2.530.05 2.160.04 0.37 7.64 0.005
2.260.04 2.160.04 0.10 2.73 0.072
2.260.04 2.160.04 0.10 2.73 0.072
Community scaling and whole-network properties
Allometric slope -0.500.006 -0.520.002 0.017 3.71 0.034
-0.49008 -0.520.002 0.025 4.04 0.027
-0.49008 -0.520.004 0.022 4.65 0.019
Community span 28.10.17 27.70.08 0.33 1.94 0.148
27.40.33 27.70.08 -0.30 -0.83 0.467
51.202.85 43.101.86 8.10 2.84 0.065
51.202.85 41.522.13 9.67 2.70 0.074
S, the number of connected food web nodes 601.3 46.51.3 13.5 11.34 0.001
431.8 46.51.3 -3.75 -5.00 0.015
431.8 431.8 n/a n/a n/a
log10L, number of links 2.480.05 2.310.04 0.17 3.20 0.050
2.240.07 2.310.04 -0.07 -1.51 0.229
2.240.07 2.230.05 0.007 0.12 0.914
C, directed connectance 0.080.008 0.090.008 -0.01 -0.87 0.448
0.100.01 0.090.008 0.002 0.17 0.876
0.100.01 0.090.01 0.001 0.06 0.956
Proportion of top species 0.420.03 0.370.02 0.045 0.99 0.396
0.330.03 0.370.02 0.041 -1.96 0.145
0.040.02 0.020.01 0.02 1.47 0.237
0.040.02 0.020.001 0.02 1.37 0.264
Proportion of basal species 0.480.008 0.610.02 -0.12 -4.50 0.020
0.610.02 0.610.02 0.001 0.17 0.877
Table S3. List of trophic elements in stream channel food webs. Numerical node identifiers
(e.g. Fig. 2) are given in parentheses.
Basal resources
[1] Amorphous detritus (FPOM)
[2] Plant fragments (CPOM)
[3] Fungal spores
[4] Fungal mycelia
Primary producers
[5]Psammothidium lauenburgianum(Hustedt) Bukhtiyarova & Round
[6]Planothidium lanceolatum(Bréb. ex Kützing) Round & Bukhtiyarova
[7] Algal cysts
[8]Amphora ovalis(Kützing) Kützing
[9]Amphora pediculus(Kützing) Grunow in Schmidt
[10]Chrococcus minor(Kützing) Nägeli
[11]Cymbella lanceolata(Ehrenberg) Kirchner
[12]Encyonema minutum(Hilse in Rabenhorst) Mann
[13]Cocconeis placentulaEhrenberg
[14]Cymatopleura solea(Brébisson & Godey) W. Smith
[15]Diatoma vulgareBory
[16]Staurosira elliptica(Schumann) Williams & Round
[17]Staurosirella leptostauron(Ehrenberg) Williams & Round
[21]Gyrosigmasp.
[22]Melosira variansAgardh
[23]Nitzschia dissipata(Kützing) Grunow
[24]Navicula gregariaDonkin
[25]Navicula lanceolata(Agardh) Ehrenberg
[26]Navicula menisculusSchumann
[27]Nitzschia perminuta(Grunow) M. Peragallo
[28]Navicula tripunctata(O.F. Müller) Bory
[29]Rhoicosphenia abbreviateAgardh) Lange-Bertalot
[30]Surirella minutaBrébisson in Kützing
[31]Spirulinasp.
[32]Surirella brebissoniiKrammer & Lange-Bertalot
[33]Synedra ulna(Nitzsch) Ehrenberg
Consumers
[34]Asellus aquaticus(L.)
[35]Eiseniella tetraedra
[36]Elmis aenea(Müller)
[37]Ephemera danicaMüller
[38]Gammarus pulex(L.)
[39]Heterotrissocladiussp.
[40]Leuctra geniculata
[41]Limnius volckmari(Panzer)
[42] Naididae
[43] Ostracoda
[44]Oulimnius tuberculatus(Müller)
[47]Prodiamesa olivacea
[48]Sericostoma personatum(Spence)
[49] Simuliidae
[50]Tipula montiumEgger
[51] Tubificidae
[52]Ancylus fluviatilis(Müller)
[53]Athripsodesspp.
[54] Baetidae
[55]Brachycentrus subnubilusCurtis
[56]Brychius elevatus(Panzer)
[57]Cricotopussp.
[58]Cryptochironomussp.
[59]Radix balthica(L.)
[60]Microtendipessp.
[61]Potamopyrgus antipodarum(J.E.Gray)
[62]Procladiussp.
[63]Synorthocladiusap.
[64]Theodoxus fluviatilis(L.)
[65]Tinodes waeneri(L.)
[66]Valvata piscinalis(Müller)
[67]Erpobdella octoculata(L.)
[68]Haliplus lineatocollis(Marsham)
[69]Hydropsyche spp.
[70]Macropelopiasp.