This is a repository copy of National evaluation of the handyperson programme.
White Rose Research Online URL for this paper:
http://eprints.whiterose.ac.uk/76277/
Version: Published Version
Monograph:
Croucher, K orcid.org/0000-0001-9665-3564, Lowson, Karin and Fountain, Mark (2012)
National evaluation of the handyperson programme. Research Report. Department for
Communities and Local Government , London.
[email protected] https://eprints.whiterose.ac.uk/
Reuse
Items deposited in White Rose Research Online are protected by copyright, with all rights reserved unless indicated otherwise. They may be downloaded and/or printed for private study, or other acts as permitted by national copyright laws. The publisher or other rights holders may allow further reproduction and re-use of the full text version. This is indicated by the licence information on the White Rose Research Online record for the item.
Takedown
If you consider content in White Rose Research Online to be in breach of UK law, please notify us by
National Evaluation of the Handyperson
Programme
Karen Croucher, Research Fellow, CHP
Karin Lowson, Senior Associate, YHEC
Michael Fountain, QA Research
The University of York
The findings and recommendations in this report are those of the
authors and do not necessarily represent those of the Department
for Communities and Local Government.
© Queen’s Printer and Controller of Her Majesty’s Stationery Office, 2012
Copyright in the typographical arrangement rests with the Crown.
You may re-use this information (not including logos) free of charge in any format or medium, under the terms of the Open Government Licence. To view this licence, visit
http://www.nationalarchives.gov.uk/doc/open-government-licence/ or write to the Information Policy Team, The National Archives, Kew, London TW9 4DU, or e-mail:
This document/publication is also available on our website at www.communities.gov.uk
Any enquiries regarding this document/publication should be sent to us at:
Department for Communities and Local Government Eland House
Bressenden Place London
SW1E 5DU
Telephone: 030 3444 0000
January 2012
Acknowledgements
Many people and many organisations have contributed to this evaluation.
We would like to thank all the local authorities, service providers, and service users who responded to the surveys undertaken during the course of the evaluation.
We are particularly grateful to the following organisations for their time and support in undertaking the case studies, and assisting with the service user surveys:
Anchor Staying Put Agency Kirklees (now Mears Home Improvement Ltd) Age UK Milton Keynes
Care and Repair Leeds
County Durham Handyperson Service East Boro Housing Trust
East Sussex County Council Helping Hands (Salford) Hyde Housing
Hyde in Touch
Knowsley Care and Repair
Middlesbrough Staying Put Agency North Somerset Care and Repair
Origin Housing Home Improvement Services Plymouth Care and Repair
Rochdale Improvement Agency Thanet Home Improvement Agency Tendring Home Improvement Agency Vale and Dale Home Improvement Agency Wirral Home Improvement Agency
We would also like to thank the members of the project advisory group:
Sue Adams, Care and Repair England Katie Aston, Home Office
Lisa Dale, Foundations
Domini Gunn-Peim, ConsultCIH
Mathew Hibbard, Local Government Association Victoria Mager, Anchor
Alyson Morley, Local Government Association
Jeremy Porteus, Housing Learning and Improvement Network Ed Price, Department for Work and Pensions
Moira Telford, Anchor Lisa Waite, Age UK
Keith Williams, Regional Handyperson Coordinator Sarah Best, Regional Handyperson Coordinator
We would like to acknowledge the contribution of the research team at Qa Research. We are grateful to Robin Hulme and Michael Fountain at Qa Research for the coordination and administration of the telephone survey with service users, and the construction of a survey guide for service providers. Qa Research is a social and health care market research company. More information can be found at www.qaresearch.co.uk.
Contents
Acknowledgements ... iii
Executive Summary... 1
Section 1: Introduction and Context ... 7
1.1 Background ... 7
1.2 The Role of Handyperson Services ... 8
1.3 Purpose of the Evaluation ... 9
1.4 Structure of the Report ... 10
Section 2: Making the Case for Handyperson Services ... 11
2.1 Introduction... 11
2.2 Costs and Benefits of Handyperson Services ... 12
2.3 Supporting Independence and Choice in Later Life: The Added Value of Handyperson Services... 13
2.4 Promoting the Service and Influencing Local Partners... 15
Section 3: How the DCLG Part A Handyperson Funding was used ... 16
3.1 Introduction... 16
3.2 Spend on Handyperson Services ... 17
3.3 Handyperson Activities and Use of Funds... 17
3.4 Clients... 20
3.5 Handyperson Activities ... 22
3.6 Costs and Benefits of Handyperson Services ... 24
Section 4: Meeting the Needs of Service Users ... 30
4.1 Introduction... 30
4.2 Profile of Service User Survey Respondents and Interviewees ... 31
4.3 Finding out about Handyperson Services... 33
4.4 What Do Service Users Value? ... 35
4.5 Differences Made to the Service User ... 39
4.6 Other Alternatives ... 41
Section 5: Delivery and Sustainability of Handyperson Services ... 43
5.1 Introduction... 43
5.2 Picking up Mainstream Funding ... 43
5.3 Adapting Service Provider Business Models ... 46
5.4 Charging for Services ... 48
5.5 Models of Service Delivery ... 50
5.7 A Service or a Grant? ... 53
Section 6: Innovation... 56
6.1 Introduction... 56
6.2 Responding to Local Needs ... 58
6.3 Addressing Gaps in Service Provision ... 60
6.4 Strategic Fit with Other Local Services... 61
6.5 Broader Lessons ... 62
List of Tables Table 3.1 Average spend on handyperson services by local authorities ... 17
Table 3.2: Number of clients visited... 20
Table 3.3: Average cost per client ... 24
Table 3.4: Average number of clients by handyperson activity recalculated for Handypersons Financial Benefit Toolkit... 26
Table 3.5: Financial benefits achieved... 27
Table 3.6: Financial benefit equation ... 27
Table 3.7: Budgets to which benefits accrue ... 28
[image:8.595.76.541.81.368.2]List of Figures
Figure 3.1: Targeting of DCLG Part A funds by local authorities... 18
Figure 3.2: Breakdown of total spend for Part A funds... 19
Figure 3.3 Categories of additional staff employed... 20
Figure 3.4: Client groups to which handyperson programme funding was directed... 21
Figure 3.5: Sources of referrals... 22
Figure 3.6: Percentage of providers by handyperson activities... 23
Figure 3.7: Percentage of service users receiving different types of handyperson activity... 23
Figure 4.1: Health profile of service user survey respondents... 31
Figure 4.2: Housing tenure of service user survey respondents... 32
Figure 4.3: Type of property occupied by service user survey respondents... 32
Figure 4.4: Age of properties occupied by service user survey respondents... 33
Figure 4.5: How service users found out about handyperson services... 34
Figure 4.6: Levels of satisfaction with different aspects of handyperson services... 35
Figure 4.7: Type of work carried out for service user survey respondents... 38
Figure 4.8: Difference made by the work carried out by handyperson service... 40
Executive Summary
Overview
This evaluation of the DCLG Handyperson Programme has shown that handyperson services are assisting large numbers of older, disabled and vulnerable people to live independently in their own homes for longer in greater levels of comfort and security. They offer an important safety net for older people, and they also enhance the effectiveness of health and social care provision through the delivery of often very simple and very low cost interventions. Services are consistently highly rated by people who use them, and they are valued for their trustworthiness, reliability, quality, and crucially for the skills and respectful attitudes of the staff. As the population ages there will be greater demand for such services, and a greater imperative to assist older people to live independently. Handyperson services can and do support the preventive agenda. This evaluation has demonstrated that
handyperson services provide value for money, and while this is the overriding message, the “value-added” aspects of services can only strengthen the case for supporting these
services. Small things do matter, and can make an enormous difference.
Background
Evidence consistently shows that older people place great value on services that offer them “that little bit of help” and enable them to remain living independently in their own homes. Handyperson services are perhaps one of the best examples of “that little bit of help”,
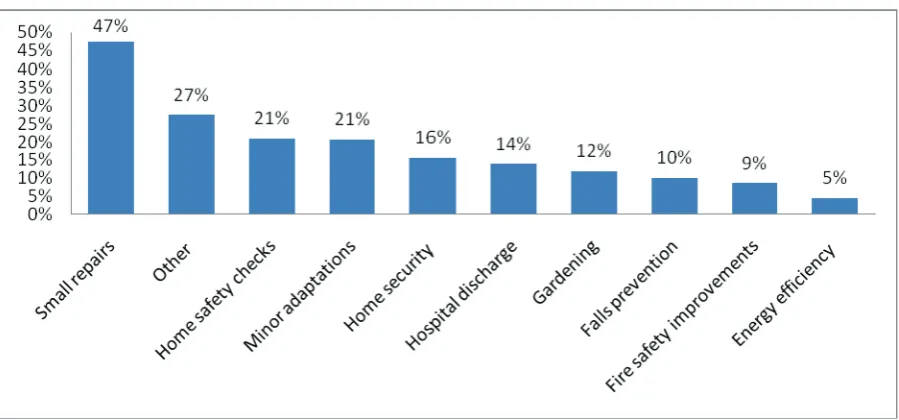
assisting older, disabled and vulnerable people with small building repairs, minor adaptations such as the installation of grab rails and temporary ramps, ‘odd’ jobs (such as putting up shelves, moving furniture), falls and accident prevention checks, and home safety and energy efficiency checks. (See Figure below).
Percentage of service users receiving different types of handyperson activity
Handyperson services are sometimes part of the wider package of services provided by Home Improvement Agencies, often located in local authorities, sometimes by housing associations under contract to a local authority, and sometimes by third sector organisations. Crucially handyperson services can signpost older people to additional sources of help and support.
Handyperson services were first set up in the UK by the charitable sector in the early 1980s with the aim of improving the quality of older people’s lives by improving their housing conditions. There is a range of funding sources for handyperson service including Supporting People1
, adult social care and health services. Despite the growth of
handypersons services since the 1980s, provision remained patchy, with older people in some local areas unable to access services, and services in other areas unable to provide a comprehensive service. In 2009 the Department for Communities and Local Government (DCLG) introduced additional funding for handyperson services to enable local authorities to develop new services or expand existing services. Alongside this programme, nineteen enhanced pilot projects were also funded to test new and innovative service developments.
Researchers from the University of York have evaluated this programme of funding. The evaluation adopted a number of different methods including: a literature review; surveys of local authorities, service providers, and service users; and case studies focusing on a number of different services. A summary of the findings of the evaluation is presented below.
Cost and Benefits of Handyperson Services
Using data collated from service providers during the course of the evaluation, and the Handypersons Financial Benefits Toolkit, it can be demonstrated that handyperson services can be cost beneficial.2 Based on conservative modelling assumptions, the benefits
achieved by the handyperson programme outweighed the costs of providing the programme by 13 per cent3. Investment in handyperson services leads to avoided costs elsewhere. In
particular the biggest costs that can be avoided are with social services. Financial benefits of handyperson services could be significantly greater than this as the scope of this modelling has been limited to benefits for which a financial value can be attributed. Benefits such as improving older people’s independence, quality of life and sense of wellbeing can also be achieved, but are not quantified in the model.
Key areas of work where the low cost preventive interventions provided by handyperson services offer the potential to reduce demand for health and social care services include:
• Small repairs and minor adaptations that reduce the risk of falls and enable independent living;
1
Supporting People rolled into Formula Grant with effect from April 2011.
2
The Handyperson Financial Benefits Toolkit has been designed to allow handyperson services to estimate the social benefits that services deliver and assists with the development of business cases. See:
http://www.communities.gov.uk/publications/housing/financialbenefitstoolkit
3
• Home security measures that prevent burglaries and increase people’s sense of security in their own homes;
• Hospital discharge schemes where a swift response to requests for the installation of key safes, grab rails, temporary ramps, or moving a bed or other furniture can reduce the length of hospital stay;
• Energy efficiency checks and measures which lead to improvements in health and wellbeing, safety, comfort and expenditure on fuel.
Such preventive services are cost effective, for example:
• Postponing entry into residential care by a year saves on average £28,080 per person4.
• Preventing a fall leading to a hip fracture saves the state £28,665 on average5.
• Housing adaptations reduce the costs of home care (saving £1,200 to £29,000 a year)6.
• Hospital discharge services speed up patient release, saving at least £120 a day7.
The average cost per client in 2010/11 was £67 for service providers who were able to identify the impact of DCLG funding (and the average number of jobs undertaken for
individual clients was 1.5). These average costs are comparable with costs reported in other studies of handyperson services.8
In summary handyperson services deliver a relatively high volume of preventive activity at a relatively low cost. A full discussion of the costs and benefits of the handyperson
programme is presented in Section 3 of the main report.
Supporting Independence
The evaluation also showed that handyperson services support older people to live
independently. Both the service user survey and interviews with service users undertaken as part of this evaluation showed that people who use handyperson services are usually older people, with health problems or disabilities, living alone, on low or modest incomes in older properties. Many had few other sources of informal or formal assistance. The survey and interviews also showed very high levels of satisfaction with handyperson services. When asked to rate their levels of satisfaction with services received, 97 per cent of survey respondents gave a score between 7 and 10 (where 10 is “completely satisfied”); and 74 per cent of respondents gave a score of 10. This satisfaction is generated by a number of
different aspects of the services. Service users value the wide range of small tasks that services undertake, and feel it would be difficult to find “ordinary” tradesmen who would be prepared to undertake such work. The affordability of services is also important to service
4
Lang and Buisson (2008), Annual Cost of Care Home Report
5
Ibid
6 Ibid 7
Personal Social Sciences Research Unit for Department of Health (2010), National evaluation of POPPs
8
users. However many are, or would be, happy to contribute something towards service costs. People also valued the very practical support which enhanced their sense of security, comfort, choice, and control in their own homes. When survey respondents were asked what difference handyperson services had made to them, responses showed that:
• 72 per cent of service users felt that their home was a more secure environment;
• 69 per cent of service users felt they were better able to maintain their independence;
• 65 per cent of service users felt they were able to do more in the home.
Unsurprisingly responses to these questions were strongly linked to the work that was undertaken. Those respondents who had spy holes, chains, locks, etc installed were significantly more likely to feel their home was a more secure environment as a result of the service (83 per cent); those with falls equipment installed or who had their appliances checked were more likely to feel their home had become a safer environment (93 per cent and 100 per cent respectively).
Knowing the service was trustworthy and reliable - that the handypersons were “checked”, that they would do a good job, that they would not over-charge or suggest work that was unnecessary - were among the most crucial and valued aspects of the service. The comment below, taken from an interview with a service user, neatly sums up what many service users told us:
“It’s the fact that there’s somebody, you know it’s safe. You don’t know where to go when you’re on your own to get people to do these little jobs for you that you can trust, just having the handyman to do the odd jobs, you know, it’s a life saver.” (Service user, CS5/2)
Serving the Preventive Agenda
Interviews with commissioners and service providers highlighted the preventive nature of handyperson services. Much of the work undertaken by handyperson services is related to reducing risks and hazards and improving people’s safety and well-being in their homes. Typically a full time handyperson can make up to 1,200 visits in a year offering the potential for an informal “check” on large numbers of older people living alone, many of whom might be reluctant to contact other organisations such as social services, or indeed not know what help is available to them. A visit from a handyperson to undertake a small job is often the first step in identifying potential risks and hazards in people’s homes (which may be easily remedied by the handyperson), as well as a range of previously unrecognised and unmet needs. Such needs may go beyond what handyperson services can in themselves provide, but handyperson services can then direct to other sources of help and assistance. This observation by one of the handypersons interviewed sums up the preventive role of handyperson services very well:
people can cope. If we see a trip hazard, we can sort it out while we’re there, or book it in. We tend to gel with the other services. We’re like a filter system. There’s loads of things that people don’t know about that we can fill them in on. And we can get in touch straight away with other services. Referrals via other routes seem to take longer. If we refer something it tends to get acted on.” (Handyperson, CS8/S/2)
What Makes a Service Successful?
The interviews undertaken with service providers as part of the evaluation highlighted the person-centred focus of handyperson services as being key to their success. The attitudes and skills of frontline staff not just in undertaking the handyperson tasks but also in working with older (and often isolated people) were essential for a service to be successful.
“Our team is key to it - we have a dedicated team who are local, who are professional, who have their hearts in the right place, and who see this as not just a job, but they buy into the idea of helping the elderly and vulnerable people, and that’s the key to our success really. And obviously keeping them up to date with the latest trends, and keeping them fully resourced, helps keep their morale up and in turn they deliver a good service.” (Service Manager, CS10/S/2)
Collating and using feedback from service users is also key to success. Service user surveys can demonstrate that the service is reaching target groups, how service users rate different aspects of the service, and the differences services have made. Individual case studies are also powerful ways of illustrating how less quantifiable aspects of services are valued by service users and the potential differences services can make to individuals. Such qualitative data is essential to inform service development and improvement, and also for making the case to funding bodies. The need for services to connect with local decision makers, as well as partner organisations and professional groups who can effectively lobby on behalf of services was also highlighted. Learning from the handyperson projects, that explored new and innovative ways of developing services, shows that handyperson services can build on local knowledge and strategic links to take services forward in distinctive ways that meet local needs, further support and enhance health and social care services, and serve local strategic objectives.
Making the Case for Handyperson Services
community organisations that can lobby for and support handyperson services.
Section 1:
Introduction and Context
1.1 BACKGROUND
Handyperson services were first set up in the UK by the charitable sector in the early 1980s with the aim of improving the quality of older people’s lives by improving their housing
conditions. Handyperson services have grown over the last 30 years. They may be provided by Home Improvement Agencies, housing associations and third sector organisations. Services typically offer help with small jobs and minor repairs in the home (see below).
Funding can come from a range of sources, including Supporting People9, social care, health,
police and fire services. Evidence from a number of studies (including the Older People’s Inquiry undertaken by the Joseph Rowntree Foundation10) consistently highlights the value placed by older people on such services that offer that “little bit of help”, and enable them to remain living independently in their own homes. According to Care & Repair England:
“Older people place a high value on small scale assistance such as handyperson services and consider that such help is critical to retaining independence and quality of life”.11
Most recently Baroness Barker, at an All Party Parliamentary Group (Housing and Care for Older People) Inquiry made the comment:
“Handyperson services are the gods of the older persons’ world.”12
Despite the growth of handypersons services since the 1980s, provision remained patchy, with older people in some local areas unable to access services, and services in other areas
unable to provide a comprehensive service. In response to this, the Department for Communities and Local Government (DCLG) introduced funding in 2009 for all local
authorities in England, to develop handypersons services where they did not exist, and to build capacity in existing services. Funding of £33m was announced as part of the
then-Government’s national strategy for housing in an ageing society.13 The major part of this funding (known as “Part A” funding) comprised allocations of around £12m in 2009/10 and £17.5m in 2010/11 to enable local authorities to expand and further develop existing handyperson services or, where no such provision existed, to develop new schemes
(hereafter known as the “handyperson programme”). “Part B” funding comprised allocations of
9
Supporting People rolled into Formula Grant with effect from April 2011.
10
http://www.jrf.org.uk/publications/report-older-peoples-inquiry-bit-help.
11
Care & Repair England (2006) Small things matter: the key role of handyperson services. From www.careandrepair-england.org.uk/handyperson. P.4.
12
Baroness Barker, quoted in All Party Parliamentary Group on Housing and Care for Older People, “Living well at home” Inquiry Report (July 2011) p.18.
13
between £50-200k for innovative and enhanced housing-related support services for older people. Part B funding was awarded via a competitive bidding process to 19 local authorities (hereafter known as “enhanced pilots”). These enhanced pilots were all different, reflecting local needs, strategies, and thinking about how handyperson services could develop and expand in innovative ways. Enhanced pilots included the provision of housing advice services for older people, a de-cluttering project, garden clearance and additional security, additional training of handypersons to take on more focused roles within particular services or service user groups, as well as projects that focused on intelligence gathering to enable service to target localities or groups of service users most in need of services. In October 2010 the Coalition Government announced continued funding of £51m over 2011/15 for handypersons services14
), which has been made available through Formula Grant.
1.2 THE ROLE OF HANDYPERSON SERVICES
DCLG, Foundations15 and Care & Repair England16 all have a similar definition of what we mean by handyperson services, and what such a service should deliver.17 18 The overall intention is predominantly preventive, and handyperson services can and do play a key role in:
• Prevention of falls and accidents;
• Prevention of delayed discharges from hospital;
• Improvement of home security;
• Improvement of energy efficiency;
• Prevention of fire and detection of carbon monoxide.
To serve the prevention agenda, services typically should cover:
• Small building repairs;
• Minor adaptations (such as installation of grab rails or temporary ramps);
• “Odd” jobs (for example, putting up curtain rails and shelves, moving furniture);
• General home safety checks with remedial action (for example safety checking or repairing/replacing appliances);
• Falls/accident prevention checks with remedial action (for example, securing loose carpets or putting up grab rails);
• Security checks with remedial action (for example, checking and replacing window and door locks);
• Energy efficiency (for example installing low energy light bulbs, draft proofing);
• Signposting clients to other services.
14
“Housing Strategy for Older People” funding
15
Foundations is the national organisation for Home Improvement Agencies in England, for further information and resources see: http://www.foundations.uk.com/home
16
Care & Repair England is a charity established in 1986 to improve the housing conditions of older people. For further information and resources see: http://www.careandrepair-england.org.uk/mission.htm
17
DCLG and Foundations (2009). The Future Home Improvement Agency: handyperson services report. (February). From www.communities.gov.uk
18
1.3 PURPOSE OF THE EVALUATION
Alongside the handyperson funding programme, DCLG also commissioned an independent evaluation of the services and enhanced pilots. The evaluation was undertaken by a team comprising members of the Centre for Housing Policy (CHP) and the York Health Economics Consortium (YHEC) from the University of York.
The purpose of the study was to evaluate the two-year handyperson programme and enhanced pilots in terms of processes underlying the potential success of the programme, outcomes and satisfaction for service users, value-for-money and lessons for dissemination. There were five key objectives for the evaluation to:
• Measure the success of the handyperson programme and enhanced pilots in achieving their core objectives;
• Identify the value-for-money of the programme by exploring the costs of running the programme, how money was spent and the additional cost savings that can be generated from handyperson interventions;
• Identify whether service users’ needs have been met both in terms of individual outcomes achieved and client views about the impact of the service received on their lives for both the handyperson programme and enhanced pilots;
• Assemble robust evidence on the process issues associated with implementation and operation of handyperson programme and enhanced pilots;
• Identify lessons learned and promising practice developed by the enhanced pilots.
To address these objectives a number of different methods were used over the eighteen month period of the evaluation (January 2010 – June 2011). Following preliminary data gathering, surveys were sent electronically to local authorities and service providers who had received funding from the handyperson programme in May 2010 and February 2011. These two surveys were designed to collect information about how the funding had been used in 2009/10 and 2010/11. The first survey collected information on funds received and the use to which funding was put.19 Service provider surveys collected data on funds received and
spent, including client groups, activities, staff employed and changes to services.20 The
second survey of local authorities and providers focused mostly on sustainability and plans for services in the future.21
In addition, data was collated on the initial progress of the enhanced pilots via structured interviews with key informants for each of the pilots (usually the Supporting People lead or service manager). Fifteen case studies were undertaken focusing on eight provider organisations that had only received Part A funding, and seven that were enhanced pilot sites. The case studies that participated in the evaluation were a
19
Seventy six local authorities (out of 151 local authorities) responded to the first survey, a response rate of 50.3 per cent.
20
One hundred and eleven service providers responded to the first survey. The provider response rate to the survey is not known, as local authorities were asked to forward provider questionnaires to the provider organisations in receipt of Part A funds. All local authorities (151) received Part A funding but not all responded to the survey.
21
purposive sample, representative of a range of different organisations and service models. Semi-structured interviews were undertaken with key informants from the service providers (including service managers, case workers, and handypersons) and other stakeholders, for example, commissioners, and other service partners, and additional data collated (for example, in-house evaluations when available, reports on activity, information from clients). Finally a telephone survey of 173 service users was undertaken by market research
organisation (QA Research), supported by in-depth telephone interviews and face-to-face interviews with 26 service users. The evaluation team was supported by an Advisory Group made up of officials from across Government and representatives from the voluntary and community sector.
1.4 STRUCTURE OF THE REPORT
This report is mainly targeted at commissioners in local authorities and local health
economies and providers of handyperson services but is also intended to be accessible to a wider 'lay' audience, for example, members of Older People's Forums. The report is
primarily focused on knowledge, practice sharing, and key learning points. This report is also supported by a series of technical appendices, which cover the detail and methods of the evaluation, which will be available on the Centre for Housing Policy website22
.
The report comprises five further sections:
• Section 2 presents an overview of the value-for-money and “value-added” aspects of handyperson services;
• Section 3 examines what the Part A element of the DCLG Handyperson Programme funding achieved: including how the funds were spent, the clients who benefited and the costs and benefits achieved;
• Section 4 examines lessons learnt from service users, and what are the “value-added” aspects of handyperson services that are most important to users;
• Section 5 looks to the future, by examining what might be the role of handyperson services, how they could work, what are areas for development, what are the benefits to be achieved, and what new and innovative services can be developed. It also discusses the sustainability of services by examining options for business models, social enterprise, charging and funding;
• Section 6 presents the key learning points from the enhanced pilot projects.
22
Section 2:
Making the Case for Handyperson
Services
Key messages
• The case for handyperson services can be made on the basis of both value-for-money arguments, and “value-added” arguments;
• Handyperson services are predominantly serving older people, living alone in their own properties, with high levels of disability and impairments, often with limited financial resources, and few alternative sources of formal or informal support;
• Handyperson services are tailored to address local needs hence the diversity of service design;
• The Handypersons Financial Benefits Toolkit can be used to demonstrate that handyperson services can generate modest savings to health, social care, and to service users;
• Value-added arguments can be built around the following themes:
o Assisting older people to live independently in their own homes;
o Enabling choice and control;
o High levels of service user satisfaction.
• Feedback from service users is an essential means of making the case for
handyperson services, particularly around the value-added aspects of the services;
• The case for services needs to be made to commissioners and other community based groups and champions that can promote and advocate for services.
2.1 INTRODUCTION
The evaluation was intended to identify how the additional funding allocated for handyperson services by DCLG had been used, the differences it had made, and key lessons learned. Since the programme of funding was initiated and the evaluation commissioned (December 2009), the policy and financial context in which both central and local government operate is now very different.23
Despite the changing political landscape, key issues remain the same. There will be growing numbers of older people in the coming decades, many will be
homeowners, increasing numbers will live alone, and increasing numbers will be living with long term chronic health problems.
This evaluation has shown that handyperson services are assisting large numbers of older people to live independently in their own homes in greater levels of comfort and security. They offer an important safety net for older people, as well as enhancing the effectiveness of
23
health and social care provision through the provision of often very simple and very low cost interventions. Services are consistently highly rated by people who use them and they are valued for their trustworthiness, reliability, quality, and crucially the skills and respectful attitudes of the staff. As the population ages there will be greater demand for such services, and a greater imperative to assist older people to live independently. Handyperson services can, and do, support the preventive agenda. This evaluation has demonstrated that
handyperson services are value for money, and while this is the overriding message the “value-added” aspects of services can only add strength to the case for supporting these services. Small things do matter, and can make an enormous difference.
In this section of the report we reflect on how the case can best be made to support and develop handyperson services.
2.2 COSTS AND BENEFITS OF HANDYPERSON SERVICES
Using the data given by service providers in receipt of Part A funding (see Section 3) and the Handypersons Financial Benefits Toolkit,24 it can be demonstrated that the Part A element of the Handyperson Programme has generated modest cost benefits which accrue in the main to social care services, and health. The key areas of work where these savings can most easily be demonstrated include:
• Small repairs and minor adaptations that reduce the risk of falls and enable independent living;
• Home security measures that prevent burglaries and maintain independent living;
• Hospital discharge schemes (where they include hazard management and equipment installation) that reduce the risk of falls, maintain independent living and reduce length of hospital stays;
• Fire safety checks and installation of alarms and smoke detectors that reduce death and injury caused by fires;
• Energy efficiency checks that reduce excess winter deaths and expenditure on fuel, where a check leads to an intervention to improve heating or warmth in a home.
The evidence from the evaluation indicates that services are being targeted at such activities. As the comment from a service manager below demonstrates, while it may be difficult to attribute cash savings to a single preventive intervention with an individual service user, the numbers of clients seen by a typical handyperson service, and the relatively low cost of the interventions, should support the case for funding.
“The falls prevention service, we know what it costs if somebody falls and breaks their hip, if we prevent four people a year from doing that every year that will pay for the service, but we actually see 700 people, so you can’t prove it but you can indicate that’s probably very good value for money for them [commissioners] to be doing that.” Service ManagerCS1)
24
2.3 SUPPORTING INDEPENDENCE AND CHOICE IN LATER LIFE: THE ADDED VALUE OF HANDYPERSON SERVICES
In the current climate there is an imperative to demonstrate value-for-money. However, as noted by many of the commissioners and services providers that were interviewed as part of the case studies, handyperson services offer more than value for money, and there are many “added value” aspects to handyperson services that are difficult to quantify or measure in monetary terms.25
A particular strength of handyperson services is their capacity to support key policy objectives around assisting older people to live independently in their own homes (see for example, The Coalition: Our Programme for Government)26. Evidence from the service user survey, the surveys of providers, and the case studies demonstrates that handyperson services are serving predominantly older people, living alone in their own properties, with high levels of disability and impairment, often with few alternative sources of informal or formal support, and with limited financial resources. Service users reported greater feelings of comfort and safety in the home environment and greater capacity to carry out activities of daily living.
Services are highly rated, trusted, and valued by older people. The service user survey and interviews with service users demonstrate very high levels of satisfaction with handyperson services (see Section 4). From the perspective of service users, perhaps the most important value of handyperson services was their trustworthiness. This trustworthiness in
combination with “quality” aspects of handyperson services - the reliability of the service, quality of the work carried out, respectful attitude of the staff and the range of jobs that can be undertaken - all underpin these high levels of satisfaction. This evidence is consistently substantiated by customer satisfaction surveys carried out by individual service providers as well as other studies. As many of the case study interviews with providers and
commissioners highlighted, these high levels of satisfaction reflect the client centred and customer focused nature of handyperson services. This ethos serves long standing health and social care policy directives around providing more choice and control to service users.
The service user survey and interviews with service users demonstrated the wide range of different tasks that handyperson services undertake, reflecting the particular needs and preferences of service users. Some of these tasks might not generate savings to other services in the way that more targeted programmes (i.e. hospital discharge or falls
prevention programmes) might; however these small services are of significant importance to service users. Examples from interviews with service users and case studies include such tasks as fitting window blinds, putting up shelves, mirrors, pictures, constructing flat
25
Note that the Handypersons Financial Benefits Toolkit highlights a range of benefits generated by handyperson services, however there is currently only robust evidence that demonstrates the potential for costs savings for a limited range of interventions, notably falls prevention, hospital discharge, security and fire prevention, and energy efficiency.
26
HMSO 2010; See
pack furniture, and small repairs to the fabric of a property. They enable service users to enjoy a degree of choice and control over their home environment which they might otherwise not have.
In line with the comments and discussion with service users reported in Section 4, those working in handyperson services were very clear about the “value-added” aspects of the service for service users: trustworthiness, reliability, affordability, knowing there was a service that could offer help with small tasks that could generate considerable anxiety if left, and also a service that could offer help with directing to other services that could help with other problems.
“It’s having someone they can trust, and somewhere reliable to go to…they know they can come to us, everybody is CRB checked.. and if they have a problem, they can come to us and it will be addressed, they’re coming to an organisation rather than an one-man-band” (Service Manager, CS9/S/2)
“When somebody hasn’t been able to leave the house because of that big high step, or because they can’t lift their leg up that high anymore, it’s actually quite nice to see them get out of the house because you’ve put them in a step. It’s nice to think you’re making a difference however small or big it may be.” (Handyperson, CS10/S/1)
“You know what it’s like today, times are hard, especially with the old people, they cannot afford to pay out silly money, they’ve just got a state pension and when you go and do something for them, they’re over the moon…”
(Handyperson, CS9/S/1)
“It’s that little job, that you or I as an able bodied person – you know – wouldn’t think twice to do, somebody with a disability, limited mobility, just getting that little bit older, there’s more dangers there, it’s such a big thing to them, and it plays on their mind, and a small job can alleviate so much stress and anxiety for
somebody..” (Senior case worker, CS7/S/2)
“People think they [Social Services] are going to put them in a home. Or if they tell social services about their benefits, they might get them stopped. We are not seen in that light. One thing that helps is we don’t go in suits. We are not suits.” (Handyperson, CS8/S/1).
Similarly some of the service users who were interviewed remarked that they would contact the service for information about where to go for assistance with a range of issues. The value of being perceived as a trusted first point of contact should not be overlooked.
2.4 PROMOTING THE SERVICE AND INFLUENCING LOCAL PARTNERS
The case for continuing to support handyperson services will need to be made to local service commissioners, and other local partners. There is evidence that handyperson services generate modest cost savings. The Handypersons Financial Benefits Toolkit can be used to make this “value-for-money” case, and also be used as a planning tool to demonstrate how additional resources or targeting of services can generate more savings.
However, the “value-added” arguments for handyperson services also need to be made. Feedback from service users is essential to building a case for handyperson services. Satisfaction surveys can generate a picture of who is using the service, the quality of the service and the differences the services have made.27 More in-depth portraits or examples of individual cases can also be built up from interviews and discussions with service users, and these can be powerful ways of adding human faces and experiences to numbers, illustrating how the less quantifiable aspects of the service are valued by service users, and the potential differences that services can make to individuals. Moreover such material can be used by service providers to reflect on service quality and areas for improvement and innovation. This in turn strengthens the argument for handyperson service being client focused.
While some agencies might be able to offer financial support for specific programmes or initiatives, there will be more organisations and professional groups who can lobby on behalf of handyperson services. Occupational therapists, hospital discharge teams, and
community nurses are obvious working partners and are well placed not only to direct service users to handyperson services but also to make the case within their own organisations about the value of services. Local councillors are also in positions of influence, and the case for services needs to be made to them.
Older people’s groups and forums can also help promote the service to potential service users, and assist with service development. In one case study example, the local Older People’s Forum had decided on the level of charging for the handyperson service. In another case, the Chair of the Local Older People’s Forum sat on the management board of the handyperson service, and was able to be a powerful champion for the service.
27
For guidance on customer satisfaction see:
Section 3:
How the DCLG Part A
Handyperson Funding was used
Key Findings
• Spend on handyperson services increased through the duration of the programme;
• Across handyperson services there was:
o Increased capacity;
o An increase in the range of services provided;
o To a lesser extent, new client groups served;
o Employment of additional handyperson staff, subcontractors, and funding of service infrastructure such as administration.
• There was an increase in the number of clients supported;
• Services were mostly directed towards those who were older or had disabilities or long term conditions;
• The services delivered value for money: using the Handypersons Financial Benefits Toolkit, financial benefits outweighed costs by 13 per cent in addition to non-financial and unquantifiable benefits.
3.1 INTRODUCTION
This section of the report analyses the impact of the Part A element of the DCLG Handyperson Programme in the context of overall funding of handyperson services. It examines spending levels, use of funds, activities and clients supported. The evidence for these findings is drawn from the two surveys of local authorities and service providers which collected information about their use of Part A funding for handyperson services in 2009/10 and 2010/11. This evidence is supplemented by data from the service user survey.
One of the aims of the evaluation was to identify the value-for-money of the Handyperson Programme and enhanced pilots by exploring the costs of running the programme and additional net cost savings that could be generated from handyperson interventions. However, many28 service providers had received various funding sources from their local authorities in a way that made it difficult for them to differentiate between the DCLG handyperson funding and other monies used to commission handyperson services at the local level. These service providers were unable to calculate how much Part A handyperson funding they had received and hence the direct activities associated with this funding. This was also the case with some local authorities who had combined the Part A handyperson
28
funding into a larger pot of money. The surveys collected data about the spend and
activities associated with the Part A handyperson funding where possible; otherwise service providers submitted data about all their spend on, and activity associated with, handyperson services.
3.2 SPEND ON HANDYPERSON SERVICES
[image:26.595.77.526.248.305.2]Average29 spend on handyperson services for all local authorities appears to have increased slightly from 2009/10 to 2010/11 (Table 3.1). Over the two year period, the proportion of overall spend on handypersons accounted for by the DCLG funding rose.
Table 3.1 Average spend on handyperson services by local authorities
Average spend by local
authorities from all sources (£)
Average spend using DCLG Part A funds (£)
Average spend using DCLG Part A fund as % of all spend
2009/10 2010/11 2009/10 2010/11 2009/10 2010/11
£188,423 £191, 824 £58,939 £95,275 31% 48%
Data source: First and second local authority surveys: first survey baseline 76 responses; second survey baseline 67 responses.
3.3 HANDYPERSON ACTIVITIES AND USE OF FUNDS
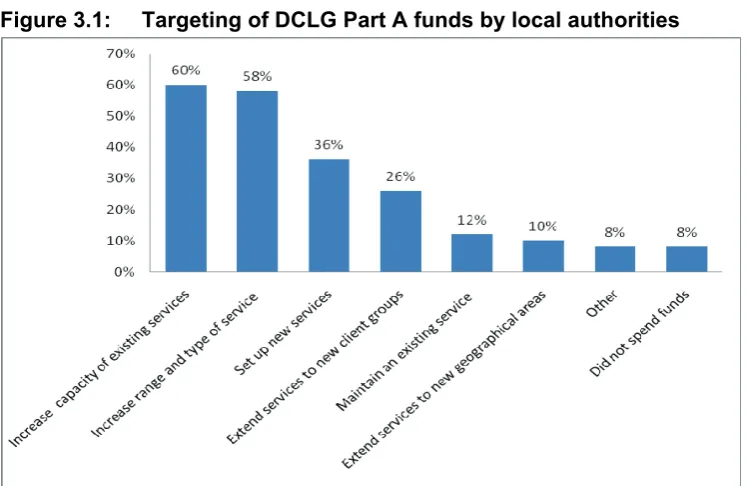
The majority of local authorities targeted the additional DCLG funds at increasing the
capacity of existing services, or increasing the range and type of services offered, as shown in Figure 3.1. Nineteen per cent of county councils reported extending services to new geographical areas. Only 12 per cent of local authorities reported using the funding to replace existing funding sources.
29
Figure 3.1: Targeting of DCLG Part A funds by local authorities
Data source: First survey to local authorities: baseline 76 responses. Respondents could give multiple responses.
Survey respondents were also invited to offer comments regarding increasing or extending service provision. Examples of these comments include:
“Allowed us to offer the service to more people and promote this with a marketing campaign.”
“Increased number of handypersons to keep up with growing demand for related preventative services.”
“The capacity of the existing handyperson services was doubled with the additional funding and this was to a level that the provider felt would meet demand within the borough.”
“Operating in a large rural county, it has enabled us to expand the service to reach more people, more quickly – cutting down waiting times and improving the safety and quality of life to enable older people to remain living independently in their own homes and environment.”
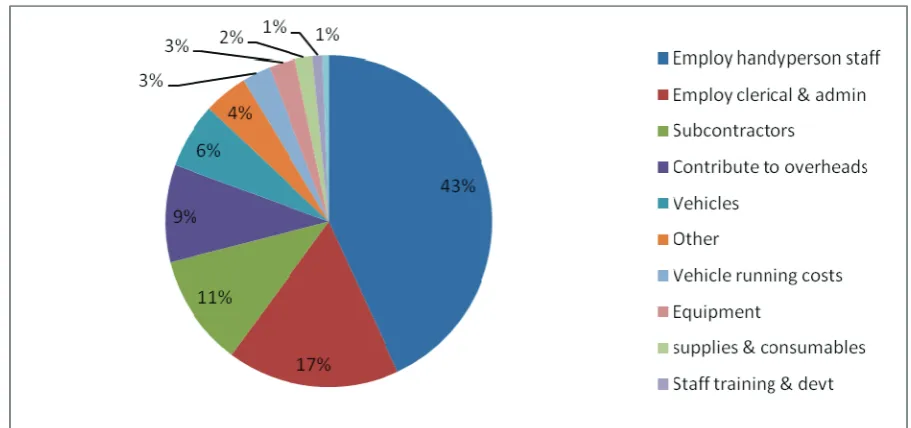
Figure 3.2 shows that overall, some 43 per cent of total spend was used to employ
Figure 3.2: Breakdown of total spend for Part A funds
Data source: First service provider survey; baseline 111 responses.
Although spending on subcontractors accounts for 11 per cent of the total spend of Part A funds, survey responses also indicated that almost two thirds (59 per cent) of providers had used contractors for some jobs. Case study interviews indicated that provider organisations will often subcontract certain types of work that require more than basic handyperson skills (for example, a qualified electrician or gas fitter), and indeed some organisations only use subcontractors rather than employ in-house staff. Only two per cent in total has been spent on staff training and development and support for volunteers.
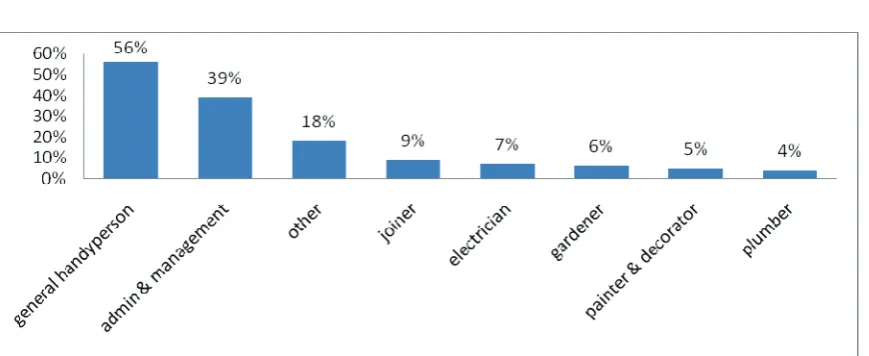
Eighty percent of service providers employed additional staff. The average number of new staff employed by these service providers was 2.530 (with a range from 1 - 6). Overall the average increase in staff hours worked was 100 per week31. Thus providers have not only increased staff numbers but have also expanded services through the increase in hours across existing staff.
Service providers were asked for information on what type of additional staff were employed and/or what type of staff had worked additional hours. Figure 3.3 shows that providers typically employed additional general handypersons, with almost 40 per cent employing additional administrative staff. Six per cent of respondents also indicated that they had not employed additional staff or funded additional hours.
30
This figure is based on headcount, not whole time equivalents.
31
Figure 3.3 Categories of additional staff employed
Data source: First service provider survey: baseline 111 responses. Respondents could give multiple responses.
Thirteen per cent of service providers indicated that volunteers were supported using the Part A Handyperson Programme funding, with the number of volunteers varying from 0.5 to 20 and only seven per cent of respondents told us that volunteers were trained using Part A funding, with numbers ranging from 1 to 17. These findings accord with the case studies interviews that the use of volunteers in the delivery of handyperson services is not well established. The primary reasons for not using volunteers was the time taken to recruit, train, and obtain CRB checks for individuals who may then not continue to be active volunteers for very long. Some providers felt it was something they would consider in the future if funding for services was constrained.
3.4 CLIENTS
[image:29.595.71.527.568.678.2]Table 3.2 shows that the average number of clients per provider receiving handyperson services has increased over the period of the evaluation (from 2009/10 to 2010/11) suggesting that the Handyperson Programme has had a positive impact on the number of clients that have been supported by a handyperson service.
Table 3.2: Number of clients visited
Number of clients (average & range) Year
Service providers able to identify DCLG Part A funding
Service providers not able to identify DCLG Part A funding from total funding
2008/09 N/A 789 (122 – 2385)
2009/10 445 (29 - 2225) 1106 (244 – 2691)
2010/11 774 (38 – 3750) 1302 (248 – 6003)
Data source: First and second service provider surveys: first survey baseline 111 responses; second survey baseline 63 responses.
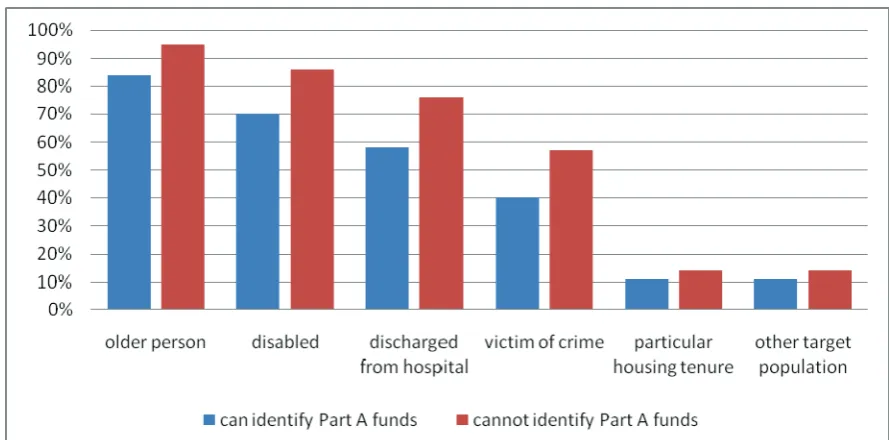
Unsurprisingly, those who could not separate Handyperson Programme funding from the total funding that came into their organisation from a range of sources appear to direct their funding to a wider range of groups. As their funding has come from a wider range of
sources (not just the Handyperson Programme) it seems highly likely that other funding has been given for specific purposes (for example hospital discharge programmes) or to support a wider range of client groups, (for example, younger people with disabilities including families with disabled children, victims of crime and domestic violence).
Figure 3.4: Client groups to which handyperson programme funding was directed
Data source: First service provider survey; baseline 111 responses. Respondents could give multiple responses.
Sources of Referrals
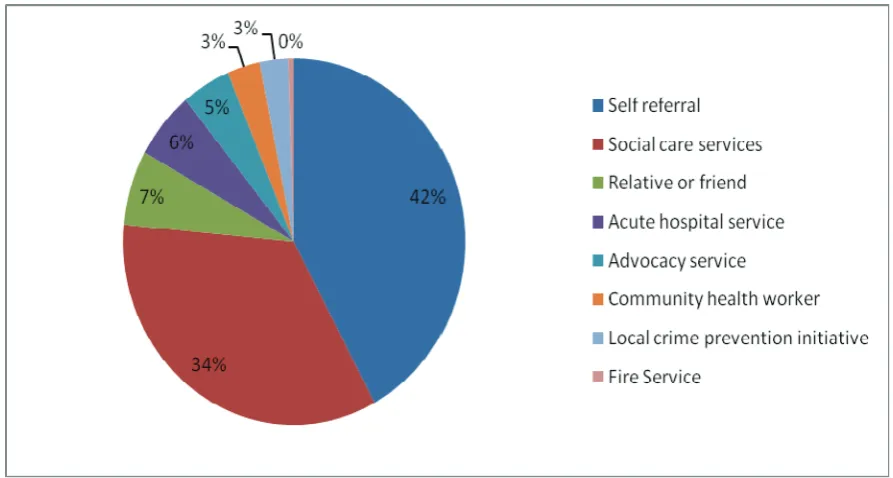
Figure 3.5 shows the total percentage of referralsto service providersby source indicating that self referral and social care services together accounted for more than three-quarters of all referrals. Small numbers of less than 10 per cent came from the other sources including hospitals, a relative or friend, and advocacy services. The relatively low use of referrals by acute hospital services may indicate a lack of knowledge about handyperson services or alternative models of care for these groups of people such as by discharge management teams provided by local community health services, re-ablement or intermediate care services.
[image:30.595.70.515.199.419.2]Figure 3.5: Sources of referrals
Data source: First service provider survey; baseline 111 responses.
3.5 HANDYPERSON ACTIVITIES
Drawing on the responses to the first provider survey, Figure 3.6 shows the proportion of service providers offering particular types of work and services. This analysis indicates that small repairs and minor adaptations are the main activities offered by handyperson services, in keeping with the philosophy of ‘Small Things Matter32’. Home security and safety
improvements and checks also account for around one-fifth of activities, whilst falls prevention only accounts for one-tenth of handyperson activity (although much of the preventive work including minor adaptations may also prevent falls).
32
Figure 3.6: Percentage of providers by handyperson activities
Data source: First service provider survey; baseline 111 responses. Respondents could give multiple responses.
Service providers were also asked what proportion of their clients received particular types of handyperson services. Figure 3.7 shows what proportion of service users received different types of services.
Figure 3.7: Percentage of service users receiving different types of handyperson activity
[image:32.595.75.525.76.286.2] [image:32.595.75.526.436.651.2]3.6 COSTS AND BENEFITS OF HANDYPERSON SERVICES
[image:33.595.77.523.217.304.2]Table 3.3 brings together information on spend from the two surveys of service providers, with data on the number of clients visited to give an estimated cost per client across both years. It must be noted that the analysis is of cost per client, not cost per visit. Other data sources, including the service user survey indicate that most clients receive more than a single visit, and many receive multiple visits, therefore the cost per client will be higher than cost per visit.
Table 3.3: Average cost per client
Service provider Can identify DCLG Part A
funding
Cannot identify DCLG Part A funding
2009/10 2010/11 2009/10 2010/11
Average spend £35,234 £52,085 £103,176 £187,416
Average no clients 445 774 1106 1302
Average cost per client £79.18 £67.29 £93.29 £143.94
Data source: First and second service providers surveys: first survey baseline 111 responses; second survey baseline 63 responses.
The average cost per client for those service providers that can identify their Part A funding was £79 in the first year, decreasing to £67 in the second (possibly as a result of having fully established their service and achieving full capacity and efficiency). These average costs per client visited are not significantly greater than costs revealed in other surveys undertaken by, for example, Foundations, the national body for home improvement agencies in
England33. The costs reported above are also unlikely to include overheads (excepting some infrastructure costs specifically funded by these monies) as the Part A funding was mostly used to extend services rather than establish new services, and many overhead costs such as capital and management costs have already been met, although service providers have also spent funding on vehicles, equipment and some training. Thus whilst there may be increasing economies of scale in management and administration, the Part A funds have mostly funded front-line staff and the delivery of handyperson services to clients.
However, the cost per client for those that cannot identify their DCLG handyperson funding has risen from £93 to £144 per client between 2009/10 to 2010/11. It could be that these costs are full absorption costs (in other words include some or all overheads). It is also possible that these handyperson services cover a wider range of services and client types, including many clients with complex needs, providers offering a wider range of services, or more time-consuming and more costly services. The data on variance in the number of clients served suggests this is the case, with some service providers supporting a small number of clients with complex needs, whilst others supported a larger number of older people with relatively simple requirements.
33
The benefits achieved by the Part A element of the Handyperson Programme funding can also be assessed by running the data collected during the evaluation through the
Handypersons Financial Benefit Toolkit34. This Toolkit enables commissioners and providers to identify and quantify the benefits from handyperson services and to develop business cases for local services. The Toolkit requires data on number of clients, the activities received by the clients, the average number of visits received by those clients and the costs of the service. Default options are built into the toolkit which can be used if the data are not available. The model can also be run many times with different data to investigate the impact of changes in, for example, number of clients, number of visits received by client, costs of services and activities delivered to clients35
. Below are the results of running the model under different assumptions using data from this evaluation.
Core data on clients and costs, as shown in Table 3.4 below, indicates that for those service providers able to identify the impact of Part A funding, the average number of clients seen was 774 and the cost was £52,085. Data on handyperson activities collected during the evaluation does not directly map onto handyperson activities identified in the Benefit Toolkit. Therefore, in order to run the data collected during the evaluation through the Toolkit, the evaluation activities were mapped onto the Toolkit activities as shown in Table 3.4.
34
Available from http://www.communities.gov.uk/publications/housing/financialbenefitstoolkit.
35
Table 3.4: Average number of clients by handyperson activity recalculated for Handypersons Financial Benefit Toolkit
Evidence in Model Re-calculated for Model
Original Activities Average % of total clients No of clients
Activities as per Handyperson FB Toolkit
Average % of total
clients No of clients
Small repairs 32.9% 255
Small repairs (including falls prevention)
38.8% 300
Home security
improvements 6.5% 50
Home security and
home safety checks 19.5% 151
Minor adaptations 19.7% 153
Minor adaptations (including falls prevention)
23.3% 180
Hospital discharge 3.2% 25 Hospital discharge 3.2% 25
Energy efficiency
improvements 2.0% 15
Energy efficiency
improvements 2.0% 15
Gardening 3.2% 25
Fire safety
improvements 4.2% 33
Fire safety
improvements 4.2% 33
Home safety
checks 13.0% 101
Falls prevention 9.3% 72
Other 5.8% 45 Other (including
gardening) 9.0% 70
Total 100.0% 774 Total 100.0% 774
The underlying assumption in the Toolkit is that each client receives 1.1 visits, based on national data. The service provider survey data indicates that an additional 2.5 full time staff members were employed with Part A funds, of which around 60 per cent are frontline (in other words, not administrative and clerical). Assuming that each handyperson can achieve four visits a day for 200 days per annum, then these additional staff members will contribute 1,200 visits. In other words, each client will receive 1.55 visits.
Using the above evaluation data on clients, activities, visits and costs, the resulting financial benefits are shown in Table 3.5 and the cost benefit equation is shown in Table 3.6. These results indicate that using the data collected during the evaluation to change the
assumptions in the Toolkit on clients, activities, visits, and costs, the benefits achieved outweigh the cost of providing the Handyperson Programme by 13 per cent.
Table 3.5: Financial benefits achieved
Financial benefits Number Units (per annum) Total benefits
Reduced falls 27 Falls prevented £33,129
Improved or maintained independent living – sheltered
3 People prevented moving into sheltered accommodation
£20,886
Reduced use of social
services 2
People prevented using social
services £2,028
Reduced fuel poverty 28 People with reduced bills £2,912
[image:36.595.68.529.99.292.2]Total £58,955
Table 3.6: Financial benefit equation
Budget Cost Gross benefit Net benefit (+/-
%)
Ratio (£)
[image:36.595.80.526.289.335.2]Total £52,085 £58,955 +13% 1: 132
Table 3.7: Budgets to which benefits accrue
Financial benefits Health
Social services
Individual
Total benefits
Reduced falls £19,546 £13,583 - £33,129
Improved or maintained independent living – sheltered
£20,886 - £20,886
Reduced use of social
services £2,028 £2,028
Reduced fuel poverty £2,912 £2,912
Total £19,546 £36,497 £2,912 £58,955
It must be noted that the outputs from the Handyperson Financial Benefits Toolkit are highly sensitive to changes in the assumptions. A conservative approach was used in relation to the evidence base and working assumptions used in the Toolkit. For example, there are a number of studies that demonstrate the effectiveness of various small repairs in preventing falls, ranging from a reduction of 32 per cent to 66 per cent. The Toolkit uses the lower of these figures to calculate how many fewer falls should result from this type of intervention. But if the impact of the falls prevention activities, rather than just being included in small repairs and minor adaptations, were given a higher weighting in the Toolkit, so that the reduction in incidence of falls was increased from 32 per cent to 40 per cent for the 10 per cent of people at risk from falls, then the gross benefits would be increased to £66,317 (outweighing costs by 27 per cent), assuming the number of visits were 1.55 per client.
The above analysis used the Handypersons Financial Benefits Toolkit to demonstrate retrospectively that the impact of the Part A element of DCLG Handyperson Programme funding and associated activity has been cost beneficial. It has also demonstrated that under the assumptions arising from the evaluation findings, the benefits from the Part A funding of the handyperson services outweigh the costs.
It is to be noted that an equally valuable approach to using the Financial Benefits Toolkit is for the prospective planning of services. Service providers and commissioners can input to the Toolkit a range of ‘test’ data on service costs, expected client numbers and activities, and test under what assumptions the benefits from delivering the services outweigh the costs and to whom these benefits will accrue (for example health or social services or to the client). The findings from the evaluation however indicate that value-for-money is more likely to be achieved if services are targeted at those areas where financial benefits can be
Demonstrating the financial benefits for more complex services, where greater time is spent with a smaller number of clients, or services targeted to a more complex client group, may be more difficult to achieve using the Toolkit. It is difficult to put a monetary value on the benefit of these activities, however this does not mean that there is no significant benefit to the service recipient (or to other services).
Section 4:
Meeting the Needs of Service
Users
Key Findings
• Handyperson service users are predominantly older women with health problems or disabilities, living alone on low or modest incomes in older properties. However a significant number of service users live with and care for their spouse or partner;
• Both the service user survey and interviews showed very high levels of satisfaction with all aspects of handyperson services;
• Services support service users’ independence, their ability to carry out activities of daily living (and caring), and enhance their feelings of security and comfort in their homes. Crucially these services allow service users to feel in control of their home environments;
• Although affordability is important, service users value a number of different aspects of handyperson services that provide “added value”: trustworthiness; reliability; knowing there is help available; and the respectful and helpful attitudes of staff;
• Although many service users are on low incomes, some service users would be prepared to contribute something towards the costs of services; their primary concern is that services continue;
• Service users value services that are provided or endorsed by organisations they know they can trust.
4.1 INTRODUCTION
A main focus of the evaluation was to identify how handyperson services met service users’ needs, and to gauge service users’ views about the ways in which services made a
4.2 PROFILE OF SERVICE USER SURVEY RESPONDENTS AND INTERVIEWEES
The majority of services users who took part in the telephone survey were aged 65 or above (79 per cent). Sixty six per cent lived alone and 24 per cent lived with their spouse or
[image:40.595.75.477.172.496.2]partner. Seventy five per cent were women. Figure 4.1 shows the health profile of survey respondents. Figures 4.2 to 4.4 show that the majority of respondents were homeowners living in properties that were more than 50 years old.
Figure 4.1: Health profile of service user survey respondents
89%
54%
52%
33%
0% 10% 20% 30% 40% 50% 60% 70% 80% 90% 100%
Impairment of any
type
Long term health
problem
Disabled Self rated health
poor
Figure 4.2: Housing tenure of service user survey respondents
Source: Service user survey, baseline 173 respondents
Figure 4.3: Type of property occupied by service user survey respondents
[image:41.595.72.436.359.608.2]