SDSS J141126.20+200911.1
.
White Rose Research Online URL for this paper:
http://eprints.whiterose.ac.uk/104551/
Version: Accepted Version
Article:
Littlefair, S.P., Casewell, S.L., Parsons, S.G. et al. (14 more authors) (2014) The substellar
companion in the eclipsing white dwarf binary SDSS J141126.20+200911.1. Monthly
Notices of the Royal Astronomical Society, 445 (2). pp. 2106-2115. ISSN 0035-8711
https://doi.org/10.1093/mnras/stu1895
This is a pre-copyedited, author-produced PDF of an article accepted for publication in
Monthly Notices of the Royal Astronomical Society following peer review. The version of
record Littlefair et al The substellar companion in the eclipsing white dwarf binary SDSS
J141126.20+200911.1 MNRAS (December 01, 2014) Vol. 445 2106-2115 is available
online at: http://dx.doi.org/10.1093/mnras/stu1895.
[email protected]
https://eprints.whiterose.ac.uk/
Reuse
Unless indicated otherwise, fulltext items are protected by copyright with all rights reserved. The copyright
exception in section 29 of the Copyright, Designs and Patents Act 1988 allows the making of a single copy
solely for the purpose of non-commercial research or private study within the limits of fair dealing. The
publisher or other rights-holder may allow further reproduction and re-use of this version - refer to the White
Rose Research Online record for this item. Where records identify the publisher as the copyright holder,
users can verify any specific terms of use on the publisher’s website.
Takedown
If you consider content in White Rose Research Online to be in breach of UK law, please notify us by
The substellar companion in the eclipsing white dwarf
binary SDSS J141126.20+200911.1
S. P. Littlefair
1, S. L. Casewell
2, S. G. Parsons
3, V. S. Dhillon
1, T. R. Marsh
4,
B. T. G¨
ansicke
4, S. Bloemen
5, S. Catalan
4, P. Irawati
6, L. K. Hardy
1, M. Mcallister
1,
M. C. P. Bours
4, Andrea Richichi
6, M. R. Burleigh
2, B. Burningham
7,
E. Breedt
4, P. Kerry
11
Dept of Physics and Astronomy, University of Sheffield, Sheffield, S3 7RH, UK
2
Department of Physics and Astronomy, University of Leicester, University Road, Leicester LE1 7RH, UK
3
Departmento de F´ısica y Astronom´ıa, Universidad de Valpara´ıso, Avenida Gran Bretana 1111, Valpara´ıso 2360102, Chile
4
Dept of Physics, University of Warwick, Coventry, CV4 7AL, UK
5
Department of Astrophysics, IMAPP, Radboud University Nijmegen, PO Box 9010, NL-6500 GL Nijmegen, Netherlands
6National Astronomical Research Institute of Thailand, Chiang Mai, Thailand, 50200
7Centre for Astrophysics Research, Science and Technology Research Institute, University of Hertfordshire, Hatfield AL10 9AB, UK
11 September 2014
ABSTRACT
We present high time resolution SDSS-g′ and SDSS-z′ light curves of the primary
eclipse in SDSS J141126.20+200911.1, together with time-resolved X-Shooter spec-troscopy and near-infrared J HKsphotometry. Our observations confirm the
substel-lar nature of the companion, making SDSS J141126.20+200911.1 the first eclipsing white dwarf/brown dwarf binary known. We measure a (white dwarf model depen-dent) mass and radius for the brown dwarf companion ofM2= 0.050±0.002M⊙and R2= 0.072±0.004M⊙, respectively. The lack of a robust detection of the companion
light in the z′-band eclipse constrains the spectral type of the companion to be later
than L5. Comparing the NIR photometry to the expected white dwarf flux reveals a clearKs-band excess, suggesting a spectral type in the range L7–T1.
The radius measurement is consistent with the predictions of evolutionary mod-els, and suggests a system age in excess of three Gyr. The low companion mass is inconsistent with the inferred spectral type of L7–T1, instead predicting a spectral type nearer T5. This indicates that irradiation of the companion in SDSS J1411 could be causing a significant temperature increase, at least on one hemisphere.
Key words: binaries: close - binaries: eclipsing - stars
1 INTRODUCTION
The eclipsing white dwarf binary SDSS J141126.20+200911.1 (also known as CSS21055, here-after called SDSS J1411) was first noted in the catalogue of Drake et al. (2010), but independently discovered by Beuermann et al. (2013, hereafter B13). The SDSS photometry and spectroscopy are dominated by the white dwarf component, and show no hint of a companion. From the SDSS data, Kleinman et al. (2013) derived an effective temperature ofTeff = 13074±1306 K, logg= 7.89±0.12 and a mass ofM1 = 0.551 M⊙, suggesting a carbon-oxygen
core white dwarf. From white-light observations, B13 noted the narrow eclipse was indicative of a small companion. Bessel I-band observations with lower time resolution allowed B13 to create an in-eclipse I-band image, in which
all the light comes from the companion. SDSS J1411 was not detected in this image, setting a model-dependent 1σ upper limit on the companion mass of 0.075M⊙. The
faintness of the companion in the optical thus suggests a substellar mass for the companion in SDSS J1411, which would make it the first eclipsing white dwarf/brown dwarf binary identified.
Here we present photometric and spectroscopic obser-vations of SDSS J1411. We use these data to constrain the mass, radius and spectral type of the companion in SDSS J1411. We confirm the substellar nature of the companion, firmly establishing SDSS J1411 as the first detached, eclips-ing white dwarf/substellar binary identified. The observa-tions are described in section 2, the results are presented in section 3, and discussed in section 4.
Date Start Phase End Phase Instrument Tmid Exp. time Data points Seeing Airmass Phot?
BMJD(TDB) (seconds) (arcseconds)
2014 Jan 25 8179.941 8180.106 USPEC 56682.86665(2) 6.53 124 1.6–3.1 1.20–1.22 Yes
2014 Jan 25 8180.850 8181.131 USPEC 56882.95116(1) 6.53 209 1.5–2.4 1.00–1.01 Yes
2014 Jan 26 8191.931 8192.053 USPEC 56683.88102(1) 6.53 92 1.4–1.6 1.14–1.18 Yes
2014 Jan 27 8202.935 8203.046 USPEC 56684.81085(2) 6.53 84 1.7–2.5 1.61–1.73 Yes
2014 Jan 28 8214.904 8215.041 USPEC 56685.82528(2) 6.53 103 1.7–3.4 1.44–1.55 Yes
2014 Jan 29 8227.889 8228.045 USPEC 56686.92421(2) 6.53 117 1.5–2.6 1.02–1.04 Yes
2014 Jan 31 8251.945 8252.032 USPEC 56688.95300(2) 8.39 66 2.0–3.1 1.00–1.01 Yes
2014 Feb 01 8261.959 8262.067 USPEC 56689.79835(2) 6.53 82 1.7–2.6 1.58–1.70 Yes
2014 Mar 02 8607.828 8608.037 UCAM 56719.046632(6) 2.04 741 1.4–3.4 1.09–1.14 Yes
2014 Mar 16 8775.867 8776.125 UCAM 56733.248125(7) 4.54 412 1.2–1.4 1.11–1.19 No
2014 Mar 26 8887.909 8888.033 USPEC 56742.71576(2) 9.89 93 1.4–1.6 1.18–1.23 Yes
2014 Mar 26 8889.934 8890.048 USPEC 56742.88489(2) 9.89 85 1.2–1.5 1.09–1.11 Yes
2014 Mar 27 8899.939 8900.063 USPEC 56743.73021(2) 9.89 93 1.3–1.5 1.10–1.14 Yes
2014 Mar 27 8900.970 8901.075 USPEC 56743.81472(2) 9.89 69 1.1–2.7 1.00–1.01 Yes
2014 Mar 27 8901.958 8902.077 USPEC 56743.89923(2) 9.89 89 1.2–1.4 1.25–1.05 Yes
2014 Mar 28 8912.904 8913.080 USPEC 56744.82912(1) 9.89 131 1.2–1.6 1.00–1.02 Yes
2014 Mar 28 8913.966 8914.064 USPEC 56744.91365(2) 9.89 73 1.2–1.7 1.23–1.27 Yes
2014 Mar 30 8936.961 8937.090 USPEC 56746.85791(1) 9.89 96 1.2–1.4 1.05–1.08 Yes
2014 Mar 30 8937.847 8938.142 USPEC 56746.94244(2) 9.989 216 1.3–2.4 1.38–1.62 Yes
2014 Feb 20 8491.952 8492.600 LIRIS/K n/a 10.00 136 Variable 1.00-1.10 Yes
2014 Mar 17 8787.693 8788.223 LIRIS/H n/a 10.00 125 Variable 1.10–1.30 Yes
2014 Apr 08 9045.490 9045.834 LIRIS/J n/a 20.00 60 Poor 1.03–1.10 No
2014 Apr 19 9165.047 9166.955 X-Shooter n/a 450/600/300 28/21/44 0.7–1.0 1.65–1.66 n/a
[image:3.612.44.581.90.376.2]2014 Apr 20 9178.202 9178.753 X-Shooter n/a 450/600/300 9/7/13 0.7–0.9 1.44–1.65 n/a
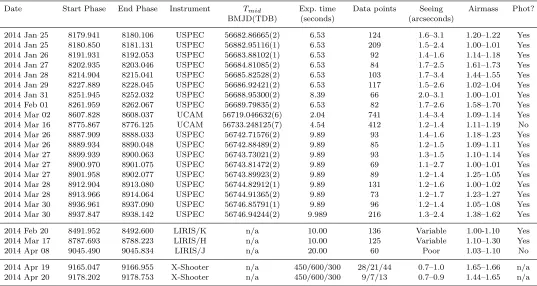
Table 1.Journal of observations. For ULTRACAM (UCAM) observations, the dead-time between exposures was 0.025 s, for
ULTRA-SPEC (UULTRA-SPEC) the dead-time was 0.015 s. The relative GPS timestamping on each UCAM/UULTRA-SPEC data point is accurate to 50µs,
with an absolute accuracy better than 1 ms.Tmidgives the time of mid eclipse (see section 3.4). For X-Shooter, we provide exposure
times in the UVB/VIS and NIR arms respectively. The column Phot? indicates if the night was photometric.
2 OBSERVATIONS
2.1 Optical Photometry
We observed eclipses of SDSS J1411 on a number of nights between January and March 2014 with the fast photometer ULTRASPEC (Dhillon et al, 2014, MNRAS, submitted) on the 2.4-m Thai National Telescope (TNT) on Doi Inthanon, Thailand. Observations were carried out in the SDSS z′
-band filter. In addition, we observed two eclipses of SDSS J1411 on the nights of 2014 Mar 2nd and 2014 Mar 16th with the triple-beam high-speed photometer ULTRACAM (Dhillon et al. 2007) on the 4.2-m William Herschel Tele-scope (WHT) on La Palma. On these occasions, we observed simultaneously in the SDSS-u′g′z′ filters. A complete
jour-nal of observations is presented in Table 1. In addition to observations of the eclipses, we observed the field of SDSS J1411 once with each instrument, applying random offsets to the pointing, which allowed us to median-stack these images to create an image for removal of fringing from thez′-band
images.
Data reduction was carried out in a standard man-ner using theultracampipeline reduction software, as de-scribed in Feline et al. (2004). In addition to the usual ap-plication of bias and flat frames, the fringe frame was sub-tracted from each data frame after being scaled by a con-stant which was chosen to minimise the variance in the back-ground of the fringe-subtracted data frame. ULTRASPEC on the TNT suffers from a significant (≈10 percent) con-tribution from scattered light, thought to originate from
in-adequate baffling of the tertiary mirror. This scattered light also affects the structure in the fringe frame, and changes in the baffling following the observation of the fringe frame in January meant that fringe removal did not work for the data taken in March. Therefore, we created a fringe frame for the March data using the following recipe.z′-band
im-ages from a single night (2014 Mar 26th) were combined to make a deep image in which stars were detected using sextractor. Each star in this catalogue was removed from each individualz′
-band image by fitting and subtracting a Moffat-profile (Trujillo et al. 2001) to the star. The star-subtracted images were then median stacked to produce a fringe frame. The lightcurves of three nearby stars were av-eraged to produce a comparison star lightcurve in order to correct the data for transparency variations. The effective SDSSz′-band magnitude of this comparison light curve was
z′
= 14.859.
2.2 Infrared Photometry
starlink gaiapackage and an aperture equal to 1.5 times the image full-width half-maximum. For each image, five ref-erence stars with magnitudes listed in the 2MASS catalogue were used to derive a zeropoint, which was then used to cal-ibrate the photometry. As both LIRIS and 2MASS use the same filter set, no additional colour corrections were applied.
2.3 X-shooter Spectroscopy
We observed SDSS J1411 with the medium resolution spec-trograph X-shooter (D’Odorico et al. 2006) mounted at the Cassegrain focus of VLT-UT2 at Paranal. X-shooter is com-prised of three detectors: the UVB arm, which gives spectra from 0.3-0.56 microns, the VIS arm which covers 0.56-1 mi-crons and the NIR arm which covers 1-2.4 mimi-crons. We used slit widths of 1.0, 0.9 and 0.9 arcseconds in X-shooter’s three arms and binned by a factor of two in the dispersion direc-tion in the UVB and VIS arms, and a factor of two in the spatial direction in the UVB arm, resulting in a spectral resolution of 2500–3500 across the entire spectral range.
The reduction of the raw frames was conducted us-ing the standard pipeline release of the X-shooter Common Pipeline Library (CPL) recipes (version 6.4.1) within ES-ORex, the ESO Recipe Execution Tool, version 3.10.2. The standard recipes were used to optimally extract and wave-length calibrate each spectrum. The instrumental response was removed by observing the spectrophotometric standard star LTT 3218 and dividing it by a flux table of the same star to produce the response function. The wavelength scale was also heliocentrically corrected. A telluric correction was applied using observations of the DQ white dwarf GJ 440 obtained just before the start of our observations and imple-mented using theMolecfitpackage (Kausch et al. 2014).
X-shooter is ideally suited for studying the compos-ite spectra of post common envelope binaries since its long wavelength range potentially provides features from both stars simultaneously, allowing precision measurements to be made (see for example Parsons et al. 2012b,a, 2013). We searched the X-shooter spectrum for features from the sub-stellar component but no emission line or absorption line features attributable to the companion were found. How-ever, the NIR spectra have very low signal-to-noise hence any features at these wavelengths may not have been picked up. In our subsequent analysis we ignore the NIR spectra.
3 RESULTS
3.1 The White Dwarf in SDSS J1411
In order to find the effective temperature and gravity of the white dwarf, we fit the average X-Shooter spectrum, shifted into the reference frame of the white dwarf (see section 3.6). Our model consists of a set of DA white dwarf model spectra with mixing length ML2/α= 0.8 (Koester 2010) computed on a grid of 7.25 ≤ logg ≤ 8.5 in steps of 0.25 dex and 12000≤Teff ≤13750 K in steps of 250 K. Linear bivariate interpolation was used to calculate model spectra at a given value of logg and Teff, and synthetic spectra produced by computing the average of three points within each spectral bin of the X-Shooter spectrum. To account for the effects
of extinction and uncertainties in flux calibration of the X-Shooter spectrum, we follow Eisenstein et al. (2006) and marginalise over a polynomial of order five that multiplies the model spectrum. This ensures our best fit values are controlled by the line widths and strengths, rather than the continuum shape.
We estimated the posterior probability distributions for logg and Teff using an implementation of the Affine-Invariant Markov-Chain Monte-Carlo (MCMC) sampler (Foreman-Mackey et al. 2013). A systematic error on the flux values was included as a ’nuisance parameter’ in the model. We estimate the most likely values for each param-eter by the median of all values in the MCMC chains. This suggests a white dwarf temperature ofTeff = 13000±15 K, and logg = 7.86±0.01. The X-Shooter spectrum, and most likely model, are shown in Figure 1. The uncertain-ties quoted above are purely statistical and do not account for systematic uncertainties either in the spectroscopic data, models or fitting procedure. We follow Napiwotzki, Green & Saffer (1999) and allow systematic errors of 2.3 percent in Teff and 0.07 dex in logg, to obtain final estimates of
Teff = 13000±300 K, and logg= 7.86±0.07. Our results are compatible with, but more precise than, the results of Kleinman et al. (2013).
Additional constraints on the white dwarf can be found using the SDSS photometry and the cooling models of Hol-berg & Bergeron (2006)1
. Bivariate cubic-spline interpola-tion of this model grid provides absolute SDSS magnitudes at a given loggandTeff. These are then reddened for a given value of E(g−i) using the extinction law of Cardelli, Clayton & Mathis (1989) and converted to apparent magnitudes for a given distance,d. The posterior probability distributions for the parameter set{logg, Teff,E(g−i), d}are estimated using the same MCMC procedure described above. We use our constraints on loggandTeff from the Balmer-line fits as priors on these parameters. A uniform prior for E(g−i) was adopted, with values up to the galactic extinction along this line of sight (B13) allowed. A uniform prior was used for the distance. We find E(g−i) = 0.05±0.01 andd= 190±8 pc. Our estimates of loggandTeff are unchanged from the val-ues derived from the spectrum fitting. At each point in the resulting MCMC chains, the cooling models can be used to calculate a mass M1, radius R1 and cooling age tcool for the white dwarf. Posterior probability distributions for each parameter are approximately Gaussian and we find most likely values for each parameter of M1 = 0.53±0.03M⊙,
R1= 0.0142±0.0006R⊙andtcool= 260±20 Myr.
For single white dwarfs, it is possible to use an initial-final mass relation for the white-dwarf to estimate the age of the system. However, this should be considered an up-per limit on the system age, since SDSS J1411 has certainly evolved through a common envelope phase, which may have ocurred prior to the AGB phase of a more massive and short-lived progenitor. Furthermore, there is at present a signifi-cant amount of scatter between the predictions of different initial-final mass relations in the literature (e.g. Casewell et al. 2009; Salaris et al. 2009; Catal´an et al. 2008). This means it is not currently possible to constrain the age of SDSS1411 by this method.
1
4000 5000 6000 7000 8000 9000 10000 Wavelength ( )
0.3 0.4 0.5 0.6 0.7 0.8 0.9 1.0
Flux (mJy)
[image:5.612.72.521.103.328.2]Hβ Hγ Hδ Hǫ Hζ Hη
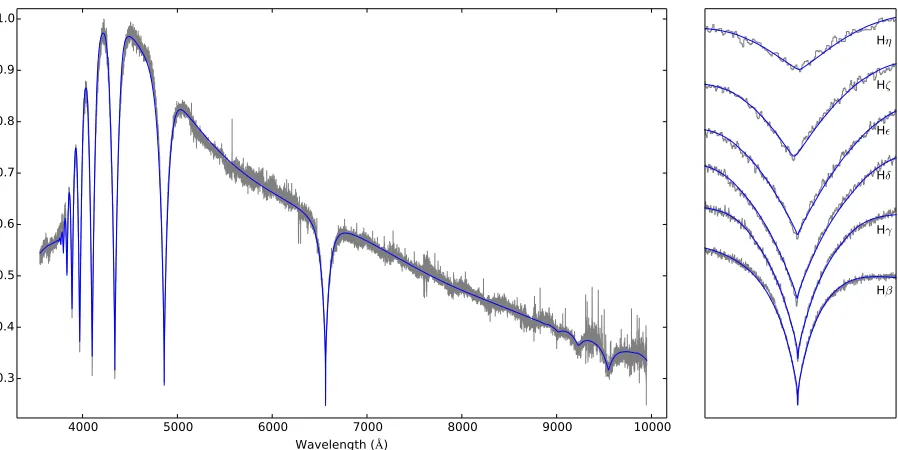
Figure 1. Left:The average X-Shooter spectrum, and best fit model. See section 3.1 for details of model. The model has been multiplied
by a 5th-order polynomial to account for overall normalisation, unknown reddening and uncertainties in flux calibration of the X-Shooter
spectrum. The best fit model hasχ2
= 65436 with 25996 degrees of freedom.Right:a zoom-in on the higher order Balmer lines.
0.00 0.05 0.10 0.15 0.20 0.25 0.30
Flux (mJy)
0.03 0.02 0.01 0.00 0.01 0.02 0.03
Orbital Phase 0.01
0.00 0.01
Residuals (mJy)
Figure 2. The SDSS-g′primary eclipse of SDSS J1411, together with the best-fit model. A dashed line indicates zero flux. The
best-fit model hasχ2
= 977 with 797 degrees of freedom.
3.2 The g′
-band primary eclipse of SDSS J1411
Theg′-band primary eclipse of SDSS J1411 is shown in
Fig-ure 2. The ULTRACAM eclipses listed in Table 1 have been phase-folded using the ephemeris of B13. The eclipse is the typical shape seen in total eclipses of a white dwarf primary. Encoded into the shape of this light curve is information about the binary inclination, and the sizes of the two com-ponents (scaled relative to the binary separation,a). We fit this light curve with a model which consists of the following parameters:
• q=M1/M2, whereM2 is the companion mass;
• the scaled radius of the white dwarf,R1/a;
• the scaled radius of the companion,R2/a;
• the linear limb-darkening parameter for the white dwarf,U;
• the inclination of the binaryi;
• the flux from the white dwarf outside of eclipse,F1;
• the flux from the companion,F2, and
• an offset of the eclipse centre from phase 0,φ0.
The model includes Roche distortion of the companion, and computes the visible flux from both components at each phase. Posterior probability distributions for the parameters are obtained by the same fitting procedure described in sec-tion 3.1, and are shown in Figure 3. We adopted uninfor-mative priors for most parameters. A Gaussian prior for the linear limb darkening parameter was determined from the tables of Gianninas et al. (2013), using our estimates ofTeff and logg. We also tried using quadratic limb darkening laws, which made no significant difference to the results. There are strong degeneracies in our model between three parameters; the radii of the two components R1/a and R2/a and the inclination i. Nevertheless, we are able to constrain these parameters, with likely values of R1/a = 0.0225±0.001,
R2/a= 0.107±0.005 andi= 86.5±0.4◦. Our model fitting provides few constraints on the mass ratioq. We can only say that values less than 0.1 are unlikely. This is because for very low mass ratios, Roche distortion becomes important, providing a poor fit to the light curve. There is no evidence for a detection of the companion in theg′
-band eclipse.
3.3 Thez′
-band primary eclipse
We fit the same model described in section 3.2 to thez′-band
eclipses, using the same priors as in theg′
param-0.0195 0.0210 0.0225 0.0240
R1
/a
0.2 0.3 0.4 0.5
U
0.102 0.108 0.114 0.120
R2
/a
85.2 85.8 86.4 87.0
i
0.1528 0.1530 0.1532 0.1534
F1
0.00000 0.00008 0.00016 0.00024 0.00032
F2
0.10 0.15 0.20 0.25 0.30
q
0.00030 0.00028 0.00026 0.00024
φ0
0.0195 0.0210 0.0225 0.0240
R1/a
0.2 0.3 0.4 0.5
U
0.102 0.108 0.114 0.120
R2/a
85.2 85.8 86.4 87.0
i
0.1528 0.1530 0.1532 0.1534
F1
0.000000.000080.000160.000240.00032
F2
0.00030 0.00028 0.00026 0.00024
[image:6.612.52.537.78.562.2]φ0
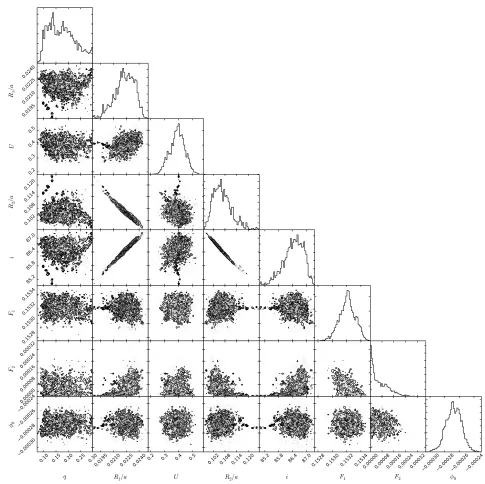
Figure 3. Posterior probability distributions for model parameters obtained through fitting theg′-band primary eclipse of SDSS J1411. See section 3.2 for details of model. Greyscales and contours illustrate the joint probability distributions for each pair of parameters, whilst histograms show the marginalised probability distribution for each individual parameter.
eters are shown in Figure 5, and the most likely model is shown in Figure 4. The posterior probability distribution implies a most likely companion flux ofF2= 7.5×10⁻⁴mJy, but the distribution is also consistent with zero flux from the companion. We therefore do not claim to detect the com-panion at mid-eclipse, but set a 99 percent upper limit to the companion flux of F2 < 1.9×10⁻³mJy. We can com-bine this with the estimates of the distance and reddening to SDSS J1411 obtained in section 3.1 to set a 99 percent limit on the absolutez′-band magnitude of the companion
ofz′
2 >16.6. Since this limit is derived during mid-eclipse, it is relatively unaffected by irradiation from the white dwarf (see section 3.5).
We can compare these limits to empirical estimates of the absolute z′
-band magnitudes of low-mass stars and brown dwarfs in order to estimate the spectral type of the companion. Absolute J-band magnitudes for field brown dwarfs from Dupuy & Liu (2012) were combined with the ob-served SDSS and infrared colours from Hawley et al. (2002) to compute the expected absolute z′-band magnitudes of
field objects. We took account of the scatter in all measured quantities to provide a range of expected absolutez′
-band magnitudes at each spectral type. The results are shown in Figure 6. The lack of a robust detection of companion in the z′-band at mid-eclipse sets a 99 percent upper limit to the
0.0200 0.0225 0.0250 0.0275
R1
/a
0.20 0.25 0.30 0.35
U
0.10 0.11 0.12 0.13
R2
/a
85 86 87 88
i
0.0364 0.0366 0.0368 0.0370
F1
0.00000 0.00015 0.00030 0.00045 0.00060
F2
0.06 0.12 0.18 0.24 0.30
q
0.00030 0.00024 0.00018 0.00012
φ0
0.0200 0.0225 0.0250 0.0275
R1/a
0.20 0.25 0.30 0.35
U
0.10 0.11 0.12 0.13
R2/a
85 86 87 88
i
0.0364 0.0366 0.0368 0.0370
F1
0.000000.000150.000300.000450.00060
F2
0.000300.000240.000180.00012
[image:7.612.49.537.59.561.2]φ0
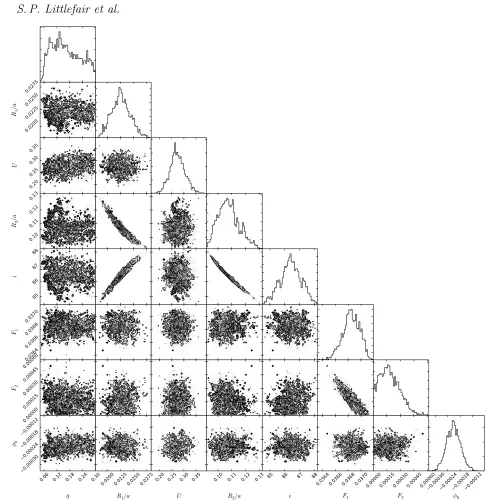
Figure 5. Posterior probability distributions for model parameters obtained through fitting thez′-band primary eclipse of SDSS J1411. See section 3.3 for details of model. Greyscales and contours illustrate the joint probability distributions for each pair of parameters, whilst histograms show the marginalised probability distribution for each individual parameter.
spectral type of L8 or later. This estimate is entirely model independent, and rules out a main sequence companion in SDSS J1411.
3.4 Eclipse Times
Mid-eclipse times for each eclipse were determined by fitting the model described in section 3.3 to each z′-band eclipse
individually. All parameters were held fixed at the best fit values derived from the averagez′
lightcurve, with the ex-ception of the phase offsetφ0. Mid-eclipse times are shown in Table 1. Variations in the times of mid-eclipse have been used to infer the existence of planets in white dwarf binaries
(see Beuermann et al. 2010; Marsh et al. 2014, for exam-ples); our eclipse times show no deviation from the linear ephemeris of B13.
3.5 NIR photometry
10
4Wavelength (
◦A
)
10
-1Flux (mJy)
[image:8.612.79.541.85.379.2]L4
L6
T0
T5
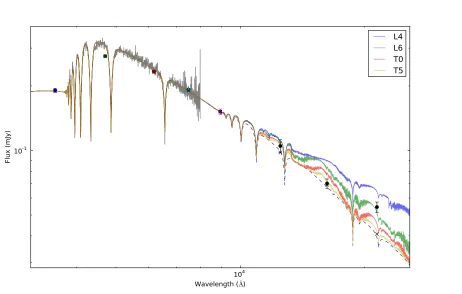
Figure 7. Comparison of selected white dwarf + brown dwarf models to the spectral energy distribution (SED) of SDSS J1411 (see section 3.5 for details). Combined white dwarf + brown dwarf models are shown from top to bottom with spectral types L4, L6, T0 and T5. The SDSS spectrum is shown in grey, whilst coloured points show the SDSS photometry. Our best fitting white dwarf model to the SDSS photometry and X-Shooter spectra is shown as a dashed blue line, whilst crosses mark the synthetic photometry computed by folding this model through the appropriate filter responses. The SDSS spectrum has been scaled by a fifth order polynomial to account for uncertainties in flux calibration. Black points show the WHT/LIRIS JHK photometry.
0.000 0.025 0.050 0.075 0.100 0.125 0.150 0.175
Flux (mJy)
0.04 0.02 0.00 0.02 0.04
Orbital Phase 0.015
0.000 0.015
Residuals (mJy)
Figure 4. The SDSS-z′primary eclipse of SDSS J1411, together with the best-fit model. All data are shown in this light curve, which has been averaged into 205 bins. A dashed line indicates
zero flux. The best-fit model hasχ2
= 3352 with 2481 degrees of freedom.
white dwarf model fit to give a Ks excess of 0.014±0.004 mJy. Combining this estimate with the distance and extinc-tion from the white dwarf fitting implies an absolute K s-band magnitude ofKs= 12.9±0.3. This value is compared
M6 M8 L0 L2 L4 L6 L8 T0 T2
Spectral Type 12
14
16
18
20
Absolute z-band magnitude
[image:8.612.43.264.477.644.2]99% 95% Best Fit
Figure 6. Comparison of the absolutez′-band magnitude of the companion in SDSS J1411 with empirical estimates of the
ab-solutez′-band magnitude of low mass stars and brown dwarfs.
The greyscale shows the expected distribution of absolute z′
-band magnitudes (see section 3.3 for details). The solid line shows
the most likely absolutez′-band magnitude for the companion in
[image:8.612.315.525.477.644.2]L1 L2 L3 L4 L5 L6 L7 L8 L9 T0 T1 T2 T3 T4 Spectral Type
10
11
12
13
14
[image:9.612.49.265.71.265.2]Absolute K-band magnitude
Figure 8. Comparison of the absoluteKs-band magnitude of
the companion in SDSS J1411 with empirical estimates of the
absoluteKs-band magnitude of low mass stars and brown dwarfs.
The red shaded area shows the expected distribution of absolute
Ks-band magnitudes (see section 3.5 for details). The black solid
line shows the most likely absoluteKs-band magnitude for the
companion in SDSS J1411, whilst black dashed lines show the 1σ
limits.
to the absolute Ks-band magnitudes of field brown dwarfs and low-mass stars from Dupuy & Liu (2012) in Figure 8. Taking into account the uncertainty in our measurements, and the scatter around the mean absolute magnitude mea-sured by Dupuy & Liu (2012) at each spectral type, implies a spectral type in the range L7–T1, and rules out spectral types earlier than L6, consistent with the limits placed by thez′
-band eclipse.
Also shown in Figure 7 are illustrative combined white dwarf/brown dwarf models produced as follows. For a given spectral type, the spectral-type effective-temperature rela-tions of Stephens et al. (2009) are used to calculate an ef-fective temperature. This is used in combination with an as-sumed system age of five Gyr and the evolutionary models of Baraffe et al. (2003) to calculate a radius and loggfor the companion. The radius is combined with the distance from white dwarf fitting to scale a BT-Settl model spectrum (Al-lard, Homeier & Freytag 2011) of appropriate temperature and gravity. The flux from the white dwarf and brown dwarf model spectra are added to produce a combined model spec-trum. Once again, comparison of these model spectra to the NIR photometry suggests a late spectral type for the com-panion. Note that the NIR photometric points represent av-erages of the brightness over a wide range of orbital phases (see Table 1 for details). Whilst theJ and Ks magnitudes are consistent with a companion of spectral type L6, the H-band measurement is too faint, even for a comparison spectral type of T0. TheH-band measurement is consistent with a mid-T spectral type. It is quite possible that this is a result of irradiation of the companion by the much hotter, nearby white dwarf. The average phase of theJandKs-band measurements are 0.66 and 0.30, respectively. Hence these measurements contain significant contribution from the irra-diated face of the companion. By contrast, theH-band mea-surement is dominated by observations of the un-irradiated face of the companion, with an average phase of 0.96.
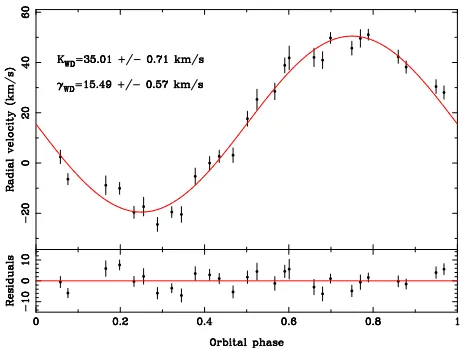
Time-Figure 9. The radial velocity curve of the white dwarf in SDSS
J1411, as measured from the NLTE core of the Hαline.
resolved NIR photometry on an 8-m class telescope would be useful to determine the influence of irradiation on the companion, which may introduce variability in flux of 10 percent or more (e.g. Sudarsky, Burrows & Hubeny 2003; Casewell et al. 2013, - see also section 4).
3.6 Radial Velocity of the White Dwarf
The NLTE-core of the Hαline in the X-Shooter spectrum provides a sharp feature which can be used to measure the radial velocity of the white dwarf. We measured the radial velocities of the Hαline by simultaneously fitting all of the X-Shooter spectra. We used a combination of a straight line and Gaussians for each spectrum (including a broad Gaus-sian component to account for the wings of the absorption) and allowed the position of the Gaussians to change velocity according to
V =γ1+K1sinφ,
whereφis the orbital phase, determined using the ephemeris of B13. The radial velocity curve of the white dwarf is shown in Figure 9. Our fit implies a radial velocity amplitude for the white dwarf ofK1 = 35.0±0.7 km s−1, and a systemic velocity for the white dwarf ofγ1= 15.5±0.6 km s−1. Note this systemic velocity does not represent the radial velocity of the binary centre of mass, due to the gravitational red-shift of the white dwarf. We use the constraints on the white dwarf mass and radius from section 3.1, to obtain a radial velocity for SDSS J1411 ofγ =−9±3 km s−1
. Combining the radial velocity with proper motions for SDSS J1411 (Gir-ven et al. 2011) and our distance estimate, we find Galactic space velocities relative to the local standard of rest (LSR) of (U, V, W) = (31±3,−13±3,13±3) km s−1
, with the sign of U being positive toward the Galactic anti-center. Following the method of Bensby, Feltzing & Oey (2014), we calculate
relativeprobabilities that SDSS J1411 belongs to the thin
[image:9.612.306.537.91.265.2]Parameter Most likely 1-σerror
(a) White dwarf parameters from SED fitting
T1(K) 13000 300
logg 7.86 0.07
M1(M⊙) 0.53 0.03
R1(R⊙) 0.0142 0.0006
tcool(Myr) 260 20
d(pc) 190 8
E(g−i) 0.05 0.01
(b) Fitted parameters fromg′-band eclipse
R1/a 0.0225 0.001
R2/a 0.107 0.005
i(◦) 86.5 0.4
(c) From X-Shooter spectroscopy
K1 (km s−1) 35.0 0.7
γ1(km s−1) 15.5 0.6
(d) Derived system parameters
M2(M⊙) 0.050 0.002
R2(R⊙) 0.072 0.004
a(R⊙) 0.68 0.01
γ(km s−1
[image:10.612.67.254.87.373.2]) -9 3
Table 2.System parameters for SDSS J1411.
3.7 System Parameters
We can use the constraints from the optical eclipses and X-Shooter spectroscopy to obtain (white-dwarf model de-pendent) masses and radii for both components in SDSS J1411 as follows. The radial velocity of the white dwarf can be used to construct the mass function of the system
P 2πGK1=
M3 2 (M1+M2)2
sin3i. (1)
Combining equation 1 with the estimate of the inclination from theg′-band eclipse and the estimate of the white dwarf
mass, allows the companion mass to be estimated. Kepler’s 3rd Law is used to calculate the binary separation a and hence convert the scaled companion radius,R2/a, to an ab-solute measurement. The resulting system parameters are shown in Table 2. Note that, due to redundancy in the pa-rameter constraints, we can calculate R1 either from the white dwarf spectrum and SED fitting, or by combining R1/afrom the light curve fitting with the value ofa found above. The two values are consistent within 1σ, giving us confidence in our results.
4 DISCUSSION
Both the lack of detection of the companion during thez′
-band eclipse and the NIR photometry place strong con-straints on the spectral type of the companion in SDSS J1411. We can rule out companions with spectral types ear-lier than L5, and the likely spectral type is between L7 and T1. Since the end of the stellar main sequence occurs at a spectral type somewhere in the range L2–L4 (Dieterich et al. 2014), our spectral type rules out any possibility of a
0.02 0.03 0.04 0.05 0.06 0.07
Mass (M⊙)
0.06 0.07 0.08 0.09 0.10
R
ad
iu
s (
R⊙
[image:10.612.310.525.99.264.2])
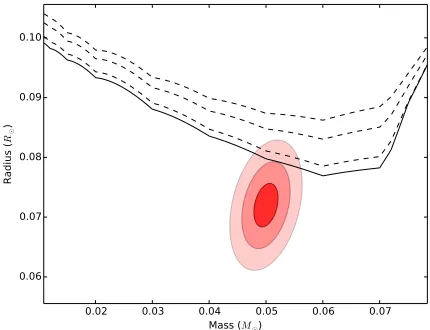
Figure 10. The mass and radius of the substellar companion in SDSS1411, compared to evolutionary models. The evolutionary models of Baraffe et al. (2003) are shown for solar metallicity and ages of 2, 3, 6 (dashed lines) and 9 Gyr (solid line). The 1-,
2-and 3-σ error ellipses for the mass and radius of the companion
are shaded in red.
stellar mass companion, confirming SDSS J1411 as the first detached, eclipsing white dwarf/brown dwarf binary.
The mass and radius constraints on the companion are shown in Figure 10. Also shown are evolutionary models, for solar metallicity, at a range of ages (Baraffe et al. 2003). If the evolutionary models are correct at these masses, then the relatively small radius for the brown dwarf favours an age in excess of three Gyr for SDSS1411. Given the uncertainty in the system age, the measured radius is consistent with the evolutionary models.
Since our measured companion mass and radius both depend on the white dwarf mass, which is itself model-dependent, we discuss the accuracy of the white dwarf mass estimate. There is some evidence that spectroscopically de-termined white dwarf masses can be in error. For example, estimates of the average white dwarf mass from gravitational redshift measurements are up to 0.06M⊙higher than
spec-troscopic determinations (Falcon et al. 2010). An increase of 0.06M⊙in our white dwarf mass would increase the
com-panion mass and radius by 1-σ, suggesting systematic uncer-tainties of the same size as our formal errors. Spectroscopic white dwarf masses can also depend on whether 1-D or 3-D models are used. However, adopting the corrections sug-gested by Tremblay et al. (2013) for this dependence makes little difference to our adopted white dwarf mass. A mea-surement of the companion’s radial velocity would allow a model independent mass to be derived, removing these un-certainties.
The inferred companion mass is interesting in the light of the measuredKs-band excess. TheKs-band data suggests an absolute magnitude ofKs = 12.9±0.3, and a spectral type between L7 and T1. By contrast, at five Gyr, the evo-lutionary models of Baraffe et al. (2003) suggest a 0.05M⊙
not suffer from this, since during primary eclipse we are viewing the un-irradiated hemisphere. Although we do not have a robust detection, ourz′-band eclipse suggests a most
likely absolute magnitude of z′
= 18.0. By folding a BT-Settl model atmosphere of appropriate temperature through the SDSS z′
-band filter response, we can estimate that a 0.05M⊙companion at five Gyr should havez′= 18.2, which
is not too far from our most likely value.
A rough estimate of the increase in temperature of the irradiated hemisphere can be given by
T24,irr=T 4 2 +T
4 1(R
2 1/2a
2
)(1−AB), (2)
where AB is the Bond albedo. Adopting a Bond albedo of
∼ 0.5 (Marley et al. 1999) and a temperature for the un-irradiated hemisphere of 1000 K (corresponding roughly to a spectral type of T7), suggests the irradiated hemisphere of SDSS 1411 should have an equilibrium temperature around 1400 K. This would correspond to a spectral type near L8, in line with ourKs-band measurements. Therefore our data suggests that the companion in SDSS J1411 has a significant temperature difference between hemispheres, as a result of irradiation by the white dwarf.
5 CONCLUSIONS
We present high time resolution optical light curves of the primary eclipse in SDSS J1411, together with time-resolved X-Shooter spectroscopy and near-infrared JHKs photom-etry. The X-Shooter spectrum implies the white dwarf in SDSS J1411 has effective temperatureT1= 13000±300 K, logg= 7.86±0.07 and a radial velocity ofK1 = 35.0±0.7 km s−1
. Fitting white dwarf cooling models to the SDSS photometry with the temperature and gravity as constraints provides an estimate of the distance to SDSS J1411 of d= 190±8 pc, and suggests the white dwarf has a mass of 0.53±0.03M⊙.
We did not detect the light from the companion during thez′-band eclipse. This sets an upper limit to the spectral
type of the companion of L5. Comparing the NIR photom-etry to the expected white dwarf flux reveals a significant Ks-band excess, suggesting a spectral type in the range L7– T1, although this may be dominated by emission from the warm, irradiated hemisphere of the companion.
Combining the white dwarf mass and radial velocity with the scaled radius and inclination constraints from the eclipse light curves allows a (white-dwarf model depen-dent) mass and radius to be measured for the companion ofMc= 0.050±0.002M⊙and Rc= 0.072±0.004M⊙,
re-spectively. The radius measurement is consistent with the predictions of evolutionary models, and suggests a system age in excess of three Gyr. The low companion mass is in-consistent with the inferred spectral type of L7–T1, instead predicting a spectral type nearer T5. This indicates that irradiation of the companion in SDSS J1411 could be caus-ing a significant temperature increase, at least on one hemi-sphere of the companion.
6 ACKNOWLEDGEMENTS
The authors thank D. Koester for kindly providing his white dwarf model spectra, and T. Naylor for useful discussions.
VSD, SPL and ULTRACAM are supported by STFC grant ST/J001589/1. TRM and SC are supported by STFC grant ST/L000733/1. TRM and MCP acknowledge the support of the International Exchange Scheme from the Royal Astro-nomical Society (grant number IE120385). SGP acknowl-edges financial support from FONDECYT in the form of grant number 3140585. SLC acknowledges the support of the College of Science and Engineering at the University of Le-icester. SB is supported by the Foundation for Fundamental Research on Matter (FOM), which is part of the Netherlands Organisation for Scientific Research (NWO). The results presented in this paper are based on observations collected at the European Southern Observatory under the large pro-gramme ID 192.D-0270. The results presented in this paper are based on observations made with the William Herschel Telescope operated on the island of La Palma by the Isaac Newton Group in the Spanish Observatorio del Roque de los Muchachos of the Instituto de Astrofisica de Canarias. This research has made use of NASA’s Astrophysics Data System Bibliographic Services and the SIMBAD data base, operated at CDS, Strasbourg, France.
REFERENCES
Allard F., Homeier D., Freytag B., 2011, in Astronomical Society of the Pacific Conference Series, Vol. 448, 16th Cambridge Workshop on Cool Stars, Stellar Systems, and the Sun, Johns-Krull C., Browning M. K., West A. A., eds., p. 91
Baraffe I., Chabrier G., Barman T. S., Allard F., Hauschildt P. H., 2003, A&A, 402, 701
Bensby T., Feltzing S., Oey M. S., 2014, A&A, 562, A71 Beuermann K. et al., 2013, A&A, 558, A96
Beuermann K. et al., 2010, A&A, 521, L60
Cardelli J. A., Clayton G. C., Mathis J. S., 1989, ApJ, 345, 245
Casewell S. L., Burleigh M. R., Lawrie K. A., Maxted P. F. L., Dobbie P. D., Napiwotzki R., 2013, Mem. Soc. Astron. Italiana, 84, 1022
Casewell S. L., Dobbie P. D., Napiwotzki R., Burleigh M. R., Barstow M. A., Jameson R. F., 2009, MNRAS, 395, 1795
Catal´an S., Isern J., Garc´ıa-Berro E., Ribas I., 2008, MN-RAS, 387, 1693
Dhillon V. S. et al., 2007, MNRAS, 378, 825
Dieterich S. B., Henry T. J., Jao W.-C., Winters J. G., Hosey A. D., Riedel A. R., Subasavage J. P., 2014, AJ, 147, 94
D’Odorico S. et al., 2006, in Proc. SPIE, Vol. 6269, p. 98 Drake A. J. et al., 2010, ArXiv e-prints
Dupuy T. J., Liu M. C., 2012, ApJS, 201, 19 Eisenstein D. J. et al., 2006, ApJS, 167, 40
Falcon R. E., Winget D. E., Montgomery M. H., Williams K. A., 2010, ApJ, 712, 585
Feline W. J., Dhillon V. S., Marsh T. R., Brinkworth C. S., 2004, MNRAS, 355, 1
Foreman-Mackey D., Hogg D. W., Lang D., Goodman J., 2013, PASP, 125, 306
Girardi L., Bressan A., Bertelli G., Chiosi C., 2000, A&AS, 141, 371
Girven J., G¨ansicke B. T., Steeghs D., Koester D., 2011, MNRAS, 417, 1210
Hawley S. L. et al., 2002, AJ, 123, 3409 Holberg J. B., Bergeron P., 2006, AJ, 132, 1221
Kausch W. et al., 2014, in Astronomical Society of the Pa-cific Conference Series, Vol. 485, Astronomical Society of the Pacific Conference Series, Manset N., Forshay P., eds., p. 403
Kleinman S. J. et al., 2013, ApJS, 204, 5
Koester D., 2010, Mem. Soc. Astron. Italiana, 81, 921 Marley M. S., Gelino C., Stephens D., Lunine J. I.,
Freed-man R., 1999, ApJ, 513, 879
Marsh T. R. et al., 2014, MNRAS, 437, 475
Napiwotzki R., Green P. J., Saffer R. A., 1999, ApJ, 517, 399
Parsons S. G. et al., 2012a, MNRAS, 426, 1950 Parsons S. G. et al., 2012b, MNRAS, 420, 3281
Parsons S. G., Marsh T. R., G¨ansicke B. T., Schreiber M. R., Bours M. C. P., Dhillon V. S., Littlefair S. P., 2013, MNRAS, 436, 241
Salaris M., Serenelli A., Weiss A., Miller Bertolami M., 2009, ApJ, 692, 1013
Stephens D. C. et al., 2009, ApJ, 702, 154
Sudarsky D., Burrows A., Hubeny I., 2003, ApJ, 588, 1121 Tremblay P.-E., Ludwig H.-G., Steffen M., Freytag B.,
2013, A&A, 559, A104