This is a repository copy of Effect of Relative Density on Settlements above Tunnels in Sands.
White Rose Research Online URL for this paper: http://eprints.whiterose.ac.uk/123389/
Version: Accepted Version
Proceedings Paper:
Zhou, B, Marshall, AM and Yu, H-S (2014) Effect of Relative Density on Settlements above Tunnels in Sands. In: Tunneling and Underground Construction. GeoShanghai
International Conference 2014, 26-28 May 2014, Shanghai, China. American Society of Civil Engineers , pp. 96-105. ISBN 9780784413449
https://doi.org/10.1061/9780784413449.010
© 2014, ASCE. This material may be downloaded for personal use only. Any other use requires prior permission of the American Society of Civil Engineers. This material may be found at https://doi.org/10.1061/9780784413449.010. Uploaded in accordance with the publisher's self-archiving policy.
[email protected] https://eprints.whiterose.ac.uk/
Reuse
Items deposited in White Rose Research Online are protected by copyright, with all rights reserved unless indicated otherwise. They may be downloaded and/or printed for private study, or other acts as permitted by national copyright laws. The publisher or other rights holders may allow further reproduction and re-use of the full text version. This is indicated by the licence information on the White Rose Research Online record for the item.
Takedown
If you consider content in White Rose Research Online to be in breach of UK law, please notify us by
The Effect of Relative Density on Settlements above Tunnels in Sands
Bo Zhou1, Alec. M. Marshall2 and Hai-Sui Yu3, FREng
1
Ph.D Student, Department of Civil Engineering, University of Nottingham, Nottingham, NG7 2RD, UK; [email protected]
2
Lecturer, Department of Civil Engineering, University of Nottingham, Nottingham, NG7 2RD, UK; [email protected]
3
Professor, Department of Civil Engineering, University of Nottingham, Nottingham, NG7 2RD, UK; [email protected]
ABSTRACT: This paper presents centrifuge experiment data related to the problem of tunnelling-induced ground displacements in sand. The paper focuses on the examination of the effect that relative density has on greenfield soil displacements above tunnels in sandy ground. Data from a series of plane strain centrifuge tests on tunnels in silica sand are presented. The relative density of the sand ranged from 50% to 90% in the tests. The soil displacement data were obtained using an imaged-based deformation measurement technique and examined to determine features of greenfield settlement, both surface and subsurface. The effect that relative density has on the settlement trough shape is demonstrated and discussed.
INTRODUCTION
Underground tunnelling causes stress relief in the surrounding soil and results in ground movement. To evaluate potential detrimental effects on nearby structures and infrastructure, it is important to understand the characteristics of these displacements, both magnitude and shape.
stresses and behaviour are replicated within small-scale models with controlled boundary conditions and soil characteristics.
The transverse settlement trough was first described using the Gaussian distribution curve by Martos (1958) and Peck (1969). Many subsequent authors have shown that the Gaussian distribution curve fits well to the transverse settlement trough, especially for undrained clays (Bowers et al. 1996; Grant and Taylor 2000). In sandy ground, the Gaussian curve does not tend to fit transverse settlement data as well as in clays (Marshall 2009; Farrell 2010). A modified Gaussian curve suggested by Vorster et al. (2005) can be used to obtain a better fit to observed tunnelling-induced settlement in sands. Marshall et al. (2012) showed that the settlement trough shape in sands is a function of tunnel size and depth as well as the magnitude of tunnel volume loss and proposed an empirical relationship for predicting settlement trough shape in sands based on the modified Gaussian curve.
The studies conducted to date have not considered the effect of soil density on tunnelling induced ground displacements in sands. The results presented in Marshall et al. (2012) only considered dense sands with a relative density of 90%. This paper presents experimental data which illustrates the effect that sand density has on the shape of the settlement trough in sands. The data was obtained from a series of experiments conducted on the University of Nottingham Centre for Geomechanics (NCG) geotechnical centrifuge (Ellis et al. 2006).
The paper is composed of five sections. Firstly, the design of the centrifuge model is presented. This is followed by a description of the methods used to measure soil displacement, an overview of the centrifuge tests that were conducted, and presentation of results. The paper finishes with some concluding remarks.
EXPERIMENTAL EQUIPMENT
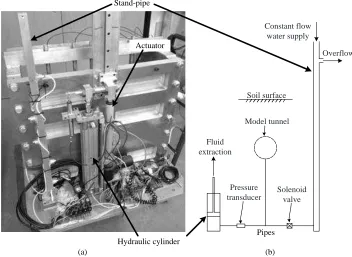
A 1/80th scale centrifuge model was designed and manufactured (Fig. 1). A model tunnel was placed within the plane-strain strong box filled with a dry fine-grained silica sand. The model tunnel consists of a rigid hollow aluminium cylinder sealed within a latex rubber membrane and filled with water. During a centrifuge test, the model was spun to 80 times gravity (80 g). An actuator which controlled the piston of a water-filled hydraulic cylinder (the cylinder was connected to the water within the model tunnel, Fig. 2) was used to extract the water within the model tunnel. The water pressure in the model tunnel was monitored with a pressure transducer.
The strong box has plan dimensions of 640×260 mm and can accommodate a maximum height of soil of 500 mm. The box comprises a stainless steel U-section with front and back walls made of Perspex and aluminium, respectively. The front wall was made of 100 mm thick Perspex to allow subsurface displacements in the soil to be measured using cameras and digital image analysis techniques (GeoPIV, see White et al., 2003). A recess was cut into the inner face of the Perspex wall to accommodate one end of the model tunnel. The container was designed so that the ends of the model tunnel could be sealed to the walls of the strong box. This was done to allow for future tests with saturated soils (the tests reported here used dry sand).
maximum lateral deflection of the walls when filled with saturated dense sand was estimated to be 0.3 mm, which is less than 0.1% of the sand height, as suggested by Taylor (1995) to ensure minimal effect on lateral earth pressures.
[image:4.612.132.484.326.527.2]Fig. 1 (b) illustrates the cross-section of model tunnel. The outside diameter of the model tunnel is 90 mm, which at 80 g corresponds to a prototype tunnel of 7.2 m diameter. The tunnel consists of a hollow inner cylinder with enlarged ends covered by a latex sleeve. The annulus space between the inner cylinder and the latex sleeve was filled with water and sealed with O-rings at the enlarged ends. During the test, the water was extracted in order to replicate the volume loss of a tunnel. The diameter of the inner cylinder is 70 mm, thus providing more than 30% potential volume loss. The tunnel was designed as a downward eccentric cylinder to fit expected ground deformation patterns around shallow tunnels (Loganathan and Poulos 1998). Additional fitting rings were secured to the enlarged ends of the tunnel to ensure a water tight seal both within the tunnel and at the tunnel-wall interfaces. The inner edges of the enlarged ends of the tunnel are set slightly inside the box walls in order to minimise any effect that the curvature of the membrane (due to its minimal stiffness) might have on obtaining plane-strain displacements at the walls.
Fig. 1. Centrifuge model: (a) front of centrifuge package; (b) cross-section of strong box and model tunnel.
Fig. 2 illustrates the volume loss system developed for the centrifuge model. During centrifuge spin-up, to prevent the trapped air within the water in the model tunnel being compressed at high g-levels and causing unwanted volume loss of the tunnel, the model tunnel was connected by pipes to a constant-head stand-pipe. This system kept the water pressure in the model tunnel equal to the pressure of the stand-pipe during spin-up and ensured that any volume loss due to air compression was accounted for by the constant-head supply. The height of the overflow in the stand-pipe was set to provide a water pressure equal the estimated soil overburden pressure
(a) (b)
Model tunnel
Fitting ring Latex membrane
Stopper ring Inner cylinder
End plate Perspex window
Back wall
Fluid Soil surface
Model tunnel
PIV cameras PIV Control
at the tunnel axis (which was adjusted for different tests). During a test, the model was first spun to 80 g with the tunnel connected to the stand-pipe. At 80 g, the solenoid valve was used to close the connection from the stand-pipe to the model tunnel. The linear actuator was then used to raise the piston of the hydraulic cylinder in order to extract water from the model tunnel. The stroke of the linear actuator and piston are both 300 mm and the internal diameter of the cylinder is 50 mm. The system can provide a volume loss of up to 35%. During tests, the pressure sensor was used to monitor the water pressure in the model tunnel as volume loss was taking place.
Fig. 2. Volume loss system: (a) the components at the back of strong box; (b) system sketch.
DISPLACEMENT MEASUREMENT
The main data obtained from these tests were measurements of surface and subsurface soil displacements. Digital images were taken of the soil through the Perspex wall throughout the tests and image analysis (GeoPIV) was performed to determine soil displacements. This method works by first using particle image velocimetry (PIV) to track the movement of patches of pixels/soil (identified by mapping pixel intensities) through a series of images. Close-range photogrammetry is then used to convert displacements in terms of pixels into a measurement of distance. This step requires that control markers are painted on the inner face of the Perspex window.
Stand-pipe
Hydraulic cylinder Actuator
Pipes
(a) (b)
Constant flow water supply
Overflow
Solenoid valve Model tunnel
Soil surface
Pressure transducer Fluid
In this project, two cameras were used to capture images of the sand behind the Perspex window. The two image areas overlapped so the displacement results from the two cameras could be merged together. The cameras focused on the sand above the model tunnel. A mixture of dyed and un-dyed sand was placed just behind the Perspex window to enhance the texture of the soil and therefore improve the image analysis results. A set of lights were positioned carefully around the front of the box to minimise reflections within the Perspex (which can hinder the image analysis).
Marshall (2009) indicated that the friction between the soil and Perspex reduced soil displacements by 10%-15% compared to tests using glass. This error was observed to be less at soil surface, presumably due to lower confining pressure. Additionally, Marshall et al. (2009) used the discrete element method (DEM) to model a centrifuge test with frictionless and frictional box walls. The simulation results indicated that wall friction tends to have a slight widening effect on the shape of the settlement trough.
CENTRIFUGE TESTS
The soil used in the tests was Leighton Buzzard Fraction E silica sand from David Ball Group plc, which has been used extensively for physical model testing in the UK. The sand has a typical average diameter, D50, of 122 m and a specific gravity of 2.67. The minimum and maximum void ratios are 0.64 and 0.97, respectively. The unit weight of the soil was varied within the tests.
The scale effects should be considered for tunnel modelling in the centrifuge. The relative size of any structural entity buried within the soil to that of the average grain size should be maximised in order to reduce scale effects. Kutter et al. (1994) investigated the collapse of craters in sands using centrifuge testing and determined that the ratio of crater diameter to average grain size should be greater than 350, and preferably as large as 1000. Marshall (2009) suggested that the data presented by Kutter et al. (1994) showed minimal grain size effect after a ratio of 500. For the tests presented here, the ratio of tunnel diameter to average grain size is 738. Grain size effects should therefore be minimal.
The data from three centrifuge tests are reported in this paper, with relative density (Id) values of 90%, 70% and 50% (Test 90, Test 70, Test 50). The sand was prepared using the sand pouring method. For each sample preparation, the height and flow rate of sand pouring were calibrated for the target relative density. Due to the orientation of the model tunnel across the strong box, the sands could not be poured from the top of the box. Consequently, the box and model tunnel were placed Perspex face down and the sand was poured in line with the tunnel. The back wall of the box was removed and a temporary wooden top was placed to prevent sands escaping from the open top. Small tins were put beside the box to check the homogeneity of the poured sand; these showed a variation of ± 3% in relative density. The Cover-to-Diameter ratio (C/D) of all the tests was 2, thus the depth from surface to the tunnel crown was 180 mm.
During the centrifuge spin-up, the increasing stress in sand caused the densification. For loss sand (Id = 50%), from 1 g to 80 g, the average relative density increased by 0.96% (calculated by PIV data). The effects should be minimal.
RESULTS
Underground excavation inevitably causes shear strains within the surrounding ground. The shear strain can lead to dilation or contraction in drained soils, depending on the magnitude of strains and the characteristics of the soil. The complex variability of shearing within sands above tunnels leads to difficulty in determining the variation of ground loss within the soil as well as the shape of the settlement trough (Marshall et al. 2012). In addition, the relationship between shear and volumetric strain are a function of soil type, confining stress, and relative density. This section presents data from three centrifuge experiments in which the only variable that was varied was the relative density of the sand: loose Id = 50%, medium dense Id = 70% and dense Id = 90%.
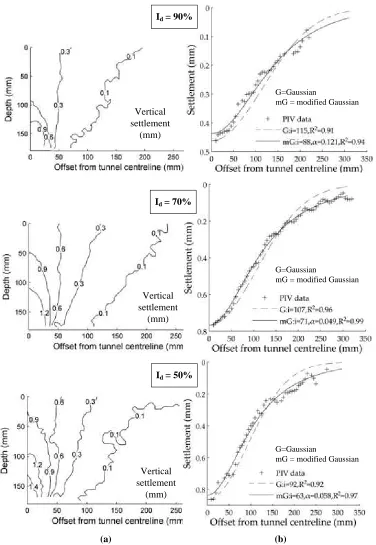
Fig. 3 (a) presents the contours of vertical displacement from the ground surface to the tunnel crown at a tunnel volume loss, Vl,t = 3% for the three tests. A large displacement is localized above the tunnel. The settlements in sands of initial Id = 50% and 70% are significantly higher than that of Id = 90% as well as settlement of Id = 50% is relatively higher than that of Id = 70%. Moreover, the major settlements (those between 0.3 and 1 mm) are mostly in the area between ± 100 mm offset from tunnel centreline; the settlements outside of this area are quite small (around 0.1 mm and lower).
The transverse settlement trough is generally described as a Gaussian distribution curve (Eq. 1).
(1)
where Sv is the vertical settlement at a horizontal distance (x) from the tunnel centreline, Smax is the maximum settlement at the tunnel centreline, and i is the distance from the tunnel centreline to the inflexion point of the settlement trough (also sometimes used to describe the trough width). Using the Gaussian curve, the settlement trough can be defined by the two variables Smax and i.
To obtain a better fit to settlements in sands, a modified Gaussian curve was suggested by Vorster et al. (2005) (Eq. 2).
(2)
Fig. 3. Settlements in three tests when Vl,t = 3%: (a) vertical displacements; (b)
fitting curves to settlement data at ground surface.
Id = 90%
Id = 50%
(a) (b)
Id = 70%
Vertical settlement
(mm) Vertical settlement
(mm) Vertical settlement
(mm)
G=Gaussian
mG = modified Gaussian G=Gaussian
mG = modified Gaussian G=Gaussian
Fig. 3 (b) shows the Gaussian and modified Gaussian curves fitted to the settlement data at the ground surface at Vl,t = 3% for the three centrifuge tests. The evaluation of quality of fit is based on the coefficient of determination, R2 (values closer to 1 indicate a better fit). The modified Gaussian curve is shown to provide a better fit to the displacement data.
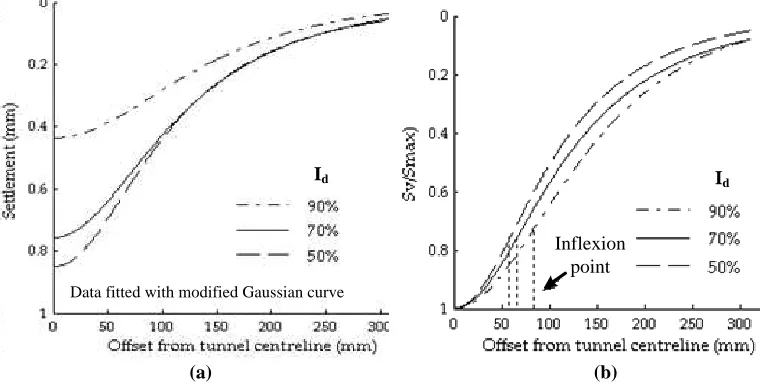
The example at Vl,t = 3% in Fig. 4 (a) shows that the settlements at the surface in Test 50 and Test 70 are significantly higher than that in Test 90. The settlement of Test 50 is also greater than that of Test 70. In sands, the volume loss experienced by the soil, Vl,s (= area of settlement trough of soil divided by initial cross-sectional area of tunnel), is not equal to the volume loss of tunnel, Vl,t, because of the volumetric changes that occur in the soil. The area of the settlement curve was calculated to determine Vl,s. When Vl,t = 3%, the value of Vl,s in Test 90 was lower than 3%, so the dense sands were in a state of dilation generally. In comparison, the value of Vl,s in Test 50 were more than 3%, so the loose soil was in an overall state of contraction.
[image:9.612.123.503.426.621.2]Fig 4 (b) shows the settlement trough normalised by the maximum settlement at the tunnel centreline. The settlement trough is narrower in looser sands. The through width, as described by i, decreases with Id; from 88 mm, 71 mm to 63mm (calculated in fitting modified Gaussian distribution curves in Fig. 3). The lower trough width causes a larger hogging and sagging curvature of the ground; meaning that the curvature is greatest in loose sands. The curvature of the greenfield settlement profile will impact on the bending strains within buried infrastructure, such as pipelines (Marshall et al. 2010). Based on these results, there is scope for further studies regarding the effect of sand density on the ground-structure interaction problem due to underground excavations.
Fig. 4. Comparison of (a) settlement and (b) normalised settlement troughs with Id (at surface, Vl,t = 3%).
CONCLUSIONS
Id
Id
Inflexion point
(a) (b)
The paper presented new experimental equipment developed for modelling tunnel construction using the University of Nottingham Centre for Geomechanics geotechnical centrifuge. A series of tests was undertaken to investigate the effect of relative density on displacements above the tunnels in sands. The relative density was found to affect the magnitude and shape of ground settlements. The following conclusions can be drawn:
(1) The modified Gaussian curve provided a better fit to the settlement data compared to the Gaussian curve.
(2) The magnitudes of settlement at the ground surface decreased with an increase in the relative density of the sand.
(3) The shape of the settlement trough was narrower in looser sands; i.e. the trough width decreased with a decrease in relative density.
The results of this research can have implication to the evaluation of the effect of tunnelling on buried infrastructure.
REFERENCES
Bowers, K.H., Miller, D.M. and New, B.M. (1996). “Ground movement over three years at the Heathrow Express Trial Tunnel.” Geotechnical aspects of underground construction in soft ground, R.J. Mair and R.N. Taylor, eds., Balkema, Rotterdam, 647–652.
Ellis, E.A., Cox, C., Yu, H.S., Ainsworth, A., and Baker, N. (2006). “A new
geotechnical centrifuge at the University of Nottingham, UK.” Physical Modelling in Geotechnics - 6th ICPMG ’06, C.W.W. Ng, L.M. Zhang, and Y.H. Wang, eds., Hong Kong, 129–133.
Farrell, R. (2010). “Tunnelling in sands and the response of buildings.” Ph.D.thesis,
Cambridge University, Cambridge, U.K.
Grant, R.J. and Taylor, R.N. (2000). “Tunnelling-induced ground movements in clay.” Proceedings of the Institution of Civil Engineers, Geotechnical Engineering, 143(1), 43-55.
Kutter, B., Chang, J., and Davis, B. (1994). “Collapse of cavities in sand and particle size effects.” In Centrifuge ’94: Proceedings of the international conference, C.F. Leung, F. Lee, and T. Tan, eds., Balkema, Singapore, 809-815.
Loganathan, N. and Poulos, H.G. (1998). “Analytical prediction for tunneling
-induced ground movements in clays.” Journal of Geotechnical and Geoenvironmental Engineering, 124(9), 846–856.
Mair, R.J., Taylor, R.N. & Bracegirdle, A. (1993). “Subsurface settlement profiles
above tunnels in clays.” Geotechnique, 43(2), 315–320.
Marshall, A. (2009). Tunnelling in sands and its effect on pipes and piles. Ph.D.thesis, Cambridge University, Cambridge, U.K.
Marshall, A.M., Klar, A., and Mair, R. (2010). “Tunneling beneath buried pipes – a
view of soil strain and its effect on pipeline behavior.” Journal of Geotechnical and Geoenvironmental Engineering, 136(12), 1664–1672.
Marshall, A.M., Farrell, R.P., Klar, A., and Mair, R.J. (2012). “Tunnels in sands – the
effect of size, depth, and volume loss on greenfield displacements.” Geotechnique, 62(5), 385–399.
Martos, F. (1958). “Concerning an approximate equation of the subsidence trough
and its time factors.” International Strata Control Congress, 6, 191–205.
O’Reilly, M.P. & New, B.M. (1982). “Settlements above tunnels in the United Kingdom: their magnitude and prediction”. Proceedings of Tunnelling ’82, Brighton, 173–181.
Peck, R.B. (1969). “Deep excavations and tunnelling in soft ground.” Proceedings of the 7th International Conference on Soil Mechanics and Foundation Engineering, Mexico City, 225–290.
Taylor, R.N. (1995). Geotechnical centrifuge technology, Blackie, London, 129–133. Vorster, T.E.B., Klar, A., Soga, K., and Mair, R.J. (2005). “Estimating the effects of
tunnelling on existing pipelines.” Journal of Geotechnical and Geoenvironmental Engineering, 131(11), 1399–1410.