Sequencing
Collin Timm, Fulya Akpinar, John Yin
Department of Chemical and Biological Engineering, Systems Biology Theme, Wisconsin Institute for Discovery, University of Wisconsin—Madison, Madison, Wisconsin, USA
ABSTRACT
Populations of RNA viruses can spontaneously produce variants that differ in genome size, sequence, and biological activity.
Defective variants that lack essential genes can nevertheless reproduce by coinfecting cells with viable virus, a process that
inter-feres with virus growth. How such defective interfering particles (DIPs) change in abundance and biological activity within a
virus population is not known. Here, a prototype RNA virus, vesicular stomatitis virus (VSV), was cultured for three passages on
BHK host cells, and passages were subjected to Illumina sequencing. Reads from the initial population, when aligned to the
full-length viral sequence (11,161 nucleotides [nt]), distributed uniformly across the genome. However, during passages two plateaus
in read counts appeared toward the 5
=
end of the negative-sense viral genome. Analysis by normalization and a simple
sliding-window approach revealed plateau boundaries that suggested the emergence and enrichment of at least two truncated species
having medium (
⬃
5,900 nt) and short (
⬃
4,000 nt) genomes. Relative measures of full-length and truncated species based on
read counts were validated by quantitative reverse transcription-PCR (qRT-PCR). Limit-of-detection analysis suggests that deep
sequencing can be more sensitive than complementary measures for detecting and quantifying defective particles in a
popula-tion. Further, particle counts from transmission electron microscopy, coupled with infectivity assays, linked the rise in smaller
genomes with an increase in truncated particles and interference activity. In summary, variation in deep sequencing coverage
simultaneously shows the size, location, and relative level of truncated-genome variants, revealing a level of population
hetero-geneity that is masked by other measures of viral genomes and particles.
IMPORTANCE
We show how deep sequencing can be used to characterize the emergence, diversity, and relative abundance of truncated virus
variants in virus populations. Adaptation of this approach to natural isolates may elucidate factors that influence the stability
and persistence of virus populations in nature.
D
efective interfering particles (DIPs) are truncated forms of
viruses that emerge during viral infections. DIPs cannot
rep-licate on their own, but upon coinfection with intact virus, they
can divert the viral replication machinery to make defective
ge-nomes and particles, ultimately at the expense of intact virus
pro-duction (
1
,
2
). In culture, DIPs have been observed for most
classes of DNA and RNA viruses (
2–4
). In nature, DIPs have been
discovered in an outbreak of influenza A virus in chickens (
5
) and
in West Nile virus isolates from avian hosts (
6
). In human hosts,
clinical isolates from patients infected with dengue virus (
7
) and
influenza A virus (
8
) provide evidence that DIPs and their
ge-nomes can be transmitted between patients.
DIPs have been characterized by their genome length and
se-quences (
9–13
), their particle sizes and morphologies (
14–18
),
and their biological activities (
19
,
20
). Few studies have combined
genome, particle, and activity measurements of mixed DIP and
virus populations (
21
,
22
), though such measures can be useful for
guiding computational models that aim to elucidate how such
populations may grow, change, and be transmitted (
23–26
). To
advance models that not only elucidate but also enable forecasting
of how virus populations grow and spread, new measures that
facilitate the rapid quantitative characterization of viruses and
their DIPs will need to be developed.
High-throughput (deep) sequencing has been widely used to
characterize the diversity of virus variants in natural infections as
well as their sequence level adaptations to antiviral drugs (
27–35
).
Deep sequencing has also revealed central roles for DIPs derived
from influenza A, Sendai, measles, and parainfluenza 5 viruses in
binding to the cellular pathogen recognition receptor retinoic
acid-inducible gene I (RIG-I) as an initial step toward establishing an
an-tiviral state within the host cell (
36–38
). In deep sequencing of viral
RNA, the samples of genomes or subgenomes are reverse transcribed,
amplified, and sequenced. When these reads are aligned to a reference
genome, their match to a region on the reference genome (coverage)
can approximate the level of that region in the analyzed genome
pop-ulation (
37
). In this way, deep sequencing can potentially be used to
identify genome or subgenomic sizes, sequences, and relative levels
within a biological sample.
Here we employed Illumina sequencing to track the emergence
and enrichment of truncated genomic templates during serial
transfer culture of the nonsegmented negative-sense RNA virus
vesicular stomatitis virus (VSV), a prototypical virus for the study
Received17 September 2013Accepted9 December 2013
Published ahead of print18 December 2013
Editor:D. S. Lyles
Address correspondence to John Yin, [email protected].
C.T. and F.A. contributed equally to this work.
Copyright © 2014, American Society for Microbiology. All Rights Reserved.
doi:10.1128/JVI.02675-13
on November 7, 2019 by guest
http://jvi.asm.org/
of DIPs (
2
,
20
,
23
,
39
). Extents of template coverage by deep
se-quencing revealed changing relative levels of genomic and
sub-genomic templates that correlated with the emergence DIPs.
Moreover, deep sequencing of the populations revealed variation
in the genome position, size, and relative levels of subgenomic
species, features of the virus populations that are not readily
de-tected by quantitative reverse transcription-PCR (qRT-PCR) or
particle size measures.
MATERIALS AND METHODS
Cell culture.Baby hamster kidney (BHK-21) cells were maintained in 10% fetal bovine serum (FBS; Atlanta Biologicals)–1% Glutamax I (Gibco) in Ea-gle’s minimum essential medium (MEM; CellGro). Cells were passaged every 2 or 3 days when they reached confluence. For virus passaging infections, cells were plated in a T-75 flask, grown for 1 day, and then infected.
Preparation of viral passages at fixed MOI.Viral passages were pre-pared by serial infection of BHK-21 cells at fixed multiplicity of infection (MOI) (20). For virus passaging, we used the N1 virus arrangement (40), which has all genes from the San Juan isolate of the Indiana vesicular stomatitis virus (VSV) strain except the G protein, which originated from the Orsay isolate of the Indiana strain. Sequencing of our strain revealed eight fixed mutations, which were likely accumulated during passaging of the original strain. Viral infections were performed in 2% FBS (50 ml; Atlanta Biologicals)–1% GlutaMAX (5 ml; LifeTechnologies/Invitrogen) in MEM (500 ml; Gibco). BHK-21 cells were grown to 90% confluence and infected at an MOI of 10. Virus was adsorbed for 1 h at 37°C. Cells were rinsed with Dulbecco’s phosphate-buffered saline (DPBS; Gibco), and 10 ml me-dium was added. The viral infection was allowed to progress for 24 h, and the supernatant containing virus particles was centrifuged (300⫻g) to remove cell debris. Samples were stored at⫺80°C until analysis. Based on a prelimi-nary passaging experiment, viral yields were sharply reduced after three pas-sages, which is within the range reported in the literature (23,41). After the first MOI of 10 passage (P0), the populations were named P1 and then P2 and then P3. The virus titer after each passage was measured, and samples were diluted appropriately to sustain an MOI of 10.
Interference assay.DIP-mediated interference of infection in samples was quantified by the yield reduction assay (20). Prior to all infections, the cells were counted, enabling control of the MOI and quantification of virus and DIP yields on a per-cell basis. Serial dilutions of samples (1:10 or 1:2) were performed and then used to initiate infections. After 1 h of adsorption, stock virus was added at an MOI of 20, allowed to adsorb for 1 h, rinsed with DPBS, and replaced with MEM containing 2% FBS. In-fections were incubated for 24 h and stored at⫺80°C until quantification by plaque assay. The plaque assay results were used to calculate the inter-fering unit concentration as previously described (20).
RNA extraction.Viral RNA was collected using the Qiagen Viral RNA extraction kit according to the manufacturer’s instructions, except that carrier RNA was not added to the lysis buffer. Carrier RNA would inter-fere with downstream sequencing. The VSV-associated RNAs were ex-tracted from a full lineage including two technical replicates on superna-tant from P3 (P0, P1, P2, P3, and P3b).
Construction of RNA-Seq libraries.Viral RNA was submitted to the University of Wisconsin—Madison Biotechnology Center for quality control testing (Qubit Fluorometer and Agilent 2100 BioAnalyzer for quantity and integrity verification, respectively) and transcriptome se-quencing (RNA-Seq) library preparation. Each library was generated us-ing Illumina’s guide,Preparing Samples for Sequencing of mRNA (Rev. A), and the Illumina mRNA-seq 8 sample preparation kit (Illumina Inc., San Diego, CA, USA) with minimal modification. To create the libraries, each viral RNA sample was fragmented into small pieces using divalent cations under elevated temperature and ethanol precipitated. Each mRNA pellet was suspended in 11.1l RNase-free water. Double-stranded cDNAs were synthesized using SuperScript II (Invitrogen, Carlsbad, CA, USA) and random primers for first-strand cDNA synthesis followed by second-strand synthesis using DNA Polymerase I and RNase H for removal of
mRNA. Double-stranded cDNA was purified using QIAquick PCR Puri-fication columns (Qiagen, Valencia, CA, USA). cDNAs were end repaired by T4 DNA polymerase and Klenow DNA Polymerase and phosphory-lated by T4 polynucleotide kinase. The blunt-ended cDNA was purified using QIAquick PCR Purification columns. The cDNA products were incubated with Klenow DNA Polymerase to add an A base (adenine) to the 3=end of the blunt phosphorylated DNA fragments and then purified using MinElute PCR Purification columns (Qiagen). DNA fragments were ligated to Illumina adapters, which have a single T base (thymine) over-hang at their 3=end. The adapter-ligated products were purified using Min-Elute PCR Purification columns. Products of the ligation reaction were puri-fied by gel electrophoresis using 2% SizeSelect agarose gels (Invitrogen, Carlsbad, CA, USA) targeting 225- and 300-bp fragments. cDNA products were PCR amplified with Phusion DNA Polymerase using Illumina’s genomic DNA primer set and purified using QIAquick PCR Purification columns. Quality and quantity of the finished libraries were assessed using an Agilent DNA HS series chip assay (Agilent Technologies, Santa Clara, CA, USA) and QuantIT PicoGreen dsDNA kit (Invitrogen, Carlsbad, CA, USA), respectively, and libraries were standardized to 10M. Cluster generation was performed using standard Cluster kits (v2) and the Illumina Cluster Sta-tion, with each sample placed in a single lane. A single-read, 36-bp run was performed, using standard 36-bp sequencing by synthesis (SBS) kits (v3) and SCS 2.4 software, on an Illumina Genome Analyzer IIx. Images were analyzed using the standard Illumina Pipeline, version 1.4.
Sequence alignment and P0 consensus determination.Sequence alignment andde novosequence identification were performed in the CLCBio Genomics Workbench using default settings. To generate a P0 consensus sequence, the reads from P0 were initially aligned to a pub-lished VSV sequence (NCBI Reference SequenceNC_001560.1). We ex-tracted the consensus of P0 and used it as a reference to determine cover-age in P0, P1, P2, P3, and P3b. The second alignment had an increased number of reads compared to the first.
Quantification and analysis of coverage data.The sequence coverage was extracted from CLCBio, and analysis was performed in MATLAB. The coverage in each passage was normalized by dividing the coverage at each base by its corresponding coverage in P0. Following normalization, locations of plateau boundaries were estimated by defining local mean coverage, systematically applying these measures across the genome, and identifying where significant changes occurred. More specifically, 400-nucleotide-long windows, centered at every 5 nucleotides along the ge-nome, were expanded toward the 3=or 5=end of the genome by 10 nucle-otides. Mean coverages for each window before and after expansion were compared by thettest. When the means were found to be significantly different (␣ ⫽10⫺11), the added bases were recorded as potential plateau boundaries. The frequency of bases recorded as potential boundaries was plotted as a histogram with a bin size of 100 nucleotides. The bases iden-tified as boundary more than 100 times were chosen as plateau boundar-ies. After plateau locations were determined, we calculated the averages and standard deviations over the entire range of each plateau and used those values to determine population fractions. Confidence intervals for population fractions were calculated using propagation of uncertainty.
qRT-PCR.Viral RNA was extracted from cell culture supernatant us-ing the QIAAmp Viral RNA Minikit (Qiagen) accordus-ing to the manufac-turer’s instructions. Reverse transcription was performed with VSV ge-nome-specific primer (see below) using the GoScript reverse transcriptase (Promega, Madison, WI, USA) according to the manufacturer’s instruc-tions. qPCR was performed with a forward primer and reverse primer (see below) from RT reaction using the SsoFast Supermix (Bio-Rad, Hercules, CA, USA) on a C1000 thermal cycler (Bio-Rad) according to the manu-facturer’s instructions with an annealing temperature of 62.5°C for all primer sets. A purified plasmid containing the VSV genome was used as a known standard to determine the numbers of copies per ml. Primers and the reverse transcription protocol were optimized to determine the linear range of detection using serial dilutions of extracted viral genomes. Lin-earity at the determined detection range was preserved for all four virus Timm et al.
on November 7, 2019 by guest
http://jvi.asm.org/
populations (P0 to P3), showing specificity of primers to full-length neg-ative-sense genomes. Test samples were diluted when necessary to be within the linear range of detection. The primer sequences for full-length genomes spanned the NP gene junction with sequences CAGTCATGTC ACTGCAAGGCCTAA and TACCGCCTGATCCAGACGAGAATA. The medium-length genomes were detected with primers TGCTGTCTCTGA GGTGGAATTGCT and AAGCTGGGAACCCTAATCCTGCAT. The short genomes were detected in the L region of the genome with CAGCC TTGGGAAAGGGAAAGCAAA and AACCTATGAAGGGCAGACCCT GTT. All primers were synthesized by Integrated DNA Technologies (Coralville, IA, USA) and were resuspended in RNase-free water.
Particle quantification by TEM.The virus samples were mixed with a NIST Traceable size standard (115 nm in diameter, 109particles/ml) in a 1:1 ratio. The prepared mixture was diluted 1:1 with methylamine tung-state (Nanoprobes), and a drop was loaded on a Pioloform (polyvinyl butyral)-coated grid. The sample was then imaged using a transmission electron microscope (TEM; CM120; Philips). For each sample, 15 TEM images were acquired, and VSV particles and microspheres were counted and averaged (approximately 100 particles per sample per grid). The VSV particle concentration was estimated relative to the concentration of NIST Traceable size standard beads.
LOD calculations.The statistical limit of detection (LOD) for genome deletion mutants was determined by measuring the mean () and stan-dard deviation () across a given window size and then solving for LOD in the equation
tcrit⫽
LOD⫺
兹
nat a confidence limit␣of 0.001 andn⫽(window size⫺1). All coverages were extracted from P1 raw coverage or coverage normalized to P0.
The empirical limit of detection of genome deletion mutants was cal-culated by comparing fractions measured by sequencing to fractions mea-sured by all complementary measures. A trendline was fitted through all data points to determine slope and intercept. The limit of detection was
calculated by determining thex-intercept (predicted sequence measure when other measures are zero).
Nucleotide sequence accession numbers.The GenBank accession numbers for genome sequences determined in this study areKF935251
for the passage 0 (P0) virus andKF935252for thede novodefective inter-fering particle (DIP) from passage 3 (P3).
RESULTS
Deep sequencing can detect differential coverage profiles in
re-lated populations.
Vesicular stomatitis virus was cultured at a
multiplicity of infection (MOI) of 10 PFU/cell on baby hamster
kidney cells (BHK-21) for three passages (P1, P2, and P3), starting
with an initial population (P0), as shown in
Fig. 1A
. RNA
ex-tracted from supernatants of each passage was sequenced using
Illumina technology with 35-bp-long reads. All samples contained
reads that mapped to the initial passage zero (P0) VSV consensus
sequence (
Table 1
). Unmapped reads could not be directly
attrib-uted to the host (Syrian golden hamster) for which a genomic
sequence is not yet available. However,
de novo
alignment on all
reads from passages showed multiple contigs that aligned to rRNA
of other species, including Chinese hamster (data not shown).
[image:3.585.74.509.70.310.2]FIG 1Experimental setup for serial passage culture of VSV and raw coverage data. (A) VSV was passaged at an MOI of 10 for three passages to promote amplification of defective interfering particles. (B) Deep sequencing coverage (yaxis) across the viral genome (xaxis) is plotted for each passage. The genome is from 3=to 5=, with base 1 representing the first base on the 3=end. The coverage profile of the P3 sequencing replicate is plotted as a gray line.
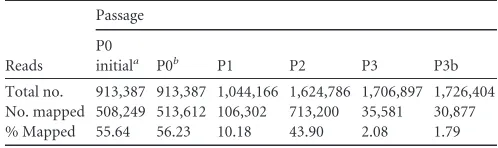
TABLE 1Read mapping statistics
Reads
Passage
P0
initiala P0b P1 P2 P3 P3b
Total no. 913,387 913,387 1,044,166 1,624,786 1,706,897 1,726,404 No. mapped 508,249 513,612 106,302 713,200 35,581 30,877 % Mapped 55.64 56.23 10.18 43.90 2.08 1.79
a
P0 aligned to the VSV reference genome.
bP0 aligned to the consensus of P0 initial.
on November 7, 2019 by guest
http://jvi.asm.org/
[image:3.585.296.545.633.707.2]In our initial alignment of P0 to the VSV Indiana reference, 55.6%
(508,249 of 913,387) of the total reads were mapped to the viral
ge-nome. When the extracted consensus of this alignment was used as
the reference, the mapped reads increased to 56.2%. For each passage,
total reads of 9
⫻
10
5to 1.7
⫻
10
6were obtained, with a maximum of
56% and a minimum of 1.8% for later passages mapping to the P0
consensus. Details of the mapping by passage are in
Table 1
.
Base-by-base coverages for each of the 11,161 nucleotide
posi-tions of the VSV genome mapped to the P0 consensus, as shown in
Fig. 1B
, and the coverage for P0 exhibited a relatively flat profile
across the VSV genome. A sharp drop in coverage of P0 between
bases 1622 and 1625 is attributed to zero coverage at those four
bases. In passage 2, different plateaus of coverage appeared, with
5- to 10-fold-lower coverage toward the 3
=
end than toward the 5
=
end. By passage 3, these differences were enhanced with 100-fold
differences in coverage between the lowest and highest plateaus.
The coverage profile of the technical replicates of P3 showed a
good agreement, highlighting the reproducibility of sequencing.
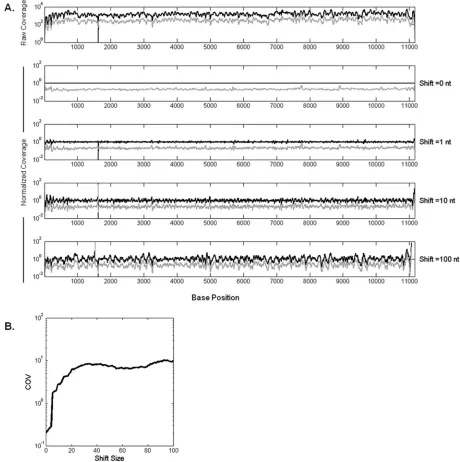
Normalizing coverage to the initial population coverage
re-duced the noise in coverage profiles.
To test whether fluctuations
in coverage at the base level reflected sequence-dependent biases,
we normalized the number of reads at each base in P1 by its
cor-responding value in P0, as shown in
Fig. 2A
. As an unbiased
con-trol, we also normalized P1 to shifted P0, where P0 coverage was
FIG 2Normalization by P0 coverage reduces variability. P1 coverage values are divided into P0 coverages at the corresponding positions shifted by an offset. (A) Normalized P0 (black curve) and P1 (gray curve) coverages with increasing offset from top to bottom. Thexaxis represents the nucleotide positions on the VSV genome. (B) As the reference P0 coverages are shifted by a higher offset, the noise in data increases, which can be seen in the increase of coefficient of variance (COV; calculated as the standard deviation of normalized coverages divided by the coverage mean across genome) of P1. The COV approaches its maximum after about 30 bases. Timm et al.
on November 7, 2019 by guest
http://jvi.asm.org/
[image:4.585.60.520.69.531.2]offset by a fixed number of nucleotide positions prior to
normal-ization. Normalization of P1 by P0 (offset
⫽
0) significantly
reduced the bias (
Fig. 2A
), while increasing the offset produced
similar fluctuations when P1 or P0 was normalized by P0 (offset
⫽
100 nt), suggesting coverage bias due to sequence similarity
be-tween P1 and P0.
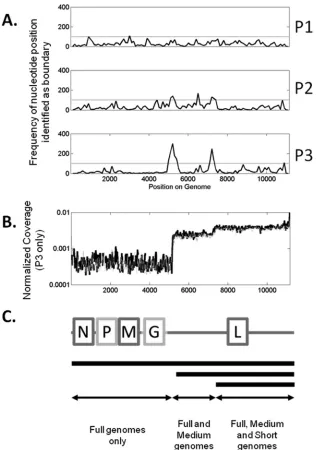
Coverage analysis reveals two distinct genome deletion
mu-tants in the population.
Different coverage plateaus suggested the
formation and enrichment of truncated genomes associated with
defective particles in the virus population. Boundaries of the
pla-teaus, estimated as described in Materials and Methods, highlight
a 100-nucleotide-long window centered at position 5250, a second
window 100 nucleotides long around position 6450, and finally a
200-nucleotide-long window centered at position 7200 (
Fig. 3A
).
The boundaries at positions 5250 and 7200 occurred in both P2
and P3. However, the boundary at 6450 appeared only in P2.
Therefore, we focused on conserved boundaries at positions 5250
and 7200, corresponding to defective genomes with lengths of
5,900 and 4,000 nucleotides (
Fig. 3C
). Analysis of the coverage
profile from P1 showed no detectable changes in coverage.
De novo
read assembly suggests a genome deletion mutant.
Using
de novo
read assembly algorithms available in CLC
Genom-ics Workbench (CLC bio, Denmark), 8 to 20 contigs were
ob-tained at each passage. One of the contigs in P3 was a
6,025-nucleotide sequence containing the 5
=
end of the VSV genome,
including most of the L gene (
Fig. 4
). The 3
=
end was
complemen-tary to the 5
=
end across a 33-nucleotide-long section, as
previ-ously observed for other DI particles (
12
). This
de novo
sequence is
FIG 3Determination of plateau boundaries and population fractions. (A) Frequency data showing bases recorded as boundaries using the algorithm described in Materials and Methods. The horizontal line is at 100 counts. (B) Normalized coverage data for P3. (C) Representation of VSV genome and genome deletion mutants that contribute to coverage levels.
on November 7, 2019 by guest
http://jvi.asm.org/
[image:5.585.135.451.65.515.2]likely a DI genome and corresponds to additional coverage in P2
and P3 as described above. However, we were unable to find by
de
novo
alignment evidence for a
⬃
4,000-nt length species (short
DIP) corresponding to the high coverage at the 3
=
end.
Relative coverage levels were used to quantify population
fractions of full-length and genome deletion mutants.
The
emergence of different plateaus (
Fig. 5A
) is consistent with the
enrichment of two truncated-genome populations, one of
me-dium length (5,911 nucleotides) and the other of shorter length
(3,961 nucleotides). Relative levels of each species were estimated
by normalized average read coverages across each of three regions
(bases 1 to 5250, 5251 to 7200, and 7201 to 11161), and this
aver-age was used to calculate population fractions. In
Fig. 5B
, the
larger pie charts represent the fractions of full-length genomes
FIG 4Genome deletion mutant detected byde novoalignment has complementary ends and similarity to full-length virus. The first base of the genome deletion lines up with base 5116 of the parental genome (P0). There is a short segment where there is no alignment, followed by a long stretch of perfect match. Finally, the DIP sequence aligns to the end but is truncated before the final base of the parent sequence.
FIG 5Comparison of all quantification techniques. (A) Coverage values from deep sequencing were normalized to the corresponding base in P0, ignoring any zero values. The technical replicate of the P3 sample is shown as the gray curve. (B to E) Population fractions are calculated for each method. The black segment corresponds to full-size species, and the gray in the large pie represents all defective particles. In panels B and C, a second pie chart shows the fractions of medium and short genomes in the defective population of P2 and P3. Values reported are percentages of population⫾standard deviations. (B) Fraction calculated from sequencing coverage. The standard deviation was calculated by coverage noise and propagation of uncertainty. (C) Fractions determined by qRT-PCR (n⫽3). (D) Fraction calculated from TEM images (n⫽2,⬃100 particles/grid). (E) Fractions calculated from PFU and interfering units measured by plaque and interference assays (n⫽3).
Timm et al.
on November 7, 2019 by guest
http://jvi.asm.org/
[image:6.585.135.450.65.167.2] [image:6.585.61.518.309.664.2](black) and truncated genomes (gray), and the smaller pie
charts show how the truncated genomes were distributed
be-tween short genomes (light gray) and medium-length genomes
(dark gray). Over the course of three passages, the fraction of
species carrying full-length genomes declined as the species
carrying the shorter length genome emerged to become the
dominant species (
Fig. 5B
).
Complementary measures agree with quantification by
rela-tive coverage.
We employed qRT-PCR, TEM, and activity assays
(plaque and yield reduction assays) as complementary measures
of how the virus populations changed with passage. A qRT-PCR
assay was designed to measure the relative abundance for genomic
species corresponding to each plateau region, with primer sets
targeting the M mRNA region of the full-length genome, the
me-dium-length species, and the L mRNA region associated with the
shortest subgenomic species. To compare levels of truncated and
full-length genomes estimated from sequencing with an
indepen-dent measure, we normalized all qRT-PCR values to their
mea-sures in P0, which served as our base case pure population of
full-length genomes.
Figure 5C
shows the distribution of the
ge-nome population measured by qRT-PCR. The qRT-PCR results
were consistent with estimates from sequencing in P2 and P3.
Measures of relative abundance for genomic species from the
same locations in P1 did not show a significant change in levels
between locations.
TEM of populations enabled visualization and approximation
of relative levels of full-size and truncated virus particles. Here,
truncated particles were treated as a single class, without
attempt-ing to distattempt-inguish between ones carryattempt-ing medium-length or short
genomes. The fraction of truncated VSV particles relative to
full-size particles increased with passage (
Fig. 5D
), consistent with the
overall trend observed by sequencing and qRT-PCR. However,
the rate of enrichment of truncated particles appeared to lag
be-hind the genomic measures, potentially reflecting the uncertainty
in distinguishing particles that carry full-sized versus
medium-length genomes.
Over the course of the three passages, levels of infectious virus
declined more than 5,000-fold, suggesting that the emergence of
DIPs interfered with infectious virus production. Measures of
in-terference activity by the yield reduction assay indicated a
signifi-cant rise in interfering units. These infection and interference
re-sults were combined to provide estimates of DIP fractions, which
increased with passage, consistent with genome and particle
mea-sures (
Fig. 5E
).
The correlation between virus population distributions
ob-tained by deep sequencing and genome, particle, and activity
dis-tributions highlights the accuracy of deep sequencing to quantify
virus population distributions and their dynamics. Moreover, the
similarity between genome and activity distributions suggests that
all intact genomes are infectious while all defective genomes are
interfering with infection. In order to test this, the absolute
parti-cle, genome, and activity levels were compared.
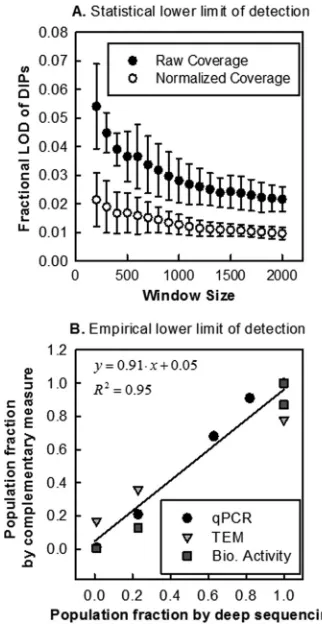
Quantification by relative coverage is limited by statistical
and empirical measurement noise.
In contrast to what was
ob-served with the P2 and P3 samples, we did not find evidence for
different coverages in the P1 sample. Assuming normally
distrib-uted noise, we calculated a statistical lower detection limit of
⬃
1.5% of additional reads attributed to genome deletion mutants
(
Fig. 6A
). As we increased the window size to the theoretical
op-timum value, we observed a correlated increase in the predicted
number of plateaus, which we attributed to a higher detection
sensitivity of deep sequencing. The empirical lower detection limit
in this analysis was determined as a 10% representation of genome
deletions (
Fig. 6B
), defined by the
x
-intercept and confidence
in-tervals of a linear fit between sequencing and complementary
measures. The discrepancy between statistical and empirical limits
can be attributed to inherent measurement variation of the
com-plementary measures (qRT-PCR, TEM, and biological activity),
nonnormally distributed noise in sequencing data, or the gradual
change (over tens to hundreds of bases) in coverage at the plateau
boundaries. Based on this analysis, a conservative estimate of the
limit of detection of deep sequencing is
⬃
10%. However, if one
accepts a trade-off between specificity and sensitivity, deep
se-quencing can be used to detect genome deletion mutants at lower
levels.
Absolute quantification of population shows correlation
be-tween genome structure and viral activity.
In addition to
mea-suring relative levels of different species with a population passage,
TEM and qRT-PCR measures allowed us to estimate the absolute
particle and genome concentrations in passaged samples, while
the plaque and interference assays provided infectious and
inter-ference measures. Concentrations of full-size particles, full-length
genomes, and infectious units were within a factor of 10 from P0
FIG 6Limit of detection calculated two ways. (A) The statistical limit of detection was calculated by determining detection levels (xaxis) at different window sizes (yaxis) for average coverages. Noise measure was calculated based on raw and normalized P1 data. (B) Population fractions from sequenc-ing (xaxis) and complementary measures (yaxis) were used to determine the lowest detectable level by sequencing by calculating thex-intercept for a best-fit line.
on November 7, 2019 by guest
http://jvi.asm.org/
[image:7.585.336.497.66.378.2]to P2 (
Fig. 7A
), and defective virus particles, truncated genomes,
and interference units were within a factor of 10 from P1 to P3, all
with a maximum at P2 (
Fig. 7B
). The level of infectious particles
followed an 8-fold-lower but parallel trend with full-length
ge-nome levels (
Fig. 7A
), and full-length particle levels dropped to a
lesser extent across passages than viral genomes and infectious
virus. This may suggest that some full-length particles contain
complete or mostly complete genomes that are not infectious. For
defective particles, there was greater agreement between particle,
genome, and activity levels (
Fig. 7B
), evidence that most defective
particles were able to interfere with infectious virus production.
Interestingly, following their initial appearance and amplification,
defective virus levels dropped from P2 to P3. Likewise, total virus
particle levels dropped from P2 to P3 after being stable from P0 to
P2 (
Fig. 7C
). These parallel drops in total and defective virus levels
reflect that DIPs can interfere with production of infectious virus
and thereby indirectly and adversely affect their own production.
Other studies (
27
,
32
,
42
) have observed a correlation between
absolute measure and mapped reads, but when we compared our
mapped reads with other absolute measures, we did not see a
correlation (not shown). Therefore, we were unable to use
mapped reads as an absolute measure of genomes in the
popula-tion.
DISCUSSION
Deep sequencing can reveal features of virus populations that are
currently masked by other measures. Here, sequencing reads
aligned to the viral genome exhibited plateaus in coverage that
spanned thousands of bases, providing novel evidence for the
si-multaneous emergence and enrichment of at least two distinct
truncated-genome variants of VSV. Previous studies have
corre-lated deep sequencing with measures by qRT-PCR and
microar-rays (
27
,
32
,
43–46
). Based on the observed plateau locations, we
selected primers for qRT-PCR measures that enabled us to
vali-date the estimated levels of the two variants, relative to the
full-length wild type, in the population. Further, analysis of TEM
im-ages confirmed a coexistence of truncated and full-sized particles,
corresponding to truncated and full-sized genomes, but TEM
es-timates were not of sufficiently high resolution to distinguish
more than one class of truncated particles. In addition, measures
of biological activity demonstrated the presence of both viable
virus and defective interfering activity, consistent with the
pres-ence of particles containing full-length and truncated genomes,
respectively. Such population level measures cannot currently
re-solve whether interference arises from one or more distinct classes
of truncated genomes.
The normalization of the coverage profile to that of initial
pop-ulation (P0) reduced the noise and allowed for the identification
of genomic subpopulations and the estimation of population
dis-tributions. The good correlation between virus population
distri-butions by sequencing and by other independent methods
high-lights that deep sequencing can accurately quantify the relative
levels of genomic variants. We were unable to detect the presence
of DIPs in P1 by deep sequencing, while TEM and interference
assays suggested their presence in P1 at a low level. Based on these
other measures, we determined that the lower detection limit of
deep sequencing to distinguish between two genome
subpopula-tions (intact and defective genomes) was about 10%. In short,
genome deletion mutants must comprise at least 10% of the
pop-ulation in order to be detectable based on sequence coverage.
The coverage changes between observed plateaus were not
dis-crete: the change occurred gradually over an
⬃
200-nt stretch of
the genome. This gradual change may be due to the presence of
multiple genome lengths of similar size, as observed in poliovirus
defective interfering particles (
47
,
48
). The existence of a
distribu-tion of lengths suggests that multiple defective particles may arise
in culture and become simultaneously enriched.
Differential sequencing coverage levels, compared to other
methods, allowed us to estimate an empirical limit of detection of
⬃
10% for truncated genomes in a sample. The theoretical limit of
detection was a function of window size in the plateau-finding
algorithm. For larger window sizes, the detection limit decreased,
and new peaks emerged, defining potential plateau boundaries
associated with additional genome deletion mutants in the
popu-FIG 7Absolute virus and DIP concentrations using different methods. Ge-nomes (full circle) were measured by qRT-PCR, particles (empty circle) were measured by TEM, and activity (triangle) was determined by plaque assay or interference assay. (A) Full-length genomes, particles, and infectious units decline at a similar rate. (B) Defective genomes, particles, and interfering units follow a similar trend. (C) Total genomes, particles, and activity follow similar trends.
Timm et al.
on November 7, 2019 by guest
http://jvi.asm.org/
[image:8.585.100.231.62.484.2]lation. Sampling with larger window sizes may enable deep
se-quencing measures to detect variants at lower levels, but this
ap-proach will need to be validated by more-sensitive measurements
than those currently employed.
It is important to distinguish that the relatively high detection
limit applies to overlapping genome sequences, while unique
se-quences in a population can be identified at even lower fractions,
as we observed full-length genomic segments in P3 at fractions of
⬃
1%. The quantitative levels of DIPs in natural samples have not
been reported, but genome deletion DIPs may be present at levels
of
⬍
10%, emphasizing the need for other quantification methods.
Methods of detection of DIPs in natural populations include
se-quencing of promoters or other conserved sequences (
8
), but
these have not provided quantitative population information. We
have shown that differences in sequencing coverage for
overlap-ping segments can reduce the effect of sequencing noise to provide
more-quantitative estimates of population fractions and
popula-tion changes during passaging.
We observed good agreement between biological activity and
physical particle measurements for early passages and greater
dis-agreement in later passages. However, the total particle counts
produced were relatively stable through P0, P1, and P2, lending
support to the idea that the total particle production (viable and
nonviable) is limited by a finite pool of host cellular resources (
49
,
50
). Future measures of intracellular viral and DIP components,
combined with mechanistic modeling (
50
), will enable
more-de-tailed assessments of resource use during coinfections. The drop
in total particle production seen in P3 can be attributed to the
ability of DIPs at high intracellular levels to interfere with their
own replication (
23
).
While deep sequencing has been used primarily to detect and
identify viral genome sequences, its ability to quantify the
popu-lation distributions has been in part limited because of the noise in
the coverage profiles. Here, we observed a similarity in the noise
patterns of related samples and found that normalizing coverage
measurements to a common ancestor reduced much of the
se-quence-dependent noise, allowing for unbiased species
identifica-tion and more-precise quantificaidentifica-tion. Such a normalizaidentifica-tion
strat-egy can be applied to reduce the noise in chronologically linked
biological samples, which may aid in the quantitative analysis of
the population dynamics.
ACKNOWLEDGMENTS
We thank Ming Yuan (University of Wisconsin—Madison) for helpful discussions. We thank the University of Wisconsin DNA Sequencing Fa-cility (UWBC) for their help in preparing and analyzing sequencing sam-ples. We also thank the University of Wisconsin Medical School Electron Microscope Facility.
We are grateful for support from the National Institutes of Health (AI071197). C.T. acknowledges support from the National Library of Medicine (training grant 5T15LM007359).
We declare that we have no conflicts of interest.
REFERENCES
1.Von Magnus P.1954. Incomplete forms of influenza virus. Adv. Virus Res.2:59 –79.
2.Huang AS, Baltimore D.1970. Defective viral particles and viral disease processes. Nature226:325–327.http://dx.doi.org/10.1038/226325a0. 3.Lazzarini RA, Keene JD, Schubert M.1981. The origins of defective
interfering particles of the negative-strand RNA viruses. Cell26:145–154.
http://dx.doi.org/10.1016/0092-8674(81)90298-1.
4.Roux L, Simon AE, Holland JJ.1991. Effects of defective interfering
viruses on virus replication and pathogenesis in vitro and in vivo. Adv. Virus Res.40:181–211.
5.Bean WJ, Kawaoka Y, Wood JM, Pearson JE, Webster RG. 1985. Characterization of virulent and avirulent A/chicken/Pennsylvania/83 in-fluenza A viruses: potential role of defective interfering RNAs in nature. J. Virol.54:151–160.
6.Pesko KN, Fitzpatrick KA, Ryan EM, Shi P-Y, Zhang B, Lennon NJ, Newman RM, Henn MR, Ebel GD.2012. Internally deleted WNV ge-nomes isolated from exotic birds in New Mexico: function in cells, mos-quitoes, and mice. Virology427:10 –17.http://dx.doi.org/10.1016/j.virol .2012.01.028.
7.Li D, Lott WB, Lowry K, Jones A, Thu HM, Aaskov J.2011. Defective interfering viral particles in acute dengue infections. PLoS One6:e19447.
http://dx.doi.org/10.1371/journal.pone.0019447.
8.Saira K, Lin X, DePasse JV, Halpin R, Twaddle A, Stockwell T, Angus B, Cozzi-Lepri A, Delfino M, Dugan V, Dwyer DE, Freiberg M, Horban A, Losso M, Lynfield R, Wentworth DN, Holmes EC, Davey R, Went-worth DE, Ghedin E. 2013. Sequence analysis of in vivo defective-interfering (DI)-like RNA of influenza A H1N1 pandemic virus. J. Virol.
87:8064 – 8074.http://dx.doi.org/10.1128/JVI.00240-13.
9.Epstein DA, Herman RC, Chien I, Lazzarini RA.1980. Defective inter-fering particle generated by internal deletion of the vesicular stomatitis virus genome. J. Virol.33:818 – 829.
10. Re GG, Gupta KC, Kingsbury DW.1983. Genomic and copy-back 3= termini in Sendai virus defective interfering RNA species. J. Virol.45:659 – 664.
11. Davis AR, Hiti AL, Nayak DP.1980. Influenza defective interfering viral RNA is formed by internal deletion of genomic RNA. Biochemistry77:
215–219.
12. Meier E, Harmison GG, Keene JD, Schubert M. 1984. Sites of copy choice replication involved in generation of vesicular stomatitis virus de-fective-interfering particle RNAs. J. Virol.51:515–521.
13. O’Hara PJ, Horodyski FM, Nichol ST, Holland JJ. 1984. Vesicular stomatitis virus mutants resistant to defective-interfering particles accu-mulate stable 5=-terminal and fewer 3=-terminal mutations in a stepwise manner. J. Virol.49:793–798.
14. Huang AS, Greenawalt JW, Wagner RR.1966. Defective T particles of vesicular stomatitis virus I. Preparation, morphology, and some biologic properties. Virology30:161–172.
15. Reichmann ME, Pringle CR, Follett EAC.1971. Defective particles in BHK cells infected with temperature-sensitive mutants of vesicular stoma-titis virus. J. Virol.8:154 –160.
16. Hartford SL.1975. Physical properties of New Jersey serotype of vesicular stomatitis virus and its defective particles. Proc. Natl. Acad. Sci. U. S. A.
72:1202–1205.http://dx.doi.org/10.1073/pnas.72.3.1202.
17. Nonoyama M, Watanabe Y, Graham AF.1970. Defective virions of reovirus. J. Virol.6:226 –236.
18. Petric M.1970. Vesicular stomatitis virus—a new interfering particle, intracellular structures and virus-specific RNA. Virology41:615– 630.
http://dx.doi.org/10.1016/0042-6822(70)90427-7.
19. Bellett AJD, Cooper PD.1959. Some properties of the transmissible interfering component of vesicular stomatitis virus preparations. Micro-biology21:498 –509.
20. Stauffer Thompson KA, Rempala GA, Yin J.2009. Multiple-hit inhibi-tion of infecinhibi-tion by defective interfering particles. J. Gen. Virol.90:888 – 899.http://dx.doi.org/10.1099/vir.0.005249-0.
21. Janda JM, Davis AR, Nayak DP, De BK.1979. Diversity and generation of defective interfering influenza virus particles. Virology95:48 –58.http: //dx.doi.org/10.1016/0042-6822(79)90400-8.
22. Marcus PI, Sekellick MJ.1974. Cell killing by viruses. I. Comparison of cell-killing, plaque-forming, and defective-interfering particles of vesicu-lar stomatitis virus. Virology57:321–338.
23. Thompson K, Yin J.2010. Population dynamics of an RNA virus and its defective interfering particles in passage cultures. Virol. J.7:257.http://dx .doi.org/10.1186/1743-422X-7-257.
24. Kirkwood TB, Bangham CR.1994. Cycles, chaos, and evolution in virus cultures: a model of defective interfering particles. Proc. Natl. Acad. Sci. U. S. A.91:8685– 8689.http://dx.doi.org/10.1073/pnas.91.18.8685. 25. Zwart M, Pijlman G, Sardanyés J, Duarte J, Januário C, Elena S.2013.
Complex dynamics of defective interfering baculoviruses during serial passage in insect cells. J. Biol. Phys.39:327–342.http://dx.doi.org/10.1007 /s10867-013-9317-9.
26. Ke R, Aaskov J, Holmes EC, Lloyd-Smith JO. 2013. Phylodynamic
on November 7, 2019 by guest
http://jvi.asm.org/
analysis of the emergence and epidemiological impact of transmissible defective dengue viruses. PLoS Pathog.9:e1003193.http://dx.doi.org/10 .1371/journal.ppat.1003193.
27. Tsibris AMN, Korber B, Arnaout R, Russ C, Lo C-C, Leitner T, Gaschen B, Theiler J, Paredes R, Su Z, Hughes MD, Gulick RM, Greaves W, Coakley E, Flexner C, Nusbaum C, Kuritzkes DR.2009. Quantitative deep sequencing reveals dynamic HIV-1 escape and large population shifts during CCR5 antagonist therapy in vivo. PLoS One4:e5683.http: //dx.doi.org/10.1371/journal.pone.0005683.
28. Bimber BN, Dudley DM, Lauck M, Becker EA, Chin EN, Lank SM, Grunenwald HL, Caruccio NC, Maffitt M, Wilson NA, Reed JS, Sosman JM, Tarosso LF, Sanabani S, Kallas EG, Hughes AL, O’Connor DH.
2010. Whole-genome characterization of human and simian immunode-ficiency virus intrahost diversity by ultradeep pyrosequencing. J. Virol.
84:12087–12092.http://dx.doi.org/10.1128/JVI.01378-10.
29. Nasu A, Marusawa H, Ueda Y, Nishijima N, Takahashi K, Osaki Y, Yamashita Y, Inokuma T, Tamada T, Fujiwara T, Sato F, Shimizu K, Chiba T.2011. Genetic heterogeneity of hepatitis C virus in association with antiviral therapy determined by ultra-deep sequencing. PLoS One
6:e24907.http://dx.doi.org/10.1371/journal.pone.0024907.
30. Verbinnen T, Van Marck H, Vandenbroucke I, Vijgen L, Claes M, Lin T-I, Simmen K, Neyts J, Fanning G, Lenz O.2010. Tracking the evolu-tion of multiple in vitro hepatitis C virus replicon variants under protease inhibitor selection pressure by 454 deep sequencing. J. Virol.84:11124 – 11133.http://dx.doi.org/10.1128/JVI.01217-10.
31. Kuroda M, Katano H, Nakajima N, Tobiume M, Ainai A, Sekizuka T, Hasegawa H, Tashiro M, Sasaki Y, Arakawa Y, Hata S, Watanabe M, Sata T.2010. Characterization of quasispecies of pandemic 2009 influenza A virus (A/H1N1/2009) by de novo sequencing using a next-generation DNA sequencer. PLoS One5:e10256.http://dx.doi.org/10.1371/journal .pone.0010256.
32. Greninger AL, Chen EC, Sittler T, Scheinerman A, Roubinian N, Yu G, Kim E, Pillai DR, Guyard C, Mazzulli T, Isa P, Arias CF, Hackett J, Schochetman G, Miller S, Tang P, Chiu CY. 2010. A metagenomic analysis of pandemic influenza A (2009 H1N1) infection in patients from North America. PLoS One5:e13381.http://dx.doi.org/10.1371/journal .pone.0013381.
33. Görzer I, Guelly C, Trajanoski S, Puchhammer-Stöckl E.2010. Deep sequencing reveals highly complex dynamics of human cytomegalovirus genotypes in transplant patients over time. J. Virol.84:7195–7203.http: //dx.doi.org/10.1128/JVI.00475-10.
34. Fischer W, Ganusov VV, Giorgi EE, Hraber PT, Keele BF, Leitner T, Han CS, Gleasner CD, Green L, Lo C-C, Nag A, Wallstrom TC, Wang S, McMichael AJ, Haynes BF, Hahn BH, Perelson AS, Borrow P, Shaw GM, Bhattacharya T, Korber BT.2010. Transmission of single HIV-1 genomes and dynamics of early immune escape revealed by ultra-deep sequencing. PLoS One5:e12303.http://dx.doi.org/10.1371/journal.pone .0012303.
35. Wright CF, Morelli MJ, Thébaud G, Knowles NJ, Herzyk P, Paton DJ, Haydon DT, King DP.2011. Beyond the consensus: dissecting within-host viral population diversity of foot-and-mouth disease virus by using next-generation genome sequencing. J. Virol.85:2266 –2275.http://dx .doi.org/10.1128/JVI.01396-10.
36. Komarova AV, Combredet C, Sismeiro O, Dillies M-A, Jagla B, Sanchez
David RY, Vabret N, Coppee J-Y, Vidalain P-O, Tangy F.2013. Iden-tification of RNA partners of viral proteins in infected cells. RNA Biol.
10:944 –957.http://dx.doi.org/10.4161/rna.24453.
37. Killip MJ, Young DF, Gatherer D, Ross CS, Short JAL, Davison AJ, Goodbourn S, Randall RE.2013. Deep sequencing analysis of defective genomes of parainfluenza virus 5 and their role in interferon induction. J. Virol.87:4798 – 4807.http://dx.doi.org/10.1128/JVI.03383-12.
38. Baum A, Sachidanandam R, García-Sastre A.2010. Preference of RIG-I for short viral RNA molecules in infected cells revealed by next-generation sequencing. Proc. Natl. Acad. Sci. U. S. A.107:16303–16308.http://dx.doi .org/10.1073/pnas.1005077107.
39. Holland JJ.1987. Defective interfering rhabdoviruses, p 297–360.In Wag-ner RR (ed), The rhabdoviruses. Springer, New York, NY.
40. Wertz GW, Perepelitsa VP, Ball L.1998. Gene rearrangement attenuates expression and lethality of a nonsegmented negative strand RNA virus. Proc. Natl. Acad. Sci. U. S. A.95:3501–3506.http://dx.doi.org/10.1073 /pnas.95.7.3501.
41. Stampfer M, Baltimore D, Huang AS.1971. Absence of interference during high-multiplicity infection by clonally purified vesicular stomatitis virus. J. Virol.7:409 – 411.
42. Mortazavi A, Williams BA, Mccue K, Schaeffer L, Wold B. 2008. Mapping and quantifying mammalian transcriptomes by RNA-Seq. Nat. Methods5:1– 8.http://dx.doi.org/10.1038/nmeth1153.
43. Bloom JS, Khan Z, Kruglyak L, Singh M, Caudy AA.2009. Measuring differential gene expression by short read sequencing: quantitative com-parison to 2-channel gene expression microarrays. BMC Genomics10:
221.http://dx.doi.org/10.1186/1471-2164-10-221.
44. Willenbrock H, Salomon J, Søkilde R, Barken KB, Hansen TN, Nielsen FC, Møller S, Litman T.2009. Quantitative miRNA expression analysis: comparing microarrays with next-generation sequencing. RNA15:2028 – 2034.http://dx.doi.org/10.1261/rna.1699809.
45. Camarena L, Bruno V, Euskirchen G, Poggio S, Snyder M. 2010. Molecular mechanisms of ethanol-induced pathogenesis revealed by RNA-sequencing. PLoS Pathog. 6:e1000834. http://dx.doi.org/10.1371 /journal.ppat.1000834.
46. Oliver HF, Orsi RH, Ponnala L, Keich U, Wang W, Sun Q, Cartinhour SW, Filiatrault MJ, Wiedmann M, Boor KJ.2009. Deep RNA sequencing of L. monocytogenes reveals overlapping and extensive stationary phase and sigma B-dependent transcriptomes, including multiple highly tran-scribed noncoding RNAs. BMC Genomics10:641.http://dx.doi.org/10 .1186/1471-2164-10-641.
47. Cole CN, Smoler D, Wimmer E, Baltimore D.1971. Defective interfer-ing particles of poliovirus. I. Isolation and physical properties. J. Virol.
7:478 – 485.
48. Kuge S, Saito I, Nomoto A.1986. Primary structure of poliovirus defec-tive-interfering particle genomes and possible generation mechanisms of the particles. J. Mol. Biol.192:473– 487.http://dx.doi.org/10.1016/0022 -2836(86)90270-6.
49. Turner PE, Chao L.1999. Prisoner’s dilemma in an RNA virus. Nature
398:441– 443.http://dx.doi.org/10.1038/18913.
50. Lim K, Lang T, Lam V, Yin J.2006. Model-based design of growth-attenuated viruses. PLoS Comput. Biol.2(9):e116.http://dx.doi.org/10 .1371/journal.pcbi.0020116.
Timm et al.
on November 7, 2019 by guest
http://jvi.asm.org/