eurostat
eurostat
STATISTISCHES AMT DER EUROPAISCHEN GEMEINSCHAFTEN STATISTICAL OFFICE OF THE EUROPEAN COMMUNITIES OFFICE STATISTIQUE DES COMMUNAUTÉS EUROPÉENNES
L-2920 Luxembourg — Tél. (352) 43 01-1 — T é l e x COMEUR LU 3423 B-1049 Bruxelles, rue de la Loi 200 — Tél. (32-2) 299 11 11
Eurostat hat die Aufgabe, den Informa-tionsbedarf der Kommission und aller am Aufbau des Binnenmarktes Beteiligten mit Hilfe des europäischen statistischen Systems zu decken.
Um der Öffentlichkeit die große Menge an verfügbaren Daten zugänglich zu machen und Benutzern die Orientierung zu erleichtern, werden zwei Arten von Publi-kationen angeboten: Statistische Doku-mente und Veröffentlichungen.
Statistische Dokumente sind für den Fachmann konzipiert und enthalten das ausführliche Datenmaterial: Bezugs-daten, bei denen die Konzepte allgemein bekannt, standardisiert und wissenschaft-lich fundiert sind. Diese Daten werden in einer sehr tiefen Gliederung dargeboten. Die Statistischen Dokumente wenden sich an Fachleute, die in der Lage sind, selbständig die benötigten Daten aus der Fülle des dargebotenen Materials auszu-wählen. Diese Daten sind in gedruckter Form und/oder auf Diskette, Magnet-band, CD-ROM verfügbar. Statistische Dokumente unterscheiden sich auch optisch von anderen Veröffentlichungen durch den mit einer stilisierten Graphik versehenen weißen Einband.
Veröffentlichungen wenden sich an eine ganz bestimmte Zielgruppe, wie zum Beispiel an den Bildungsbereich oder an Entscheidungsträger in Politik und Ver-waltung. Sie enthalten ausgewählte und auf die Bedürfnisse einer Zielgruppe abgestellte und kommentierte Informa-tionen. Eurostat übernimmt hier also eine Art Beraterrolle.
Für einen breiteren Benutzerkreis gibt Eurostat Jahrbücher und periodische Veröffentlichungen heraus. Diese enthal-ten statistische Ergebnisse für eine erste Analyse sowie Hinweise auf weiteres Datenmaterial für vertiefende Unter-suchungen. Diese Veröffentlichungen werden in gedruckter Form und in Daten-banken angeboten, die in Menütechnik zugänglich sind.
Um Benutzem die Datensuche zu erleich-tern, hat Eurostat Themenkreise, d. h. eine Untergliederung nach Sachgebieten, eingeführt. Daneben sind sowohl die Statistischen Dokumente als auch die Veröffentlichungen in bestimmte Reihen, wie zum Beispiel „Jahrbücher", „Kon-junktur", „Methoden", untergliedert, um den Zugriff auf die statistischen Informa-tionen zu erleichtem.
Y. Franchet Generaldirektor
It is Eurostat's responsibility to use the European statistical system to meet the requirements of the Commission and all parties involved in the development of the single market.
To ensure that the vast quantity of ac-cessible data is made widely available, and to help each user make proper use of this information, Eurostat has set up two main categories of document: statistical documents and publications.
The statistical document is aimed at spe-cialists and provides the most complete sets of data: reference data where the methodology is well-established, stand-ardized, uniform and scientific. These data are presented in great detail. The statistical document is intended for ex-perts who are capable of using their own means to seek out what they require. The information is provided on paper and/or on diskette, magnetictape, CD-ROM. The white cover sheet bears a stylized motif which distinguishes the statistical docu-ment from other publications.
The publications proper tend to be com-piled for a well-defined and targeted public, such as educational circles or political and administrative decision-makers. The information in these docu-ments is selected, sorted and annotated to suit the target public. In this instance, therefore, Eurostat works in an advisory capacity.
Where the readership is wider and less well-defined, Eurostat provides the infor-mation required for an initial analysis, such as yearbooks and periodicals which contain data permitting more in-depth studies. These publications are available on paper or in videotext databases. To help the user focus his research, Eurostat has created 'themes', i.e. subject classifications. The statistical documents and publications are listed by series: e.g. yearbooks, short-term trends or method-ology in order to facilitate access to the statistical data.
Y. Franchet Director-General
Pour établir, évaluer ou apprécier les dif-férentes politiques communautaires, la Commission européenne a besoin d'infor-mations.
Eurostat a pour mission, à travers le sys-tème statistique européen, de répondre aux besoins de la Commission et de l'en-semble des personnes impliquées dans le développement du marché unique. Pour mettre à la disposition de tous l'im-portante quantité de données accessibles et faire en sorte que chacun puisse s'orienter correctement dans cet ensem-ble, deux grandes catégories de docu-ments ont été créées: les docudocu-ments statistiques et les publications.
Le document statistique s'adresse aux spécialistes. Il fournit les données les plus complètes: données de référence où la méthodologie est bien connue, standar-disée, normalisée et scientifique. Ces données sont présentées à un niveau très détaillé. Le document statistique est des-tiné aux experts capables de rechercher, par leurs propres moyens, les données requises. Les informations sont alors disponibles sur papier et/ou sur disquette, bande magnétique, CD-ROM. La couver-ture blanche ornée d'un graphisme stylisé démarque le document statistique des autres publications.
Les publications proprement dites peu-vent, elles, être réalisées pour un public bien déterminé, ciblé, par exemple l'enseignement ou les décideurs politi-ques ou administratifs. Des informations sélectionnées, triées et commentées en fonction de ce public lui sont apportées. Eurostat joue, dès lors, le rôle de conseil-ler.
Dans le cas d'un public plus large, moins défini, Eurostat procure des éléments nécessaires à une première analyse, les annuaires et les périodiques, dans les-quels figurent les renseignements adé-quats pour approfondir l'étude. Ces publications sont présentées sur papier ou dans des banques de données de type vidéotex.
Pour aider l'utilisateur à s'orienter dans ses recherches, Eurostat a créé les thèmes, c'est-à-dire une classification par sujet. Les documents statistiques et les publications sont répertoriés par série — par exemple, annuaire, conjonc-ture, méthodologie — afin de faciliter l'accès aux informations statistiques.
Theme Population and social conditions Series Yearbooks and yearly statistics
Cataloguing data can be found at the end of this publication
Luxembourg: Office for Official Publications of the European Communities, 1995
ISBN 92-827-4316-0
© ECSC-EC-EAEC, Brussels · Luxembourg, 1995
Reproduction is authorized, except for commercial purposes, provided the source is acknowledged
Printed in Belgium
INTRODUCTION IX
ENLARGEMENT OF THE EUROPEAN UNION Χ
EXPLANATORY NOTES XIII
DESCRIPTION OF EUROSTATS DEMOGRAPHIC DATABASE XXI
A - POPULATION CHANGE
Tables:
A-1
A-2
A-3
A-4
A-5
Population change - EUR 15 3
Crude rate of natural increase 4
Crude rate of net migration 4
Crude rate of increase 4
Population change in 1993 6
Graphs:
A-1
A-2
A-3
Total population - EUR 15 2
Population increase - EUR 15 2
Live births and deaths - EUR 15 2
Β - POPULATION STRUCTURE
Tables:
B-1:
B-2:
B-3
B-4
B-5
B-6
B-7
B-8
B-9
B-10
B-11
B-12
B-13
B-14
B-15
B-16
B-17
B-18
Population on 1 January -total 10
Population on 1 January - males 12
Population on 1 January - females 14
Population by age group on 1 January 1993 - total 16
Population by age group on 1 January 1993 - males 18
Population by age group on 1 January 1993 - females 20
Population by age group on 1 January 1994- total 22
Population by age group on 1 January 1994 - males 24
Population by age group on 1 January 1994 - females 26
Total population - annual average 48
Male population - annual average 50
Female population - annual average 52
Population by age group - annual average 1992 - total 54
Population by age group - annual average 1992 - males 56
Population by age group - annual average 1992 - females 56
Population by age group - annual average 1993 - total 58
Population by age group - annual average 1993 - males 60
Population by age group - annual average 1993 - females 60
Graphs:
B-1
B-2
B-3
B-4
B-5
B-6
B-7
B-8
B-9
Population aged 0-19 years - EUR 15 8
Population aged 20-59 years - EUR 15 8
Population aged 60+ years - EUR 15 8
Proportion of total population aged 0-19 years - EUR 15 9
Proportion of total population aged 60+ years - EUR 15 9
Proportion of total population aged 80+ years among those aged 60+ years - EUR 15 9
B-11 : Age pyramid on 1 January 1994 - Greece 32
B-12: Age pyramid on 1 January 1994- Spain 33
B-13 Age pyramid on 1 January 1994 - France 34
B-14: Age pyramid on 1 January 1994 - Ireland 35
B-15: Age pyramid on 1 January 1993 - Italy 36
B-16: Age pyramid on 1 January 1994 - Luxembourg 37
B-17: Age pyramid on 1 January 1994 - Netherlands 38
B-18: Age pyramid on 1 January 1994 - Austria 39
B-19: Age pyramid on 1 January 1994 - Portugal 40
B-20: Age pyramid on 1 January 1994 - Finland 41
B-21: Age pyramid on 1 January 1994- Sweden 42
B-22: Age pyramid on 1 January 1993 - United Kingdom 43
B-23: Age pyramid on 1 January 1994 - Iceland 44
B-24: Age pyramid on 1 January 1994 - Liechtenstein 45
B-25: Age pyramid on 1 January 1994 - Norway 46
B-26: Age pyramid on 1 January 1994 - Switzerland 47
C - THE EUROPEAN UNION AND ITS REGIONS
Table:
C - 1 : Main demographic indicators by region -1992 70
Graphs:
C-1
C-2
C-3
C-4
C-5
Population density-1992 65
Crude rate of natural increase -1992 66
Crude rate of increase -1992 67
Proportion of total population aged 0-14 years -1992 68
Proportion of total population aged 65+ years -1992 69
D - THE EUROPEAN UNION IN THE WORLD
Tables:
D-1
D-2
D-3
D-4
Population of the major regions of the world, 1950-2025 85
Main demographic indicators for the major regions of the world -1993 85
The European Union in Europe -1993 86
Main demographic indicators for the mediterranean countries -1993 92
Graphs:
D-1
D-2
D-3
World population 84
Total fertility rate -1993 90
Infant mortality rate -1993 91
E - FERTILITY
Tables:
E-1
E-2
E-3
E-4
E-5
E-6
E-7
E-8
IV
Fertility-EUR 15 97
Live births 98
Live births outside marriage 98
Proportion of live births outside marriage 98
E-10: Completed fertility by generation 106
Graphs:
E-1
E-2
E-3
E-4
Total fertility rate - EUR 15 96
Proportion of live births outside marriage - EUR 15 96
Mean age of women at childbearing - EUR 15 96
Fertility rates by age of the mother 108
F - MARRIAGE AND DIVORCE
Tables:
F- 1: Marriage and divorce - EUR 15 113
F- 2: Marriages 114
F- 3: Crude marriage rate 114
F- 4: First marriages - males 116
F- 5: First marriages - females 116
F- 6: First marriages - males (% of total marriages) 118
F- 7: First marriages- females (% of total marriages) 118
F- 8: Marriages of widowers 120
F- 9: Marriages of widows 120
F-10: Marriages of divorced males 122
F-11: Marriages of divorced females 122
F-12: Total first marriage rate - males 124
F-13: Total first marriage rate - females 124
F-14: Mean age at first marriage - males 126
F-15: Mean age at first marriage - females 126
F-16: Proportion of ever-married males by generation 128
F-17: Proportion of ever-married females by generation 128
F-18: Divorces 130
F-19: Crude divorce rate 130
Graphs:
F-1
F-2
F-3
Marriages and divorces - EUR 15 112
Crude marriage and divorce rate - EUR 15 112
First marriage rates by age - females 132
G - MORTALITY
Tables:
G- 1: Mortality - EUR 15 137
G- 2: Deaths - total 138
G-3: Deaths- males 138
G-4: Deaths - females 138
G- 5: Life expectancy at certain ages - males 140
G- 6: Life expectancy at certain ages - females 144
G- 7: Deaths by cause - males 148
G- 8: Deaths by cause - females 152
G- 9: Deaths of children under one year 156
G-10: Deaths of children under 28 days 156
G-11: Deaths of children under7 days 156
G-15: Stillbirths 160
G-16: Late foetal mortality rate 160
G-17: Perinatal mortality rate 160
Graphs:
G-1
G-2
G-3
Life expectancy at birth - EUR 15 136
Infant mortality rate - EUR 15 136
Probabilities of dying by sex and age 162
H - POPULATION BY CITIZENSHIP
Tables:
H-1
H-2
H-3
H-4
H-5
H-6
H-7
H-8
H-9
Population by citizenship on 1 January 1993 - total 172
Population by citizenship on 1 January 1993 - males 174
Population by citizenship on 1 January 1993 - females 176
European Union citizens living in another country by age group on 1 January 1993-total 178
Non-European Union citizens by age group on 1 January 1993 - total 178
European Union citizens living in another country by age group on 1 January 1993- males 180
Non-European Union citizens by age group on 1 January 1993 - males 180
European Union citizens living in another country by age group on 1 January 1993 -females 182
Non-European Union citizens by age group on 1 January 1993 - females 182
Graphs:
H-1: Population by citizenship group on 1 January 1993 by Member State 170
H- 2: Population by citizenship group on 1 January 1993 - EUR 15 170
H- 3: Main groups of non-nationals on 1 January 1993 - EUR 15 171
H- 4: Changes in non-nationals - EUR 15 171
I - POPULATION PROJECTIONS
Tables:
- 1
- 2
- 3
- 4
- 5
- 6
- 7
Assumptions used for the most recent official forecasts 186
Population forecasts by age group -1995 188
Population forecasts by age group - 2000 188
Population forecasts by age group - 2005 190
Population forecasts by age group - 2010 190
Population forecasts by age group - 2015 192
Population forecasts by age group - 2020 192
J - HOUSEHOLDS AND FAMILIES
Tables:
J - 1 : Population, households and families in 1990/1991 198
J- 2: Private households by size in 1990/1991 199
J- 3: Private households by type in 1990/1991 200
J- 4: Population living in private households by type in 1990/1991 200
J-5: Proportion of private households by type in 1990/1991 202
J- 6: Proportion of population living in private households by type in 1990/1991 202
J- 7: Families by type and number of children in 1990/1991 204
J- 8: Proportion of families by type and number of children in 1990/1991 204
J- 9: Families with at least one child aged under 6 years in 1990/1991 206
J-10: Proportion of families with at least one child aged under 6 years
in total families with children in 1990/1991 206
J-1
J-2
J-3
J-4
J-5
J-6
Average number of persons per private household 196
Proportion of population living in collective households 196
Proportion of private households by size - EUR 15 196
Population by type of household 197
Children by type of family 197
Lone-parent families with at least one child aged under 15 years 197
REPORTS ON THE DEMOGRAPHIC SITUATION BY COUNTRY 209
Eurostat's Demographic Yearbook 1995 sets out
data relating not just to the European Union and its
15 Member States, but also to the other member
countries of the European Economic Area plus
Switzerland.
The tables have been compiled directly from the data
provided by the national statistical institutes of the 19
European countries, and from international
publications (United Nations, Council of Europe) for
non-member countries.
A totally new chapter considers families and
households, taking data from the 1990/91 round of
population censuses. More detailed results will
appear in another Eurostat publication scheduled for
late 1995.
The data have partially been compiled using
SYSCODEM,a suite of programs designed to ensure
comparability between countries. The system permits
the use of a common method for computation of the
various demographic indicators.
Another change is that data - events, rates, and
probabilities - by single years of age are no longer
presented by means of tables but are merely
visualised by means of graphs. The respective
detailed data nevertheless remain available by
consulting the Eurostat demographic database.
Access to the database is explained in the following
pages.
Eurostat's thanks go to the national statistical
institutes, whose cooperation has been an essential
factor in the completion of this publication.
Luxembourg, April 1995
ENLARGEMENT OF THE EUROPEAN UNION
With the recent accession of Austria, Finland and
Sweden, the population of the Union grew by a
further 22 million. There are demographic similarities
between the 15 Member States which, for 1993, are
set out in the following chapters. However, a
preliminary comparison of the profiles of the three
new Member States with that of the Twelve seems
worthwhile.
smaller, and accounts for only 19% of the
population;
the 20-39 age group represents 29% of the total
population of Finland and 28% of Sweden's,
whilst in the Twelve it is 3 1 % and in Austria 33%.
The lower figures in Finland and Sweden reflect
the earlier start to the decline in the birth-rate,
which occurred during the 1960's in those two
countries.
Similarities between the populations of all 15
Member States
Similarities between the populations of all 15 Member
States can be observed in a number of demographic
indicators:
• infant mortality rates below 0.9%;
• a very low number of births amongst women
aged under 20;
• a total fertility rate of between 1.2 and 2.0
children per woman;
life expectancy at birth in the order of 73 years
for men (between 70 and 75) and 79.5 years for
women (between 78 and 81);
low or negligible natural population increase
(exceptions in Ireland, 5.0%> and in the
Netherlands, 3.8%o);
• between 22% and 27% of under-20s in the total
population (exception in Ireland 34%);
population structures by age marked by two
world wars and a sharp fertility decline in the
1970s and the 1980s.
Profile of the three new Member
compared with that of the Twelve
States
The total population of the Twelve grew by around
17% in the thirty-odd years from 1960. Sweden
shows the same rate of growth; that of Finland and
Austria is a little lower at around 14%.
It is the age-groups from 20 to 55 years (some 50%
of the population) that the differences were most
apparent in 1993:
• 40-55-year-olds represent 22% of the total
population of Finland, and 2 1 % of Sweden's.
These figures reflect the post-war baby boom. In
Austria and in the Twelve, the same age group is
The total fertility rates of the three new Member
States were almost without exception below those of
the Twelve from 1965 until the early 1980s, and fell
consistently throughout those 15 years. In Finland
this indicator has remained fairly stable since 1973.
But since 1982 for Sweden, and 1987 for Finland, it
has again begun to rise, whilst for the Twelve (and
indeed for Austria until 1990) it has fallen steadily.
Of the 15 Member States of the European Union,
Sweden is the country whose total fertility rate has
shown the narrowest fluctuation, although it has not
remained absolutely steady. Since 1940 it has
fluctuated between 1.61 and 2.58 children per
woman and this has been combined with a highly
stable completed fertility rate of close to 2.0 children
per woman. A similar stabilisation of the completed
fertility rate can be noted in France and Finland, for
the generation born during the period 1950-57.
In the Twelve, the proportion of births out of
wedlock amongst the total of births changed very
slowly over 20 years, increasing from around 5% in
1960 to around 10% in 1980, but then increased to
20% on the next decade. The pattern has been
similar in Austria and Finland, though at a higher
level. Only Sweden showed a totally different pattern:
between 1960 and 1970 the proportion of births out
of wedlock increased gradually from 11% to 19%,
then rose drastically to stabilise at around 50% in the
early 1990s.
number of divorces recorded, as a proportion of total
population, for the Twelve and for each of the new
Member States. However, the level of divorces for
the Twelve has always remained below that of all
three new Member States. There was a sharp rise in
the crude divorce rate for the Twelve in 1970,
followed by relative stability at around one per
thousand population, and then a further jump in
1978. Finland and Sweden both saw a steep rise in
the number of divorces throughout the seventies,
followed by a decade during which the levels
remained stable. In Finland a new threshold seems
to have been passed, with a divorce rate of around
2.5 per 1000 population. The divorce rate in Austria
has risen gradually since 1960 from around 1.1 to 2.0
divorces per 1000 population in the early 1990s.
Infant mortality rates have fallen substantially
throughout the Union since 1960. Austria seems in
the 1970s not to have made the clear progress of the
Twelve as a whole, but by 1978 it had made good
the deficit, with a level of infant mortality close to the
average of the Twelve, i.e. 15 per 1000 live births in
1978, and 7 per 1000 in 1993. Infant mortality has
also diminished in Finland and Sweden, but their
rates in 1960 were already substantially below those
of the Twelve (21 per 1000 in Finland, 17 per 1000 in
Finland and Sweden had Europe's lowest rates of
infant mortality, less than 5 per 1000 live births.
Life expectancy at birth in 1993 stood at around 79
years for females in Austria, Finland and the Twelve,
and 81 in Sweden. For males in Austria and the
Twelve it stood at close to 73 years; once again
Sweden has a significantly higher average life
expectancy, of 75.5 years. Life expectancy for males
in Finland seems to be relatively low, at 72.1 years.
The difference in life expectancy between males and
females has been substantial in Finland since 1985:
an average 8 years, compared with 6.5 years in the
Twelve.
In the new Member States the balance on
migration has been positive for a decade or so:
immigrants have outnumbered emigrants. The same
has been the case for the Twelve, and will thus
apply a fortiori to the fifteen-strong Union. In both
Finland and Sweden immigration mainly concerns
Europeans, though not necessarily from other
Member States of the Union. Emigration from these
two countries mainly concerns nationals, i.e. Finns
leaving Finland and Swedes leaving Sweden.
Main demographic indicators -1993
Population at
1.1.1994
(1000)
Natural increase
(1000)
Net migration'
(1000)
Total increase
(1000)
Gross marriage
rate (per 1000 inhabitants)
Total fertility
rate
Infant mortality
rate (per 1000 live births)
Live expectancy at birth
Males Females
EUR 15
EUR 12
Β DK
D GR
E F IRL
I L NL
A Ρ FIN
S UK
370 392.9 p
10 100.6 5 196.6 81 338.1 10 409.6 p
39 117.0 57 779.3 p
3 569.0
57 138.5 p
400.9
15 341.6
8 015.0 p
9 887.6 p
5 077.9
8 745.1
58 276.0 p
377.8 p 1 037.6 p 1 415.4 p
348 554.9 p 330.2 p 956.1 p 1 286.3 p
14.4 μ
4.6 -98.8 4.4
41.9
179.6 p
17.8 - 5 . 3p
1.4 58.0 12.7 7.6 13.8 21.0 104.7
17.9 μ
11.5 462.3 56.0 p
27.2 p
70.0 p
-8.7 183.5 p
4.3 44.4 40.3 p
15.4 p
9.1 32.1 72.4 p
32.3 16.0 363.5 60.4 p
69.1 p
249.6 p
9.1 178.2 p
5.7 102.4
53.0 p
23.0 p
22.9 53.1 177.1 p
5 . 3 "
5.3 p
5.4
6.1 5.5 6.0 5.0 p
4.4 4.4
5.1 6.0
5.8 5.6
6.9 4.9
3.9
5.9
1.46 *
1.44 *
1.59 *
1.75
1.28 1.34
1.26 * 1.65 1.93 1.22 * 1.70 1.57
1.48
1.52 1.81
1.99
1.75
(1 ) Including corrections due to population censuses, register courts, etc. which cannot be classified as births, deaths or migrations. (2) 1991
(3)1992
6.6 73.0'
6.7 ' 72.9 '
79.6'
79.5'
8.0 μ
5.4 5.8 8.5 7.8 * 6.4 p
6.0 7.3 p
6.0 6.8 6.5 8.7 4.4 4.8 6.3 p
73.0 72.6 72.7 75.0 73.7 '3'
73.1 p
72.7 73.6 '2'
72.2 74.0 72.9 70.6 72.1 75.5 73.6 "'
79.9 77.8 79.2 79.9 81.0 "' 81.2 p
78.2 80.3 a
79.4 80.0 79.4 77.8 79.5 80.8 79.0 "
IS FL Ν
EEA
CH
265.1 30.3 4 324.8
375 013.1 p
6 968.6
2.9 0.2 13.1
394.0 p
21.3
-0.2 0.2 12.6
1 050.2 p
39.4
2.7 0.4 25.6
1 444.1 p
60.6
4.6 7.5 4.5
5.3 p
6.2
2.22 *
1.86
1.47 *
1.51
4.8
5.1
6.6 *
5.6
76.7 '"
74.2
73.0 '"
74.9
80.7 's'
80.2
79.6 '"
81.4
GENERAL
The statistics of births, marriages and deaths
published in this yearbook are those supplied by the
national systems for the registration of such events.
The registration system is run under the authority of
the Ministry of the Interior or the Ministry of Justice,
or both, except in Ireland and the United Kingdom
where they come under the Office of the
Registrar-General, a self-contained department.
In certain cases the statistics of marriage and divorce
have been taken from other sources. In a number of
Member States data on marriages may be drawn
from records of church weddings. Divorce statistics
are drawn from court records. Irish law does not
permit divorce. In most countries the data are
centralised by the Ministry of the Interior/Justice and
forwarded to the national statistical institute.
Statistics of population and births, marriages and
deaths cover both nationals and non-nationals
habitually resident in the country concerned.
Demographic events not taking place on the territory
are not brought into national statistics. The statistics
of births, marriages and deaths contained in this
yearbook relate to the events which took place during
the year, not to the events registered during the year.
Nine of the Union's 15 Member States maintain
municipal registers of population (see Table 1). The
principle of such registers is an exhaustive and
continuously-updated record of the population. In
most cases the administration of the local territorial
unit is responsible for maintaining the population
register: births, deaths, changes of residence, etc.
One cause of variation in the data used is the lack of
uniform definitions for the events registered, or
uniform registration of events, or uniform statistical
exploitation of civil population records.
Two definitions of "age" may be used for the
classification of events occurring in a given year by
age of the person concerned:
• the age attained during the calendar year under
review, i.e. the year of observation minus the
year of birth;
• the age in full years at the time of the event, i.e.
the age last birthday.
Injudicious comparison of rates established using
different definitions may give a skewed image of
international reality. The choice of one or other
definition leads to significant differences, particularly
in analysis by age, since the exact age in rates
expressed in terms of "age last birthday" is likely to
be around half a year more than that for rates
compiled by reference to "age reached during the
year".
To cope with this problem Eurostat has established
SYSCODEM,a permanent conversion method first
used in 1991 which, for statistics of fertility and first
marriages, permits comparability of data compiled
according to any definition from across the European
Union. This system was made available to Eurostat
by INED, the French National Institute of
Demographic Studies.
Throughout the yearbook, data for Germany refer to
the Federal Republic within its frontiers after 3
October 1990. The totals for the Union have been
amended in consequence, and refer to the Union in
its present form with 15 Member States.
The figures for EEA are given without Liechtenstein,
if data for this country is not available; otherwise they
refer to all 18 EEA countries.
CHAPTERS A AND B: POPULATION CHANGES
AND STRUCTURE
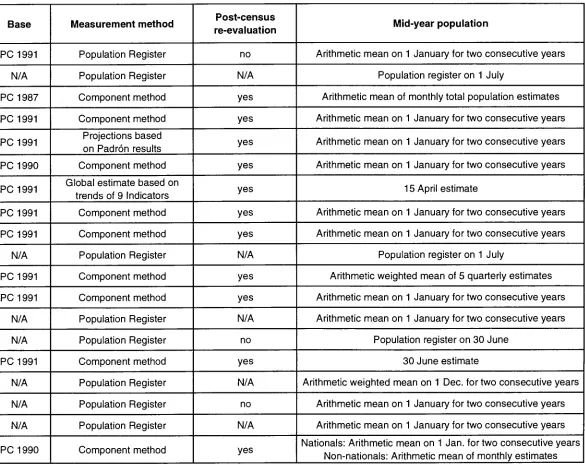
Annual estimates of population are based either on
the most recent census round of 1990/91 and
application of the component method, or on the data
extracted from a population register. Updating is at
various reference dates (see Table 2).
Ireland traditionally estimates its population in
mid-April, and the United Kingdom at 30 June. These
estimates then serve as a mean population. Iceland
estimates its population at 1 December.
The remaining countries' principal estimates are
made either at 1 January or at 31 December.
The following estimation methods are used:
• Belgium, Denmark, the Netherlands, Finland,
Sweden, Iceland and Norway rely on the state of
the population register at a given date.
• Germany, Luxembourg and Italy use the register
to obtain a figure of net migration which, added
to the natural balance, gives the total population
increase.
Table 1 : Comparison of types of population register by Member States
Computerised and
centralised
Belgium
(Registre National)
Denmark
(Central population register)
Luxembourg
(Répertoire général des
personnes physiques)
Finland
(Central population register)
Sweden
(Total population register)
Iceland
(National register of
persons)
Liechtenstein
(Zentral personen
Verwaltung)
Norway'
4'
(Central population register)
Municipal register'
1'
Belgium
Denmark
German Fed. Rep.
(Melderegister)
Spain
(Padrón)
Italy
(Anagrafe)
Luxembourg
Netherlands
(Persoonsregister)
Austria
(Melderegister)
Sweden
Liechtenstein
Switzerland
(Melderegister)
Register of foreigners
German Fed. Rep.'
2'
(Ausländerzentral-register)
Liechtenstein
(Zentral personen
Verwaltung)
Switzerland
(Ausländerzentral-register)
No register
Greece(3)
France
Ireland
Portugal
United Kingdom
(1) Partially computerised in Germany, Luxembourg, Spain, Italy, Austria and Switzerland; fully computerised in the Netherlands. (2) Computerised and centralised register.
(3) Records are kept at municipal level for Greek nationals only.
(4) Since 1994 the municipal registers have been linked to the Central Population Register.
Kingdom estimate the balance on migration,
either by compilation from various sources
(Greece, Portugal, France) or by a specific
survey at the frontier (United Kingdom,
International Passenger Survey).
• Ireland makes a global estimate of its population
using a number of indicators and calculates net
migration from the annual Labour Force Survey.
• Spain extrapolates an annual population figure
from the results of the Padrón - a five-yearly
census of the population and its principal
demographic features. Hypotheses of mortality
are taken from a table of mortality centred on the
year of the Padrón and assumed to be constant
for the period under review. Estimates are
revised every five years with the following
Padrón.
Total mean population is in general the arithmetical
mean of the population at 1 January of two
consecutive years (Table 2), except in:
• Germany, where the arithmetical mean is that of
each of the twelve months;
• Austria, where the arithmetical mean is that of
five quarterly estimates;
• Denmark, the Netherlands and Sweden, who
take the population register total at 30 June or 1
July.
REGIONS
Regional demographic statistics at NUTS II level are
for 1992, the latest available year.
The sum of total population, births and deaths may
produce slightly different results from national totals.
This is because regional breakdowns are not always
fully known.
Eurostat has also compiled regional migratory
balances, likewise using the difference between total
and natural population increases.
CHAPTER D:
WORLD
THE EUROPEAN UNION IN THE
The data on non-member countries of the European
Union are generally from international organisations,
in particular the United Nations and the Council of
Europe.
Readers should bear in mind that different countries
use different statistical systems. Data cannot be
assumed to be comparable as they are between the
Member States of the European Union.
As indicated in Table 2, a number of countries make
post facto amendments to their estimates in the light
of the following census. The following countries have
already published corrected data for the inter-census
years: Greece, Spain, France, Ireland, Italy, Portugal,
United Kingdom and Switzerland. Data relating to
Spain and Italy are nonetheless provisional.
Countries use different definitions io identify
international migrants. Apart from this, the quality of
the international migration data produced by the
contributing states is partly dependent upon the type
of administrative system employed in the country, and
upon the way it works (see Table 4).
All migratory balances, published in this yearbook,
have been compiled by Eurostat from the difference
between total and natural population increases. This
assumes that any change of population not
attributable to natural change (births and deaths) is
attributable to migration.
CHAPTER E: FERTILITY
Fertility rates by age and mean age at birth of child
have been recalculated by Eurostat to the same
definition, the age attained during the year of the
event. This permits rates to be recombined by
generation.
The procedure for conversion of rates by age last
birthday to rates but age attained in the calendar year
is decribed in a work by G. Calot La mesure des taux
en démographie - âge en années révolues ou âge
atteint dasn l'année civile. Incidence du choix de la
définition. Application à la fécondité générale (France,
1946-1981), INED TRAVAUX ET DOCUMENTS No 104,
1984.
The definition of birth order differs between countries.
For this reason birth order data have not been
included in any single table, and the total for the
Union has not been established.
The birth order published is that covering the entire
reproductive life of the mother, used in Denmark,
Greece, Spain, Ireland, Italy, Netherlands, Austria,
Portugal, Finland, Sweden, Iceland, Norway and
Switzerland. The birth order published for Belgium,
χ
<
Table 2: Annual population estimates
Country
Β
DK
D
GR
E
F
IRL
I
L
NL
A
Ρ
FIN
S
UK
IS
FL
Ν
CH
Reference date
1 January
1 January
31 December
1 January
1 January
1 January
15 April
1 January
31 December
1 January
1 January
1 January
31 December
31 December
30 June
1 January
31 December
1 January
31 December
Base
PC 1991
N/A
PC 1987
PC 1991
PC 1991
PC 1990
PC 1991
PC 1991
PC 1991
N/A
PC 1991
PC 1991
N/A
N/A
PC 1991
N/A
N/A
N/A
PC 1990
Measurement method
Population Register
Population Register
Component method
Component method
Projections based
on Padrón results
Component method
Global estimate based on
trends of 9 Indicators
Component method
Component method
Population Register
Component method
Component method
Population Register
Population Register
Component method
Population Register
Population Register
Population Register
Component method
Post-census
re-evaluation
no
N/A
yes
yes
yes
yes
yes
yes
yes
N/A
yes
yes
N/A
no
yes
N/A
no
N/A
yes
Mid-year population
Arithmetic mean on 1 January for two consecutive years
Population register on 1 July
Arithmetic mean of monthly total population estimates
Arithmetic mean on 1 January for two consecutive years
Arithmetic mean on 1 January for two consecutive years
Arithmetic mean on 1 January for two consecutive years
15 April estimate
Arithmetic mean on 1 January for two consecutive years
Arithmetic mean on 1 January for two consecutive years
Population register on 1 July
Arithmetic weighted mean of 5 quarterly estimates
Arithmetic mean on 1 January for two consecutive years
Arithmetic mean on 1 January for two consecutive years
Population register on 30 June
30 June estimate
Arithmetic weighted mean on 1 Dec. for two consecutive years
Arithmetic mean on 1 January for two consecutive years
Arithmetic mean on 1 January for two consecutive years
Nationals: Arithmetic mean on 1 Jan. for two consecutive years
Non-nationals: Arithmetic mean of monthly estimates
[image:18.842.205.790.64.528.2]Kingdom is the birth order within the current marriage.
France, Italy, the Netherlands and Portugal have the
data in both formats.
CHAPTER F: MARRIAGE AND DIVORCE
For first marriages, all countries except two have data
by age attained during the year; Ireland and United
Kingdom have data for age last birthday. First
marriage rates have been recomputed by Eurostat by
reference to age attained.
Divorce figures give a valuable insight in to trends
within individual countries. Because of the differences
between countries' divorce laws, however, the
comparison of divorce rates and numbers requires
great circumspection.
Different countries use different sources to identify
their population by citizenship.
Many use a register of population: Belgium, Denmark,
Germany, Italy, Luxembourg, Netherlands, Finland,
Sweden, Iceland, Liechtenstein, Norway and
Switzerland. France and Austria supply latest census
results. Ireland and the United Kingdom draw their
estimates from the labour force survey. Spain,
Greece and Portugal use a count of residence
permits.
The sum of the total population may produce slightly
different results from totals in the other chapters. This
is because the use of different years and sources.
CHAPTER I: POPULATION PROJECTIONS
CHAPTER G: MORTALITY
Data on life expectancy at different ages have been
supplied by countries for the period 1960-80. For
years after 1985 life expectancy has been
recomputed by Eurostat.
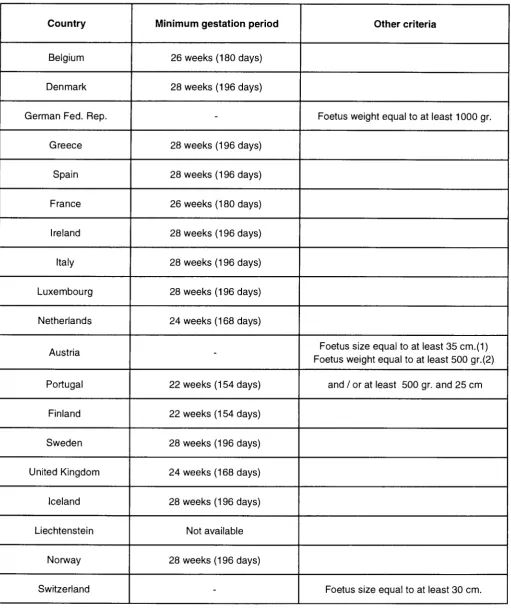
A number of countries are in the process of reviewing
their definitions distinguishing between spontaneous
abortion, early foetal death and late foetal death (or
still-birth). Differences of definition lead to variations
in the measurement of perinatal death (see Table 3).
Causes of death are defined on the basis of the
International Classification of Diseases (World Health
Organisation, 9th revision, Geneva: three-digit
classification, pp. 1-42).
All causes of death
1
2
2.1
2.2
2.3
Diseases of the circulatory system (390-459)
Malignant neoplasms (140-208)
of which malignant neoplasms of stomach,
colon, and rectum (151, 153, 154)
of which malignant neoplasms of trachea,
bronchus and lung (162)
of which malignant neoplasms of female
breast and cervix uteri (174, 180)
3 Diabetes mellitus (250)
4 Pneumonia, bronchitis, emphysema and
asthma (480-486, 490-493))
5 AIDS (042-044)
External causes:
6 Accidents and disasters (E800-E949)
6.1 of which road traffic accidents (E810-E819)
7 Suicide and self-inflicted injury (E950-E959)
The most recent population forecasts from the
national statistical institutes were compiled between
1990 and 1994. Spain's forecast is provisional. The
assumptions on which the projections are based are
set out in the pages immediately before the tables.
CHAPTER J: HOUSEHOLDS AND FAMILIES
Data on households and families have been taken
from the 1990/1991 Community census round.
Despite the recommendations of the United Nations
Economic Commission for Europe (1988), these data
appeared to be not always internationally
comparable.
As can be seen from Table 5, the definition of "private
household" differs between countries. Three
household concepts can be distinguished: the
"household-dwelling", the "housekeeping unit" and
the "housekeeping unit with family ties":
• the household-dwelling is defined as "the
aggregate number of persons occupying a
housing unit")
• the housekeeping unit is defined as a
household-dwelling which all persons "combine to provide
themselves with food and possibly other
essentials for living";
• the housekeeping unit with family ties household
is defined in the same way as the "housekeeping
unit", with the extra requirement of a family
relationship between the individual household
members - either immediate (parent, spouse or
child) or more remote (cousin, nephew, etc.).
With respect to the definition of a family, most
countries have applied the UN recommandations,
which is the following:
"For census purposes, the family should be defined in
the narrow sense of a family nucleus, that is, the
persons within a private or institutional household
who are related as husband and wife or as parent
and never-married child by blood or adoption. Thus a
family nucleus comprises a married couple without
children or a married couple with one or more
never-married children of any age, or one parent with one or
more never-married children of any age.
The term married couple [...] should include whenever
possible couples who report that they are living in
consensual unions and where feasible, a separate
count of consensual unions and of legally married
couples should be given".
(UNITED NATIONS STATISTICAL COMMITTEE and UNITED NATIONS ECONOMIC COMMISSION FOR EUROPE,1988).
A lone-parent family comprises at least one child
resident with one parent only (either father or
mother).
International comparison is not facilitated by the
differing criteria - age limits and marital status - used
to define "child".
CONVENTIONAL SIGNS
* Eurostat estimate
Zero
No data available
0 Result smaller than the arithmetical error of
computation
ρ Provisional data
EEA European Economic Area: countries of the
European Union, Iceland, Liechtenstein and
Norway.
Country
Belgium
Denmark
German Fed. Rep.
Greece
Spain
France
Ireland
Italy
Luxembourg
Netherlands
Austria
Portugal
Finland
Sweden
United Kingdom
Iceland
Liechtenstein
Norway
Switzerland
Minimum gestation period
26 weeks (180 days)
28 weeks (196 days)
-28 weeks (196 days)
28 weeks (196 days)
26 weeks (180 days)
28 weeks (196 days)
28 weeks (196 days)
28 weeks (196 days)
24 weeks (168 days)
-22 weeks (154 days)
22 weeks (154 days)
28 weeks (196 days)
24 weeks (168 days)
28 weeks (196 days)
Not available
28 weeks (196 days)
-Other criteria
Foetus weight equal to at least 1000 gr.
Foetus size equal to at least 35 cm.(1)
Foetus weight equal to at least 500 gr.(2)
and / or at least 500 gr. and 25 cm
Foetus size equal to at least 30 cm.
(1) Up to 31 December 1994. (2) Since 1 JAnuary 1995.
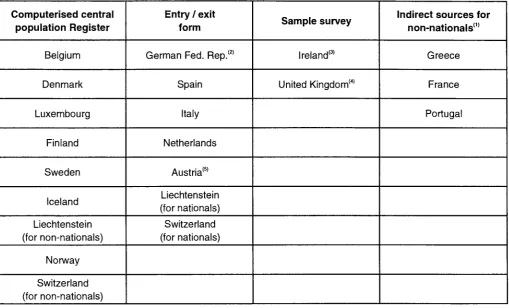
[image:21.595.43.555.73.682.2]Table 4: Sources of data on international migration
Computerised central
population Register
Belgium
Denmark
Luxembourg
Finland
Sweden
Iceland
Liechtenstein
(for non-nationals)
Norway
Switzerland
(for non-nationals)
Entry / exit
form
German Fed. Rep.'
2'
Spain
Italy
Netherlands
Austria'
5'
Liechtenstein
(for nationals)
Switzerland
(for nationals)
Sample survey
Ireland'
3'
United Kingdom'
4'
Indirect sources for
non-nationals'"
Greece
France
Portugal
(1) No source available for nationals
(2) A parallel source (the "Ausländerzentralregister") exists for the non-national population. (3) A specific question is asked during the Labour Force Survey.
[image:22.595.44.556.495.773.2](4) International Passenger Survey: a voluntary survey organised at frontiers by the OPCS. Of the 100 000 persons leaving the country each year, approximately 1 000 can be regarded as emigrants, and of the 60 000 persons entering the country some 2 500 can be regarded as immigrants. (5) In force since 1 April 1995.
Table 5: The different concepts of private households
Dwelling concept
Denmark
France
Finland
Sweden
Norway
"House-keeping"
concept
Belgium
German Fed. Rep.
Greece
Spain
Ireland
Luxembourg
Austria
Netherlands
United Kingdom
Liechtenstein
Switzerland
"House-keeping" concept exclusively
with related persons
Italy
Portugal
The household concept is not applied in Iceland.
Those who require more detailed data may obtain
them from the Demographic database. Applications
should be addressed to the Eurostat Information
Office in Luxembourg.
The data are to be found in NEW CRONOS under the
heading "Population and social conditions". A series
of multidimensional tables sets out data for 19
countries: the 18 members of the European
Economic Area plus Switzerland. Tables cover four
major domains: population, fertility, marriage and
divorce, and mortality. How complete the tables are
depends largely on the availability of data from the
relevant national statistical institutes.
Data are presented country by country and for three
groups of countries: European Union, European Free
Trade Association, and European Economic Area.
Time series begin at 1950 and continue through to
1993. For population at 1 January, data are available
through to 1994.
Additional data may be extracted for the following tables:
Population
PJAN
PJANSIN
PJANMAR
PJANDIV
PJANWID
PPAVG
PPROJ
PPROJIND
Population by sex and age at 1 January
Number of unmarried persons by sex and age at 1 January
Number of married persons by sex and age at 1 January
Number of divorced persons by sex and age at 1 January
Number of widowed persons by sex and age at 1 January
Mean population by sex and age
Population forecasts by sex and five year age group in 1995, 2000, 2005, 2010, 2015 and
2020 (NSI projections)
Assumptions of forecasts
Fertility
FIND
FMONTH
FAGEC
FAGER
FRATE
FORDAGEC
FORDAGER
Indicators of fertility (total fertility rate, crude and net reproduction rate, mother's mean age
at birth of child and at birth of first child)
Live births by month and day
Live births by mother's age at last birthday
Live births by mother's age reached during the year
Fertility rate by age (at last birthday and reached during the year)
Births by birth order and by mother's age at last birthday
Births by birth order and by mother's age reached during the year
Marriage and divorce
NIND
NMONTH
N M STA
NSINAGEC
NSINAGER
NDIVIND
NDIVMAR
NSINRT
Marriage indicators (number of marriages, marriage rate, mean age at marriage, mean
age at first marriage)
Marriages by month and day
Marriages by marital status and sex
First marriages by sex and age at last birthday
First marriages by sex and age reached during the year
Divorce indicators (number of divorces, crude divorce rate, divorce rates)
Divorces by year of marriage
First marriage rates by sex and age
Mortality
MAGEC
MAGER
MINF
MINDIND
MPROB
MLEXPEC
Deaths by sex and age at last birthday
Deaths by sex and age reached during the year
Infant mortality (stillbirths, deaths within 7 days of birth, within 28 days of births, during the
year)
Infant mortality rate
Mortality probabilities by sex and age
Life expectancy by sex and age
GIND
GLONGIND
Principal demographic indicators (population on 1st January and at mid-year, live births,
deaths, crude birth rate, crude death rate, natural growth, net migration, total population
growth)
Longitudinal demographic indicators (completed fertility, ultimate proportion of ever
married persons by sex)
For further information please contact:
Eurostat Information Office
Office B3/089, Jean Monnet Building
L-2920 Luxembourg
Tel. (+352)4301-34567
Fax (+352) 436404
A-1 Total population - EUR 15
400
380
360
340
320
SOO
1-
11960
1965
1970
1975
1980
1985
1990
A-2 Population increase - EUR 15
1960
1965
1970
1975
1980
1985
1990
A-3 Live births and deaths - EUR 15
Population change - EUR 15
1960 1961 1962 1963 1964 1965 1966 1967 1968 1969 1970 1971 1972 1973 1974 1975 1976 1977 1978 1979 1980 1981 1982 1983 1984 1985 1986 1987 1988 1989 1990 1991 1992 1993 1994 Population on 1 January (1000) 314 826.0 317 266.7 319 955.0 323 404.6 326 074.6 328 760.9 331 374.9 333 796.1 335 686.8 337 780.0 339 974.9 341 524.5 343 627.8 345 570.9 347 245.8 348 643.7 349 893.4 350 936.5 352 114.0 353 326.8 354 571.7 356 052.8 356 923.1 357 524.6 357 968.6 358 462.6 359 123.8 359 949.3 360 776.8 362 081.3 363 714.9365 448.9 p 367 062.2 p 368 977.7 P 370 392.9 p
Live births (1000) 5 783.7 5 902.4 5 963.0 6 107.9 6 247.7 6 096.7 6 059.3 5 934.7 5 792.4 5 683.8 5 495.3 5 498.8 5 265.4 5 054.2 4 957.0 4 748.0 4 699.2 4 623.5 4 584.6 4 583.5 4 630.0 4 531.1 4 474.6 4 320.4 4 289.9 4 274.7 4 287.8 4 293.3 4 358.0 4 308.6 4 379.0 4 289.4 p 4 241.5 p 4 123.2 p
Deaths (1000) 3 386.1 3 347.6 3 500.5 3 569.5 3 419.9 3 542.2 3 536.6 3 543.5 3 698.6 3 772.1 3 679.0 3 703.7 3 703.9 3 748.2 3 738.7 3 792.7 3 794.5 3 679.0 3 723.6 3 710.2 3 737.2 3 737.7 3 696.8 3 769.2 3 692.2 3 764.8 3 735.3 3 654.3 3 676.1 3 692.4 3 721.2 3 730.5 3 670.7 p 3 745.4 p
Natural increase (1000) 2 397.6 2 554.8 2 462.5 2 538.4 2 827.7 2 554.5 2 522.6 2 391.3 2 093.8 1 911.7 1 816.2 1 795.1 1 561.4 1 306.0 1 218.4 955.2 904.7 944.5 861.0 873.2 892.8 793.4 777.8 551.2 597.7 510.0 552.6 639.0 681.9 616.2 657.9 558.9 570.9 377.8 Net migration1" (1000) 43.1 133.5 987.1 131.5 - 141.4 59.5 -101.3 - 500.6 -0.6 283.2 - 266.6 308.3 381.6 368.9 179.6 294.4 138.4 233.0 351.8 371.6 588.4 76.9 -176.3 - 107.3 - 103.7 151.2 272.9 188.6 622.6 1 017.4 1 076.1 1 054.4 1 344.5 1 037.6 Total increase (1000) 2 440.8 2 688.3 3 449.6 2 669.9 2 686.3 2 614.0 2 421.3 1 890.7 2 093.2 2 194.8 1 549.6 2 103.4 1 943.1 1 674.9 1 397.9 1 249.6 1 043.1 1 177.5 1 212.8 1 244.9 1 481.1 870.3 601.5 444.0 494.0 661.2 825.4 827.6 1 304.4 1 633.6 1 734.0 1 613.3 1 915.4 1 415.4 Live births per 1000 population 18.3 18.5 18.5 18.8 19.1 18.5 18.2 17.8 17.2 16.8 16.2 16.0 15.3 14.6 14.2 13.6 13.4 13.2 13.0 13.0 13.0 12.7 12.5 12.1 12.0 11.9 11.9 11.9 12.1 11.9 12.0 11.7 11.5 11.2 Deaths per 1000 population 10.7 10.5 10.9 11.0 10.4 10.7 10.6 10.6 11.0 11.2 10.8 10.8 10.8 10.8 10.7 10.9 10.8 10.5 10.6 10.5 10.5 10.5 10.3 10.5 10.3 10.5 10.4 10.1 10.2 10.2 10.2 10.2 10.0 10.1 Natural increase per 1000 population 7.6 8.0 7.7 7.8 8.6 7.7 7.6 7.2 6.2 5.7 5.3 5.2 4.5 3.8 3.5 2.7 2.6 2.7 2.4 2.5 2.5 2.2 2.2 1.5 1.7 1.4 1.5 1.8 1.9 1.7 1.8 1.5 1.6 1.0 Net migration per 1000 population1" (1000) 0.1 0.4 3.1 0.4 -0.4 0.2 -0.3 - 1.5 0.0 0.8 -0.8 0.9 1.1 1.1 0.5 0.8 0.4 0.7 1.0 1.1 1.7 0.2 -0.5 -0.3 -0.3 0.4 0.8 0.5 1.7 2.8 3.0 2.9 3.7 2.8 Total increase per 1000 population 7.7 8.4 10.7 8.2 8.2 7.9 7.3 5.7 6.2 6.5 4.6 6.1 5.6 4.8 4.0 3.6 3.0 3.3 3.4 3.5 4.2 2.4 1.7 1.2 1.4 1.8 2.3 2.3 3.6 4.5 4.8 4.4 5.2 3.8
A-2
Crude rate of natural increase
1960 1965 1970 1975 1980 1985 1988 1989 1990 1991 1992 1993 EUR 15 7.6 7.7 5.3 2.7 2.5 1.4 1.9 1.7 1.8 1.5 Ρ 1.6 Ρ L O P
Β 4.5 4.3 2.4 0.0 1.1 0.3 1.5 1.4 1.9 2.1 Ρ 2.1 Ρ 1.4 Ρ DK 7.1 8.0 4.6 4.2 0.3 -0.9 0.0 0.4 0.5 0.9 1.3 0.9 D 5.3 5.5 0.9 -2.6 -1.1 -1.5 -0.1 -0.3 -0.2 -1.0 -0.9 -1.2
(per 1000 population) GR 11.6 9.8 8.1 6.9 6.3 2.4 1.5 0.9 0.8 0.7 0.6 0.4 E 13.0 12.7 11.3 10.5 7.5 3.7 2.6 2.2 1.8 1.5 1.7 1.1 Ρ F 6.5 6.5 6.0 3.5 4.7 3.9 4.4 4.2 4.2 4.1 3.9 3.1 Ρ IRL 9.9 10.6 10.4 10.7 11.9 8.2 6.5 5.7 6.2 6.0 5.8 5.0 I 8.6 9.1 7.1 4.9 1.5 0.5 0.5 0.5 0.5 0.2 0.3 Ρ -0.1 Ρ L 4.2 3.7 0.8 -1.1 0.2 0.2 2.0 1.8 3.0 3.2 2.9 3.6 NL 13.2 12.0 9.9 4.7 4.7 3.8 4.2 4.0 4.6 4.6 4.4 3.8
A-3
Crude rate of net migration
1960 1965 1970 1975 1980 1985 1988 1989 1990 1991 1992 1993 EUR 15 0.1 0.2 -0.8 0.8 1.7 0.4 1.7 2.8 3.0 2.9 Ρ 3.7 Ρ 2.8 Ρ Β 0.9 3.2 -3.4 2.5 -0.2 -0.1 3.7 0.7 2.0 1.4 Ρ 2.5 Ρ 1.8 Ρ DK -0.9 -0.4 4.3 -2.0 0.1 1.9 0.1 0.7 1.7 2.1 2.2 2.2 D 2.2 4.3 -3.5 -2.7 3.9 0.9 6.4 9.5 8.3 7.5 9.6 5.7
(per 1000 population) GR -3.7 -4.7 -5.3 6.5 5.2 0.6 2.7 5.3 7.0 8.5 4.7 5.4 E -4.6 -2.2 2.2 0.4 3.0 -0.5 -0.5 -0.2 -0.1 1.0 0.5 0.7 Ρ F 3.1 1.5 3.6 0.3 0.8 0.7 1.0 1.3 1.4 1.6 1.6 1.2 Ρ IRL -14.8 -7.5 -0.9 5.4 -0.1 -9.3 -12.1 -8.0 -2.2 0.4 -1.2 -2.5 I -1.6 -1.2 -2.0 0.4 0.1 -0.4 0.1 0.3 0.5 0.0 3.2 Ρ 3.2 Ρ L 1.7 5.3 3.2 9.7 3.7 2.5 5.7 9.9 10.3 10.7 10.9 10.7 NL -1.1 1.4 2.5 5.1 3.6 1.4 1.9 1.8 3.3 3.3 2.8 2.9
(1) Including corrections due to population censuses, register counts, etc. which cannot be classified as births, deaths or migrations.
A-4
Crude rate of increase
1960 1965 1970 1975 1980 1985 1988 1989 1990 1991 1992 1993 EUR 15 7.7 7.9 4.6 3.6 4.2 1.8 3.6 4.5 4.8 4.4 Ρ 5.2 Ρ 3.8 Ρ Β 5.4 7.5 -1.0 2.5 0.8 0.1 5.2 2.0 3.9 3.5 Ρ 4.6 Ρ 3.2 Ρ DK 6.2 7.6 8.9 2.2 0.4 1.0 0.1 1.1 2.2 3.0 3.6 3.1 D 7.5 9.8 -2.6 -5.3 2.8 -0.6 6.3 9.2 8.1 6.5 8.7 4.5
Crude rate of natural increase
(per 1000 population)
A 5.2 4.9 1.8 -0.3 -0.2 -0.3 0.6 0.7 1.0 1.4 1.5 1.6 Ρ 13.4 12.8 10.1 9.0 6.5 3.3 2.4 2.2 1.3 1.2 1.4 0.8 FIN 9.6 7.3 4.4 4.6 3.9 3.0 2.9 2.9 3.1 3.2 3.3 2.7
s
3.6 5.8 3.7 1.9 0.6 0.5 1.8 2.8 3.4 3.3 3.2 2.4 UK 6.0 6.8 4.5 0.6 1.6 1.4 2.4 2.1 2.7 2.5 2.5 1.8 Ρ IS 21.3 17.8 12.6 13.6 13.1 9.1 11.4 11.3 12.0 10.6 11.1 10.9 FL 15.6 12.5 12.3 5.3 8.5 7.5 7.9 7.1 6.4 7.8 6.6 7.9 Ν 8.2 8.4 6.7 4.1 2.4 1.6 2.9 3.3 3.5 3.7 3.6 3.0 EEA 7.6 7.7 5.4 2.8 2.5 1.4 1.9 1.7 1.8 1.6 Ρ 1.6 Ρ 1.1 Ρ CH 7.9 9.6 6.8 3.6 2.3 2.3 3.0 3.1 3.0 3.5 3.6 3.1 1960 1965 1970 1975 1980 1985 1988 1989 1990 1991 1992 1993A-3
Crude rate of net migration
(1)(per 1000 population)
A -0.3 1.4 1.4 -3.2 1.2 1.0 1.5 6.9 16.0 8.4 10.4 5.0 Ρ -6.3 -19.5 -14.0 38.2 4.3 -2.7 -5.0 -5.8 -6.1 -2.5 -1.0 1.6 FIN -2.1 -4.6 -7.9 -0.8 -0.5 0.5 0.3 1.2 1.7 2.9 1.8 1.8 S -0.1 4.2 5.8 2.0 1.2 1.3 3.5 5.2 4.1 2.9 2.3 3.7 UK 2.1 -0.8 -0.3 -0.8 -0.6 1.6 0.6 1.4 1.2 1.3 0.8 1.2 Ρ IS 0.0 -0.8 -8.7 -1.9 -2.7 -2.5 6.0 -3.9 -3.9 4.4 -0.9 -0.7 FL 5.9 -1.0 7.6 3.1 -31.8 7.2 8.8 2.5 13.8 4.3 9.7 6.8 Ν -0.7 -0.5 -0.2 0.8 0.9 1.6 2.4 -0.4 0.4 1.9 2.4 2.9 EEA 0.1 0.2 -0.8 0.8 1.6 0.4 1.7 2.8 2.9 2.9 Ρ 3.6 Ρ 2.8 Ρ CH 4.2 -0.3 -2.9 -9.1 2.7 2.1 5.1 5.1 8.4 10.1 5.9 5.7 1960 1965 1970 1975 1980 1985 1988 1989 1990 1991 1992 1993
(per 1000 population)
A-4
Crude rate of increase
A-5
Population change in 1993
EUR 15
Β DK
D GR
E F IRL
I L NL
A Ρ FIN
S UK
IS FL Ν
EEA
CH
Population on 1 January
1994 (1000)
370 392.9 p
10 100.6 5 196.6 81 338.1 10 409.6 p
39 117.0 p
57 779.3 P
3 569.0 57 138.5 p
400.9 15 341.6 8 015.0 p
9 887.6 p
5 077.9 8 745.1 58 276.0 P
265.1 30.3 4 324.8
375 013.1 p
6 968.6
Live births (1000)
4 123.2 p
121.0 p
67.4 798.4 101.8 380.6 p
711.5 P
49.5 538.2 p
5.4 195.7 95.2 114.0 64.8 118.0 761.7
4.6 0.4 59.7
4 187.9 p
83.8
Deaths (1000)
3 745.4 p
106.6 62.8 897.3 97.4 338.7 p
531.9 p
31.7 543.4 p
3.9 137.8 82.5 106.4 51.0 97.0 657.1 p
1.8 0.2 46.6
3 793.9 p
62.5
Natural increase
(1000)
377.8 p
14.4 P
4.6 -98.8 4.4 41.9 179.6 P
17.8 -5.3 p
1.4 58.0 12.7 7.6 13.8 21.0 104.7
2.9 0.2 13.1
394.0 p
21.3
Net migration1"
(1000)
1 037.6 p
17.9 P
11.5 462.3 56.0 P
27.2 p
70.0 P
-8.7 183.5 p
4.3 44.4 40.3 p
15.4 p
9.1 32.1 72.4 p
-0.2 0.2 12.6
1 050.2 p
39.4
Total Increase
(1000)
1 415.4 p
32.3 16.0 363.5 60.4 p
69.1 P
249.6 P
9.1 178.2 p
5.7 102.4 53.0 p
23.0 P
22.9 53.1 177.1 P
2.7 0.4 25.6
1 444.1 p
60.6
Live births per 1000 population
11.2
12.0 13.0 9.8 9.8 9.7 12.3 13.9 9.4 13.4 12.8 11.9 11.5 12.8 13.5 13.1
17.5 13.8 13.8
11.2
12.1 Deaths per 1000 population
10.1
10.6 12.1 11.1 9.4 8.7 9.2 8.9 9.5 9.8 9.0 10.3 10.8 10.1 11.1 11.3
6.6 5.9 10.8
10.1
9.0
Natural increase per 1000 population
1.0
1.4 0.9 -1.2 0.4 1.1 3.1 5.0 -0.1 3.6 3.8 1.6 0.8 2.7 2.4 1.8
10.9 7.9 3.0
1.1
3.1 Net migration per 1000 population'"
(1000)
2.8
1.8 2.2 5.7 5.4 0.7 1.2 -2.5 3.2 10.7 2.9 5.0 1.6 1.8 3.7 1.2
-0.7 6.8 2.9
2.8
5.7 Total increase per 1000 population
3.8
3.2 3.1 4.5 5.8 1.8 4.3 2.5 3.1 14.3 6.7 6.6 2.3 4.5 6.1 3.0
10.2 14.7 5.9
3.9
8.7
B-1 Population aged 0-19 years - EUR 15
125
100
co
c
o
75
50
m
'
—
~ ~ ~ — - ^
^ ^ - - — . _ _
*
-- i — ■ — ι — ■ — ■ — i ■ — ■ — ■ — ■ — ι . . . . - . - . . . . ι . . . . ι . . . . ι , . ,
1960
1965
1970
1975
1980
1985
1990
B-2 Population aged 20-59 years - EUR 15
225
B-3 Population aged 60+years - EUR 15
100
75
euroeta
(O C O