LETTER • OPEN ACCESS
A systems network approach for climate change vulnerability
assessment
To cite this article: Nathan S Debortoli et al 2018 Environ. Res. Lett. 13 104019
View the article online for updates and enhancements.
LETTER
A systems network approach for climate change vulnerability
assessment
Nathan S Debortoli1
, Jesse S Sayles1
, Dylan G Clark and James D Ford2
McGill University, Department of Geography, 805 Sherbrooke Street West, Montreal, QC H3A 0B9 CA, Canada 1 These authors contributed equally to the project.
2 Current address: University of Leeds, Priestley International Centre for Climate, Leeds, United Kingdom.
E-mail:[email protected]
Keywords:climate change, multiplex network, Inuit, Canadian Arctic, vulnerability indices, vulnerability asessment, human-environment system
Supplementary material for this article is availableonline
Abstract
Vulnerability to climate change is a product of biophysical and social dynamics. Assessments of
community or regional vulnerability, however, often focus on quantitative infrastructure and
environmental assessments, or qualitative assessments of a community’s social dynamics and
livelihood activities. A dearth of integrated quantitative assessments is a major barrier for decision
makers who require quantitative outputs and indicators, which can measure where vulnerability is
most severe and can be linked to climate projections. Our framework and analysis helps address such
gaps by identifying variables to build climate change vulnerability indices, which we pilot here
focusing on Inuit communities in the Canadian Arctic. We start with a systematic literature review of
community-based vulnerability studies and assess relationships among 58 social and biophysical
variables. We then use multiplex network analysis to determine how social and environmental
variables interact among and within the key component of vulnerability: exposure, sensitivity, and
adaptive capacity. We identify several structurally important variables that interact within and across
the three dimensions of vulnerability. This method is transferable as an integrative means of
understanding not only the direct causes of vulnerability, but also relations that are less tangible. The
approach of multiplex network analysis can be a building block to ongoing development of
vulnerability indices within the human dimensions of climate change
field.
Introduction
Climate change is widely recognized as one of the major challenges of this century. Many regions and commu-nities are already experiencing the effects of climate change with shifts in precipitation patterns, loss of coastline, and increases in frequency of severe weather events [1]. To help communities prepare for these changes, vulnerability research seeks to identify and characterize the various interacting climatic and non-climatic factors which create susceptibility to harm [2,3]. Community vulnerability case studies have been
widely used for adaptation and disaster risk reduction planning, climate change cost analysis, and delineation of relationships between social and physical environ-ments, contributing to a growing knowledge of the
multiscale dynamics of vulnerability to climate change [4–6].
Community-level studies have been a central fea-ture of vulnerability research, and many focus on social variables. There is, however, strong demand for inte-grated quantitative regional vulnerability studies that consider both social and physical variables [7] and demand by government officials for indicators to do so
as outlined by Canada’s Expert Panel on Climate
Change Adaptation and Resilience Results [8]. The potential to link downscaled climate model data with vulnerability assessments makes such assessments even more desirable[9–12]. With over 25 years of
vulner-ability case studies and literature summarizing com-monalities and trends throughout thefield, there are enough data to begin moving beyond community-level OPEN ACCESS
RECEIVED
28 September 2017
REVISED
17 September 2018
ACCEPTED FOR PUBLICATION
18 September 2018
PUBLISHED
15 October 2018
Original content from this work may be used under the terms of theCreative Commons Attribution 3.0 licence.
Any further distribution of this work must maintain attribution to the author(s)and the title of the work, journal citation and DOI.
analysis in heavily studied regions, although few meth-ods have been proposed for upscaling integrated
vul-nerability case studies. Addressing this key
methodology gap, we propose the use of multiplex net-work analysis to draw together data from vulnerability case studies and identify which variables are most influ-ential for developing a regional vulnerability index.
Vulnerability has been conceptualized in several different ways among different discipline and study perspectives[13–17]. Two distinct frameworks of
vul-nerability appear throughout the scholarship—risk
hazard or outcome-based approaches, and pressure and release or contextual vulnerability [15, 18–21].
Although both approaches fundamentally denote the susceptibility of a population to harm, the associated research questions and perspectives differ [16, 18,
20, 22]. Outcome-based vulnerability assessments
focus primarily on biophysical exposure and assess vulnerabilities directly related to these exposures, while contextual vulnerability begins with human sys-tems and examines what makes populations vulner-able to external conditions in the context of multiple stresses[18,23]. This framing of social vulnerability is also prevalent within the natural hazards scholarship by which disasters are seen as products of social struc-tures, not solely biophysical magnitude[24]. This can be expressed as:
V=f E S AC( , , ),
whereE,S, andACrefer to exposure, sensitivity, and
adaptive capacity of a community or region [25].
Exposure is defined as a change in frequency, magni-tude, or duration of biophysical interactions with human systems or other biophysical variables[26–28].
Sensitivity is defined as conditions that alter the amount of impact an exposure may have on a biophysical or human system[26,29,30], and adaptive capacity reflects the ability to address, plan for, or adapt to climate-related risks and take advantage of new opportunities[26,31]. These three components of vulnerability are not mutually exclusive and the relationships between variables can be scale dependent and may vary depending on the system being assessed [26]. We use contextual vulnerability in this study
because of the emphasis placed on social systems as
mechanisms for reduction(adaptation)or
exacerba-tion of vulnerability and the ability to capture feedback loops and cross-sectoral interactions.
While study approaches for contextual vulnerability vary throughout the literature, most community-based case studies begin by examining the state of vulnerability (health burdens, food insecurity, unrest)and then dis-sect the social and physical pathways and influences. When focusing on specific livelihood segments and locations, the classification and system mapping is often straightforward. However, as we develop a model for operationalizing vulnerability assessments for regions and transitioning from qualitative to quantitative repre-sentations, selection of appropriate variables, identifi ca-tion of system characteristics, and accounting for scale
dependent variance becomes increasingly complex. Here, we apply network analytics as a means of char-acterizing how different socio-economic, environ-mental, and climatic indicators interact to create vulnerability.
Informed by Ford and Smit[26], we contend that relationships ofE,S, andACcan overlap and therefore are best represented by a multiplex network approach, where objects in the network can have multiple types of relationships. Development of multiplex tools is relatively new[32], and their application to human-environment research is even newer[33]. Therefore, this study not only advances vulnerability scholarship, but also network approaches to human-environment research. In this paper, we apply network analysis to assess vulnerability in the Canadian Arctic, a region undergoing some of the most rapid changes in climate globally[34], with a focus on Inuit communities(see map inSP-1,available online atstacks.iop.org/ERL/ 13/104019/mmedia).
Methods
Framework and research approach
Moving from qualitative community-based vulner-ability studies to a regional system map of vulnervulner-ability (a model that can be eventually linked to social and environmental projections), requires an iterative and transferable approach. We begin by visualizing the vulnerability framework in a way that promotes quantitative operationalization of a systems analysis.
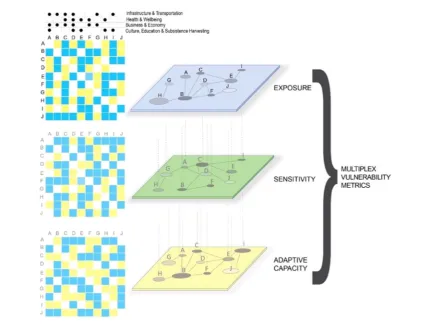
Informed by existing vulnerability frameworks, we first subset the system intoexposure(E),sensitivity(S), andadaptive capacity(AC). Since a given variable can
influence multiple components of vulnerability(i.e.
socio-economic status may influence both adaptive capacity and sensitivity), we ensure that each vulner-ability component includes all variables; each comp-onent can be represented as a two-dimensional matrix of system variables that together form a multi-layered system of interactions(figure1).
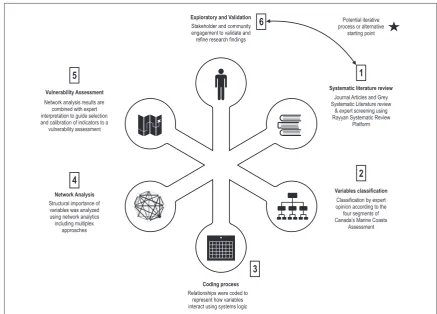
Next, we used a systematic literature review [35,36]of climate change vulnerability case studies conducted in the Canadian Arctic to select index
vari-ables and understand their relationships. Figure 2
illustrates the steps used starting with the systematic literature review and ending with stakeholder engage-ment to validate and refine our results. Because the current research builds on more than 16 years of work by our research group with local Inuit communities and regional decision makers[5,26,37,38],
under-pinned by principles of community-based
participa-tory research [39, 40], we have the advantage of
have already voiced concerns about research fatigue [40]. To reduce fatigue, we propose coming to
com-munities with a set of analyses and researchfindings in hand that can catalyze conversations, which has pro-ven fruitful in other places[41]. When generalizing
our approach to situations that lack such longstanding relationships, initial community collaboration is likely an importantfirst step, as indicated infigure 2. The results of this paper focus on the literature review and multiplex network analysis of vulnerability(i.e. steps 1 through 5,figure2). Further reflections about stake-holder engagement are provided in the discussion.
Systematic literature review
We began the review in Web of Knowledge using the
following syntaxes during the 1970–2017 period:
(a) ‘climat* chang*’ AND ‘Inuit*’ n=240 records; (b) ‘climat* chang*’ AND ‘vuln* Inuit*’ n=83 records; (c) ‘climat* chang*’ AND ‘adapt* Inuit*’ n=87 records and finally (d) ‘res*’ AND ‘Inuit*’ n=39 records. We also searched gray literature not computed by index tools, including institutional reports, consultant reports, book chapters and con-ference proceedings. These searches were conducted
using repository searches(e.g. openDOAR), reference lists, and consultation with team members. For the gray literature, the following syntaxes were used:(a) ‘Inuit climate change’ n=588 records; (b) ‘Inuit vulnerability’n=437;(c)‘Inuit adaptation’n=274 andfinally‘Inuit resilience’n=10 records. SeeSP-1
for further details.
The 1758 articles, book, book chapters and con-ference proceedings were reviewed and organized using a peer review tool for scrutinizing called Rayyan Systemic Reviews Platform[42](see systematic
litera-ture reviewSP-1). This online platform helps expedite
the initial screening of abstracts and titles using a pro-cess of semi-automation while incorporating a high level of usability[42]. Using this online tool, our team
[image:4.595.120.549.65.392.2]checked articles and agreed if they should be included for a complete review. Articles and gray literature were excluded from the full review process if they did not relate to Inuit systems vulnerability or connect Inuit lifestyle to human physical or environmental shifts. Papers that did not provide solid evidence linking cli-mate change, socio-economic, and environment fac-tors were also excluded. Thefinal review included 155 documents.
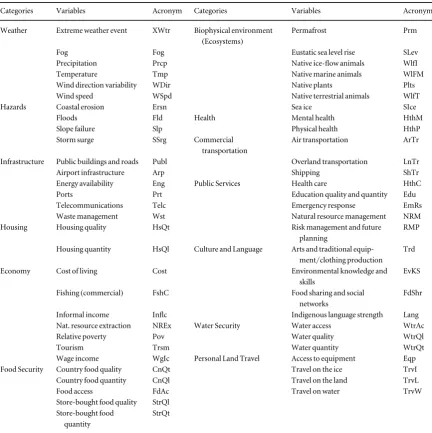
Reviewing these materials initially identified 137 vulnerability variables. Many variables were con-sidered sub-sets of larger categories. We therefore merged variables so that the resulting dataset(n=58, table1)would contain variables of a similar specificity
(seeSP-1for initial variables). For example, we
con-sidered walrus and ringed seal(animals important to subsistence food systems)to be part of variable called ‘ice-flow animals’.
Among the 58 merged variables identified in the literature review, we coded the effects of theoretically changing the magnitude or quality of any given vari-able on other varivari-ables. Coding used a nominal and qualitative classification and was based on our detailed reading of the literature and subsequent under-standing of biophysical and socio-political dynamics
in the region. We coded effects as positive (an
increase/decrease in‘A’has the same effect on ‘B’), negative(an increase/decrease in‘A’has the opposite effect on‘B’), or variable(the relationships could be highly contextual, exhibit an inflection point, or demonstrate some other behavior). Positive, negative, and variable effects were considered for each vulner-ability component(i.e.E,S, andAC)and each could have different interaction types (i.e. increasing ‘A’ could increase ‘B’ when considering sensitivity, but decrease ‘B’ when considering exposure). We only considered direct effects where, for example, changing ‘A’directly effects‘B.’Situations where changing‘A’
affects‘B’which then affects‘C’would be coded as two direct effects,‘A ->B’and‘B ->C’, and not‘A ->C’. The network is directed and feedback between two variables‘A’and ‘B’is permitted and coded as two relationships(‘A ->B’and‘B’->‘A’). Two research-ers independently conducted all coding and then codes were checked for agreement; discrepancies were reviewed and discussed by the research team and reco-ded following a consensus decision.
Lastly, we categorized variables into four sub-net-works as used in Canada’s Marine Coasts Assessment [5]to conduct in depth analysis of specific dimensions
of Inuit life. The four sub-networks are detailed in SP-3and include the following sectors:(S1)infrastructure
and transportation,(S2)business and economy,(S3)
health and well-being, and(S4)culture-education and subsistence-harvesting.
Network analysis
[image:5.595.115.553.59.373.2]We use network analytics to analyze variables that influence exposure, sensitivity, and adaptive capacity. A network approach is logical because it analyzes the relationships among variables and vulnerability is fundamentally a relational concept; vulnerability is produced by the interaction of various social and ecological factors [26]. A network consists of an assemblage of units, called nodes in network science, that are connected by edges. Nodes in our network represent the 58 variables identified in the literature Figure 2.Thefigure illustrates the steps taken to implement the system’s network approach for vulnerability assessment in the
review. Positive, negative, and variable effects were represented as edges, and each vulnerability comp-onent(E,S, andAC)constitutes a network layer, or one of multiple possible relationships in a multiplex network. We then analyzed a variable’s role based on network structures. For example, a highly connected variable would be more central to understanding vulnerability than a variable with few connections. Such diagnostic approaches are commonly used for
guiding resource management programs (e.g. as
reviewed by [43]) as well as understanding policy
interactions[44]. Diagnostic application to economic
vulnerability also exist (e.g. vulnerably to peak
oil[45]).
A network perspective often focuses on structural relationships, or the number and arrangement of nodes and edges[46]. For example, a single state agency that
holds a governance network together, forming a net-work with a central hub and few connections among other nodes, will have significant influence over the
network. If the agency is inefficient, all communications between parties will be slowed. If the agency dissolves, the network falls apart. The quality of actors(nodes) and relationships(edges)are also important in a net-work. When a central agency is trusted and all organiza-tions agree on common objectives, a centralized network can be very efficient[47,48]. A structural
per-spective does not ignore node and edge function and quality. It does however, recognize that real and poten-tial function can be inferred by structural patterns that can then be further contextualized within specific cases as needed.
A fundamental structural property of any node in a network is connections to other nodes[46]. The
num-ber of connections is called a node’s degree centrality (CD). The higher a node’s degree centrality, the more
[image:6.595.119.552.80.514.2]important it is in the network from a structural per-spective. In a multiplex case, however, two nodes may have the same total number of edges but play very dif-ferent roles or function in the network. For example, Table 1.Variables(n=58)included in the Inuit vulnerability system grouped by major category. Acronyms are provided and used in figures3and4.
Categories Variables Acronym Categories Variables Acronym
Weather Extreme weather event XWtr Biophysical environment
(Ecosystems)
Permafrost Prm
Fog Fog Eustatic sea level rise SLev
Precipitation Prcp Native ice-flow animals WlfI
Temperature Tmp Native marine animals WlFM
Wind direction variability WDir Native plants Plts
Wind speed WSpd Native terrestrial animals WlfT
Hazards Coastal erosion Ersn Sea ice SIce
Floods Fld Health Mental health HthM
Slope failure Slp Physical health HthP
Storm surge SSrg Commercial
transportation
Air transportation ArTr
Infrastructure Public buildings and roads Publ Overland transportation LnTr
Airport infrastructure Arp Shipping ShTr
Energy availability Eng Public Services Health care HthC
Ports Prt Education quality and quantity Edu
Telecommunications Telc Emergency response EmRs
Waste management Wst Natural resource management NRM
Housing Housing quality HsQt Risk management and future
planning
RMP
Housing quantity HsQl Culture and Language Arts and traditional equip-ment/clothing production
Trd
Economy Cost of living Cost Environmental knowledge and
skills
EvKS
Fishing(commercial) FshC Food sharing and social
networks
FdShr
Informal income Inflc Indigenous language strength Lang
Nat. resource extraction NREx Water Security Water access WtrAc
Relative poverty Pov Water quality WtrQl
Tourism Trsm Water quantity WtrQt
Wage income WgIc Personal Land Travel Access to equipment Eqp
Food Security Country food quality CnQt Travel on the ice TrvI
Country food quantity CnQl Travel on the land TrvL
Food access FdAc Travel on water TrvW
Store-bought food quality StrQl Store-bought food
quantity
consider a node‘A’with nine exposure edges and a node‘B’with nine edges spread evenly across theE,S, andACcategories. Despite having the same number of edges, the two nodes clearly play different roles in the network, the exact nature of which is contextual to the particular case. Node‘B’in the previous example is said to be more multiplex[49]. Analyzing the degree
centrality and multiplex nature of vulnerability com-ponents helps untangle the complex web of interac-tions that create the coupled human-environment phenomena of vulnerability[16].
To understand how multiplex a node is, we calcu-late its participation coefficient(Pi)which is a measure
of how evenly a node’s edges are distributed among different categories. Following Battistonet al[49]who expanded the concept of single layer network partici-pation[50]to multiplex networks, we considerPito be
zero when a node has edges of only one kind(e.g. only
exposure edges).Pi equals one when a node has an
equal number of edges among all the categories in question (e.g. 3 E, 3 S, and 3 AC). Formally, Pi is
defined as follows[49]:
P M
M
k o
1 1 ,
i M a ia i 1 2
å
= - -= ⎡ ⎣ ⎢ ⎢ ⎛ ⎝ ⎜ ⎞⎠⎟⎤ ⎦ ⎥ ⎥ [ ]whereM=the number of layers in the network(i.e. E,S, andAC),ki=a node’s degree centrality for each
ofalayers, andoi=a node’s total degree centrality
across all network layers, also known as its total
overlapping degree.
Following Battiston et al [49], we also consider
Z-scores, which normalize the total overlapping
degree to allow comparisons of networks of different sizes.
z oi oi o , o
s
= - á ñ
( )
where 〈o〉 =the average overlapping degree of all nodes in the system andσo=the standard deviation.
UnlikePi, which is bound by 0 and 1, theZ-score is not
bounded and its magnitude and range illustrate the variability of total degree overlap in the system.
Our vulnerability network is directed, meaning that edges did not have to be reciprocal; there could be an edge fromitojin layera, but not fromjtoi. Degree centrality scores include edges to and from a node(i.e. total or freeman’s degree centrality). When calculating centrality,Z-scores and participation we unweighted the data and only edge presence or absence was
considered for these metrics. Our objective was to pro-vide an initial coarse-grained diagnostic of vulner-ability. We then analyzed the weighted data to understand system feedbacks using network diagrams and edge frequency counts. Further details and exam-ple code for calculating multiexam-plex Pi,Z-scores, and
total overlapping degree are provided inSP-2.
Results
Multiplex participation analysis
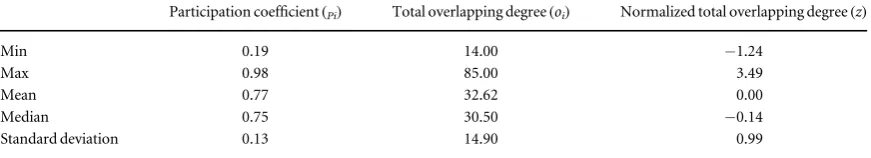
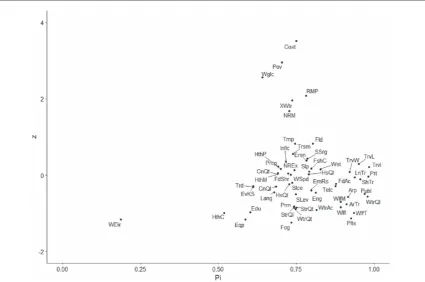
Nodes in the network vary greatly in terms of how multiplex they are(table2, min and maxPi). No node,
however, is perfectly multiplex or participating only within a single layer(0<Pi<1.00, table1). The most
multiplex variables in the whole vulnerability system (figure3)includes travel on ice(Pi=0.98), ports(Pi
=0.98), water qualityPi=0.97), public buildings and
roads(Pi=0.96), shipping(Pi=0.95)and travel on
land(Pi=0.95), implying that these are cross cutting
variables that play an integral role in the whole vulnerability system.
A different set of nodes has the highest total over-lapping degrees: cost of living(oi=85), poverty(oi
=77), wage income(oi=71), natural resource
man-agement-planning (oi =64) and extreme weather
events(oi=62). These variables concomitantly have
medium-high participation scores(Pi)in the range of
0.64–0.78 indicating that they too are important cross cutting issues affecting Inuit vulnerability to climate change, though not the most multiplex. Within the network, variable-undetermined relationships are the most frequent relationships(npositive edges=500,n negative edges=460,nvariable edges=932). Inuit cost of living, for example has a total overlapping degree(oi)for variable-undetermined relationships of
76 and only nine positive and negative relationships combined. Cost of living is relatively multiplex (Pi
=0.75) and structurally important (oi =85) for
[image:7.595.119.555.76.155.2]understanding Inuit vulnerability to climate change, but its specific interactions with other variables are uncertain illustrating a challenge when trying to para-meterize a total vulnerability index. Any index of Inuit vulnerability should include a sensitivity analysis to a variable with multiplex scores such as those found in cost of living. The index might be calibrated under sev-eral scenarios or assumptions about a variable such as cost of living to present a range of results to aid deci-sion makers.
Table 2.Descriptive statistics of multiplex scores accords all nodes(n=58)in the entire network.
Participation coefficient(Pi) Total overlapping degree(oi) Normalized total overlapping degree(z)
Min 0.19 14.00 −1.24
Max 0.98 85.00 3.49
Mean 0.77 32.62 0.00
Median 0.75 30.50 −0.14
The multiplex analysis condenses several dimen-sions of information into a single metric providing a powerful overview of the entire system. This analytical power, however, should not overshadow the merit of simultaneously learning through the lens of a more detailed analysis of each layer. For this reason, we fur-ther explore and dissect the whole vulnerability system into the three vulnerability layers of exposure, sensitiv-ity and adaptive capacsensitiv-ity(figure4).
Inuit exposure, sensitivity and adaptive capacity to climate change
Inuit exposure to climate change
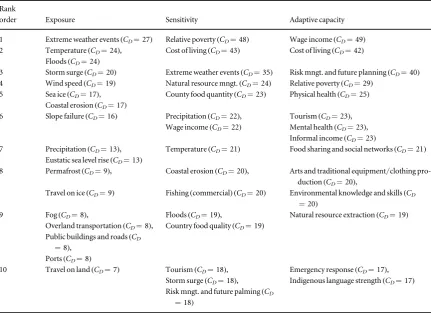
In the exposure layer, extreme weather has the largest degree centrality(CD=27,figure4, table3)and would
therefore affect many variables within the Inuit vulnerability system. Temperature is the second most central variable(CD=24)and is expected to increase
with climate change, leaving the region more prone to disasters such asfloods(CD=24)or storm surges(CD
=20)[51,52]. Combining quantitative metrics with
qualitative systems understanding can help parame-terize a vulnerability model. For example, sea ice, another highly central variable(CD=17), has many
outgoing positive relationships(blue arrows,figure4)
to other variables that influence traditional food systems including food security, access, and animal resource abundance. Traditional activities have been shown to improve Inuit physical and mental health [53,54]and therefore a variable like sea ice is not only structurally important in the network, but essential for
Inuit well-being. Sea ice extent could serve as a key indicator variable within a vulnerability index.
Inuit sensitivity to climate change
Within the sensitivity layer, there are numerous variable-undetermined relationships, especially con-cerning the socioeconomic, cultural and well-being aspects of Inuit. It is logical that these variables have many variable-undetermined relationships; they are driven by people’s actions, governance and the
idio-syncrasies of specific regions and not necessarily
reducible to simple direct relationships. Relative poverty has the highest degree centrality(CD =48,
figure 4, table 3). Other nodes with high degree
centrality include cost of living(CD =43), extreme
weather events (CD =35), and natural resource
management(CD=24). The large number of
vari-able-undetermined edges indicate that it is not always possible to associate a given driver of change to perceived or documented consequences; there will be complex cumulative impacts of different drivers and trade-offs. This uncertainty highlights the need to calibrate vulnerability models at a local scale. Course grained assessments, as presented here, can help tease out assumptions and identify areas needing further research.
Inuit adaptive capacity to climate change
[image:8.595.124.550.62.344.2]The adaptive capacity layer has several variable-undeter-mined and positive relationships. Wage income, with the highest degree centrality(CD=49,figure4, table3), has
high structural importance followed by cost of living(CD
=42), risk management and future planning(CD=40)
and natural resource management(CD=34). Natural
resource management and risk management, both of
which are highly central, are affected by a wide range of local, regional, and national programs and capacities[55].
[image:9.595.123.548.60.630.2]The vulnerability index will need to be calibrated for local variations in these important variables.
Discussion
Quantitative vulnerability indices are an important tool for adaptation planning[56]. Indicator variables should be easily applicable, measurable, accessible, transferable, and non-redundant[57]. While uncer-tainty in climate models and social and economic projections makes predicting future vulnerability challenging, vulnerability indices, nevertheless, pro-vide a foundation for integrating future climatic and socio-economic drivers of vulnerability. Our systema-tic literature review and multiplex analysis advances vulnerability indicator creation by integrating social and biophysical variables derived from both commu-nity-based studies and large-scale regional reports. We also provide a methodology for identifying key indi-cator variables based on their centrality within a systems framework of vulnerability and ability to crosscut the three vulnerability components of expo-sure, sensitivity, and adaptive capacity.
In our analysis, cross cutting, multiplex variables, such as cost of living, poverty and wage income will play a vital role in future vulnerability index creation. Context, however, is important to consider when parameterizing. For example, tourism was highly cen-tral in S and AC dimensions. While potently a source
of income (and possible adaptive capacity), studies
have shown that tourism can be maladaptive when not properly integrated into local economies[58], so the
effects of this variable must be evaluated carefully.
Several nodes were less multiplex than expected, such as access to education, knowledge of traditional lan-guages and health care. Low multiplex scores by no means challenge the established importance of these variables in the literature. Simply, these variables, which primary interact within a single vulnerability layer, may be more straightforward to parameterize in an index.
Our results provide important assessment of vari-ables contributing to Inuit vulnerability. A few limita-tions and potential future expansions are worth noting however. First, several highly multiplex and central variables are categorically related such as poverty, costs of living, and wage income. These variables, however, cannot be treated as surrogates. Raising wages will have little effect on a person’s life if the cost of living rises. Both variables must be considered, though perhaps could be calibrated into a living wage index. Our perspective is that the network analysis should always be paired with expert opinion when crafting vulnerability indices to account for such nuanced relationships and interdependences among nodes.
Second, our analysis uses several very powerful network metrics including multiplex participation,
Z-scores, and degree centrality. We unweighted the
[image:10.595.120.552.82.395.2]network when calculating most metrics but included weights when considering edge counts and visual interpretation. Future expansions of our work might take advantage of other network metrics(see[59]for a Table 3.Names and Freeman’s degree centrality(CD)scores of the top 10 rank ordered variables within each vulnerability layer(E,S,AC). The same nodes(n=58)are present in each layer, but the number of relationship varies. In the table, management is abbreviated mgnt.
Rank
order Exposure Sensitivity Adaptive capacity
1 Extreme weather events(CD=27) Relative poverty(CD=48) Wage income(CD=49) 2 Temperature(CD=24), Cost of living(CD=43) Cost of living(CD=42)
Floods(CD=24)
3 Storm surge(CD=20) Extreme weather events(CD=35) Risk mngt. and future planning(CD=40) 4 Wind speed(CD=19) Natural resource mngt.(CD=24) Relative poverty(CD=29)
5 Sea ice(CD=17), County food quantity(CD=23) Physical health(CD=25) Coastal erosion(CD=17)
6 Slope failure(CD=16) Precipitation(CD=22), Tourism(CD=23), Wage income(CD=22) Mental health(CD=23),
Informal income(CD=23)
7 Precipitation(CD=13), Temperature(CD=21) Food sharing and social networks(CD=21) Eustatic sea level rise(CD=13)
8 Permafrost(CD=9), Coastal erosion(CD=20), Arts and traditional equipment/clothing pro-duction(CD=20),
Travel on ice(CD=9) Fishing(commercial) (CD=20) Environmental knowledge and skills(CD
=20)
9 Fog(CD=8), Floods(CD=19), Natural resource extraction(CD=19) Overland transportation(CD=8), Country food quality(CD=19)
Public buildings and roads(CD
=8), Ports(CD=8)
10 Travel on land(CD=7) Tourism(CD=18), Emergency response(CD=17), Storm surge(CD=18), Indigenous language strength(CD=17) Risk mngt. and future palming(CD
review). For example, average node strength accounts for the value or strength of all edges and inverse
parti-cipation ratio (not to be confused with multiplex
participation,Pi, which we analyzed) evaluates how
evenly weights are distributed among the edges[60].
These metrics could help highlight variables known to be important to Inuit well-being and resilience, such as education and traditional skills, that did not score high in our multiplex participation analysis.
Third, we do not take geography into account. Our review pulls together numerous case studies and regio-nal reports to synthesize a set of vulnerability variables. It is possible that some variables are more pressing in specific regions of the Canadian Arctic due to local variability in resources, environment, and socio-poli-tical organization. Expansion of our work might attempt to integrate a geographic weighting or regio-nal membership into the network aregio-nalysis[43].
Finally, since our analysis started with the litera-ture review, our results only reflect variables captured in the literature. Fortunately, there is a strong tradition of vulnerability and adaptation research in the Cana-dian Arctic, providing a robust dataset to pull on. While no minimum number of local case studies are needed for the network analysis, case study availability could be a barrier in other locations; but our approach can be applied to any population or setting provided there is data. Data availability and reliability are not unique concerns to the network approach. They are a challenge for any synthesis method. Network analysis is actually rather robust to small datasets. The multi-plex analysis could be conducted with as few as three nodes, the bare minimum that constitutes a network. (Recall, nodes in our analysis are vulnerability vari-ables, not the case studies from which variables are dis-tilled.)Where quality case studies are lacking, other data sources such as media reports, or stakeholder interviews could also be used to generate nodes for the network analysis.
Even with a rich case study literature, stakeholder engagement, as outlined infigure2, is a fundamental step to validatefindings and elicit additional impor-tant variables. While we have chosen to engage stake-holders with a set of results in hand to catalyze discussions, reflecting extensive previous research and consultations conducted by the team in the region, other situations may warrant starting with stake-holders. The network analysis might also be treated as one of several methods, such as focus groups or expert opinions, to identify variables.
Stakeholder involvement should not be taken lightly or done superficially. Beyond essential issues related to community-based research, such as cultural understanding, trust, integrating disparate world-views, and considering what is realistic, feasible, and desired involvement by communities[40,61], there
are inherent challenges of depth and breadth when engaging stakeholders for a locally informed and regionally focused project. Our literature review and
network analysis aim to support indicator develop-ment for the entire Canadian Arctic, an area com-prised of 53 communities spread out over a vast area
>2 million km2and four regional governments, each with rules and norms for conducting research(SP-1).
Time, logistics, andfinances may inhibit consulting
every community. Researchers will have to work hard to achieve a legitimate engagement plan that yields the right level of stakeholder input as there are likely no panacea approaches.
Conclusion
Our multiplex network approach provides aflexible,
quantitative framework to evaluate exposure, sensitiv-ity, and adaptive capacity variables while recognizing that these dimensions of vulnerability are not mutually exclusive. Our results can help select indicators from available census and other government data to create vulnerability indices. For instance, accessing fi ne-resolution, up-to-date data for highly central and multiplex variables would be a top priority when compiling vulnerability indices. We can further cali-brate indicator models based on their positive and negative relationships. Undetermined effects will have to be scrutinized depending on how they behave in context specific situations. Our approach, however, is not without limitations. We recommend using the network approach as one of several methods to identify indicator variables and that any index be developed with adequate and necessary involvement and feedback from local communities, decision makers, and subject experts.
Acknowledgments
Several anonymous reviewers provided important comments that improved this manuscript. This pro-ject was supported by funding from the Social Sciences and Humanities Research Council of Canada (SSHRC), Canadian Institute of Health Research (CIHR), Transport Canada’s Northern Transporta-tion AdaptaTransporta-tion Initiative, and ArcticNet.
ORCID iDs
Nathan S Debortoli https://orcid.org/ 0000-0002-2467-243X
References
[1]IPCC Climate Change 2014Impacts, Adaptation, and Vulnerability. Part B: Regional Aspects. Contribution of Working Group II to the Fifth Assessment Report of the Intergovernmental Panel on Climate Changeed V R Barros vol 2014(Cambridge: Cambridge University Press)
[3]Räsänen Aet al2016 Climate change, multiple stressors and human vulnerability: a systematic reviewReg. Environ. Change
162291–302
[4]McDowell G, Ford J and Jones J 2016 Community-level climate change vulnerability research: trends, progress, and future directionsEnviron. Res. Lett.11033001
[5]Ford J D, Bell T and Couture N J 2016 Perspectives of Canada’s North Coast regionClimate Change Impacts and Adaptation Assessment of Canada’s Marine Coasts. 1ed D S Lemmenet al(Ottawa: Government of Canada) pp 153–206
[6]Ford J D, Champalle C, Tudge P, Riedlsperger R, Bell T and Sparling E 2015 Evaluating climate change vulnerability assessments: a case study of research focusing on the built environment in northern CanadaMitigation Adaptation Strateg. Glob. Change201267
[7]Bisaro A and Hinkel J 2016 Governance of social dilemmas in climate change adaptationNat. Clim. Change6354–9 [8]Douglas Aet al2018Measuring Progress on Adaptation and
Climate Resilience: Recommendations to the Governement of Canada(Gatineau QC: Environment and Climate Change Canada)
[9]Debortoli N S, Camarinha P I M, Marengo J A and Rodrigues R R 2017 An index of Brazil’s vulnerability to expected increases in naturalflashflooding and landslide disasters in the context of climate changeNat. Hazards86
557–82
[10]2017 Índice de vulnerabilidade aos desastres naturais relacionados às secas no contexto da mudança do clima/ Ministério do Meio Ambiente, Ministério da Integração Naciona(Brasil: World Wildlife Fund) (https://www.wwf.org. br/natureza_brasileira/reducao_de_impactos2/clima/copy_ of_mudancas_climaticas2_20062017_1938/)
[11]Debortoli N S, Camarinha P I M and Rodrigues R R 2016 Natural disasters caused by waterThird National Communication of Brazil to the United Nations Framework Convention on Climate Change Volume II1st edn(Brasília: Brazilian Ministry of Science, Technology and Innovation) pp 145–58
[12]Nguyen T T X, Bonetti J, Rogers K and Woodroffe C D 2016 Indicator-based assessment of climate-change impacts on coasts: a review of concepts, methodological approaches and vulnerability indicesOcean Coast. Manage.12318–43 [13]Ford J D and Smit B 2004 A framework for assessing the
vulnerability of communities in the Canadian Arctic to risks associated with climate changeArctic57389–400
[14]Pearce T, Smit B, Duerden F, Ford J D, Goose A and Kataoyak F 2010 Inuit vulnerability and adaptive capacity to climate change in Ulukhaktok, Northwest Territories, CanadaPolar Rec.46157–77
[15]Smit B and Wandel J 2006 Adaptation, adaptive capacity and vulnerabilityGlob. Environ. Change16282–92
[16]Turner B Let al2003 A framework for vulnerability analysis in sustainability scienceProc. Natl Acad. Sci.1008074–9 [17]Williamson S, Sharp M, Dowdeswell J and Benham T 2008
Iceberg calving rates from northern Ellesmere Island ice caps, Canadian Arctic, 1999–2003J. Glaciol.54391–400
[18]O’Brien K, Eriksen S, Nygaard L P and Schjolden A 2007 Why different interpretations of vulnerability matter in climate change discoursesClim. Policy773–88
[19]Adger W Net al2007 Assessment of adaptation practices, options, constraints and capacityClimate Change 2007: Impacts, Adaptation and Vulnerability. Contribution of Working Group II to the Fourth Assessment Report of the
Intergovernmental Panel on Climate Change(Cambridge: Cambridge University Press)719–43
[20]Ribot J 2014 Cause and response: vulnerability and climate in the AnthropoceneJ. Peasant Stud.41667–705
[21]Ford J Det al2010 Case study and analogue methodologies in climate change vulnerability researchWiley Interdiscip. Rev.-Clim. Change1374–92
[22]Adger W N 2006 VulnerabilityGlob. Environ. Change16268–81
[23]Ford J D, Smit B and Wandel J 2006 Vulnerability to climate change in the Arctic: a case study from Arctic Bay, Canada Glob. Environ. Change16145–60
[24]Hewitt K 1983Interpretations of Calamity from the Viewpoint of Human Ecology(London: Taylor and Francis)
[25]Smit J B and Pilifosova O 2003 From adaptation to adaptive capacity and vulnerability reductionClimate Change, Adaptive Capacity, and Development.ed J B Smithet al(London: Imperial College Press)pp 9–28
[26]Ford J D and Smit B 2004 A framework for assessing the vulnerability of communities in the Canadian Arctic to risks associated with climate changeArctic57389–400
[27]Turner B Let al2003 A framework for vulnerability analysis in sustainability scienceProc. Natl Acad. Sci.1008074–9 [28]Ford J D, Knight M and Pearce T 2013 Assessing the‘usability’
of climate change research for decision-making: a case study of the Canadian International Polar YearGlob. Environ. Change-Hum. Policy Dimens.231317–26
[29]Hewitt K 1983Interpretation of Calamity: From the Viewpoint of Human Ecology(Boston, MA: Allen and Unwinn)
[30]Watts M J and Bohle H G 1993 The space of vulnerability: the causal structure of hunger and famineProg. Hum. Geog.1743–67
[31]Ford J Det al2013 The dynamic multiscale nature of climate change vulnerability: an Inuit harvesting exampleAnn. Assoc. Am. Geogr.1031193–211
[32]De Domenico M, Sole-Ribalta A, Gomez S and Arenas A 2014 Navigability of interconnected networks under random failuresProc. Natl Acad. Sci. USA1118351–6
[33]Baggio J A, BurnSilver S B, Arenasc A, Magdanzd J S, Kofinas G P and Domenico M D 2016 Multiplex social ecological network analysis reveals how social changes affect community robustness more than resource depletionProc. Natl Acad. Sci.11313708–13
[34]Ford J, Bell T, Couture N and Clark. D 2018 Climate change and Canada’s northern coast: current knowledge, future research needsEnviron. Rev.2682–92
[35]Mahood Q, Van Eerd D and Irvin E 2014 Searching for grey literature for systematic reviews: challenges and benefitsRes. Synth. Methods5221–34
[36]Ford J D, Berrang-Ford L and Paterson J 2011 A systematic review of observed climate change adaptation in developed nationsClim. Change106327–36
[37]Ford J D, McDowell G and Jones J 2014 The state of climate change adaptation in the ArcticEnviron. Res. Lett.9104005 [38]Ford J D, Pearce T, Duerden F, Furgal C and Smit B 2010
Climate change policy responses for Canada’s Inuit population: the importance of and opportunities for adaptationGlob. Environ. Change20177–91
[39]Pearce T Det al2009 Community collaboration and climate change research in the Canadian ArcticPolar Res.2810–27 [40]Ford J Det al2016 Community-based adaptation research in the
Canadian ArcticWiley Interdiscip. Rev. Clim. Change7175–91 [41]Vance-Borland K and Holley J 2011 Conservation stakeholder
network mapping, analysis, and weavingConservation Lett.4
278–88
[42]Ouzzani M, Hammady H, Fedorowicz Z and Elmagarmid A 2016 Rayyan-a web and mobile app for systematic reviewsSyst. Rev.5210
[43]Sayles J S and Baggio J A 2017 Who collaborates and why: assessment and diagnostic of governance network integration for salmon restoration in Puget Sound, USAJ. Environ. Manage.18664–78
[44]Champalle C, Ford J and Sherman M 2015 Prioritizing climate change adaptations in Canadian Arctic Communities Sustainability79268–92
[45]Kerschner C, Prell C, Feng K and Hubacek K 2013 Economic vulnerability to peak oilGlob. Environ. Change231424–33 [46]Borgatti S P, Mehra A, Brass D J and Labianca G 2009 Network
analysis in the social sciencesScience323892–5
[48]Berardo R and Scholz J T 2010 Self-organizing policy networks: risk, partner selection, and cooperation in estuariesAm. J. Political Sci.5632–49
[49]Battiston F, Nicosia V and Latora V 2014 Structural measures for multiplex networksPhys. Rev.E89032804
[50]Guimerà R and Amaral L A N 2005 Functional cartography of complex metabolic networksNature433895–900
[51]Diaconescu E P, Mailhot A, Brown R and Chaumont D 2018 Evaluation of CORDEX-Arctic daily precipitation and temperature-based climate indices over Canadian Arctic land areasClim. Dyn.502061
[52]Bintanja R and Andry O 2017 Towards a rain-dominated ArcticNat. Clim. Change7263–7
[53]Cunsolo Willox Aet al2013 Climate change and mental health: an exploratory case study from Rigolet, Nunatsiavut, Canada Clim. Change121255–70
[54]MacDonald J P, Harper S L, Cunsolo Willox A, Edge V L and Government R I C 2013 A necessary voice: climate change and lived experiences of youth in Rigolet, Nunatsiavut, Canada Glob. Environ. Change-Hum. Policy Dimens.23360–71 [55]AMAP 2017 Adaptation Actions for a Changing Arctic
(AACA)Barents Area Overview ReportArctic Monitoring and Assessment Programme(AMAP) (Oslo, Norway)
(https://www.amap.no/documents/doc/ Adaptation- Actions-for-a-Changing-Arctic-AACA-Barents-Area-Overview-report/1529)
[56]Hinkel J 2011 Indicators of vulnerability and adaptive capacity: towards a clarification of the science–policy interfaceGlob. Environ. Change21198–208
[57] Birkmann J(ed)2006 Indicators and criteria for measuring vulnerability: theoretical bases and requirementsMeasuring Vulnerability to Natural Hazards: towards Disaster Resilient Societies(New Delhi: United Nations University Press)
[58]Carson M and Peterson G 2016 Arctic CouncilArctic Resilience ReportStockholm Environment Institute and Stockholm Resilience Centre(https://www.sei.org/mediamanager/ documents/Publications/ArcticResilienceReport-2016.pdf) [59]Boccaletti Set al2014 The structure and dynamics of
multilayer networksPhys. Rep.5441–122
[60]Menichetti G, Remondini D, Panzarasa P, Mondrago R L J and Bianconi G 2014 Weighted multiplex networksPLoS One9