Strat. Mgmt. J.,28: 1035–1052 (2007) Published online 17 May 2007 in Wiley InterScience (www.interscience.wiley.com) DOI: 10.1002/smj.627 Received 14 October 2005;Final revision received 20 March 2007
STRATEGIC SUPPLY CHAIN MANAGEMENT:
IMPROVING PERFORMANCE THROUGH A CULTURE
OF COMPETITIVENESS AND KNOWLEDGE
DEVELOPMENT
G. TOMAS M. HULT,1* DAVID J. KETCHEN JR2and MATHIAS ARRFELT1 1Eli Broad Graduate School of Management, Michigan State University, East Lansing, Michigan, U.S.A.
2College of Business, Auburn University, Auburn, Alabama, U.S.A.
For many firms, using their supply chains as competitive weapons has become a central element of the strategic management process in recent years. Drawing on the resource-based view and theory from the organizational learning and information-processing literatures, this study uses a sample of 201 firms to examine the influence of a culture of competitiveness and knowledge development on supply chain performance in varied market turbulence conditions. We found that synergies exist between a culture of competitiveness and knowledge development: their interaction has a positive association with performance. In addition, based on behavioral and contingency theories, we found that market turbulence moderates these relationships, having a positive influence on the knowledge development–performance link and a negative influence on the culture of competitiveness–performance link. Managers who are confident about the level of market turbulence they will face can use this sense to decide whether to emphasize developing either a culture of competitiveness or knowledge development in their supply chains. For those firms whose managers are unlikely to be able to predict the degree of turbulence they will face over time, a focus on both a culture of competitiveness and knowledge development is critical to ensuring success.Copyright2007 John Wiley & Sons, Ltd.
INTRODUCTION
The quest to discover the determinants of firm per-formance has long been central to the strategic management field. Indeed, many leading schol-ars have argued that building knowledge about why some firms outperform others is the cor-nerstone of the field (e.g., Hitt, Boyd, and Li, 2004; Rumelt, Schendel, and Teece, 1994; Sum-mer et al., 1990). In recent years, the nature of competition has increasingly shifted toward ‘sup-ply chain vs. sup‘sup-ply chain’ struggles (Handfield
Keywords: strategic supply chain management; perfor-mance; culture; knowledge development; resource-based view
*Correspondence to: G. Tomas M. Hult, Eli Broad Graduate School of Management, Michigan State University, East Lans-ing, MI 48824-1121, U.S.A. E-mail: [email protected]
and Nichols, 2002; Slone, 2004). Supply chains are value-adding relations of partially discrete, yet inter-reliant, units that cooperatively transform raw materials into finished products through sequen-tial, parallel, and/or network structures (Bowersox, Closs, and Stank, 1999). When rivals such as UPS and FedEx clash, it is not merely their individual capabilities, but rather the collective capabilities of their respective supply chains, that determine the outcome.
Historically, the strategic management field has not devoted much empirical attention to supply chains, while related disciplines such as marketing and operations management have long empha-sized the performance implications of operational activities. For example, in a review of the opera-tions management literature, Anderson, Cleveland, and Schroeder (1989: 134) noted: ‘proper strategic
positioning or aligning of operations capabili-ties can significantly impact competitive strength and business performance of an organization.’ In recent years, a small body of strategic manage-ment research has begun to examine ‘strategic supply chain management’—the use of a supply chain not merely as a means to get products where they need to be, but also as a tool to enhance key outcomes (e.g., Hult, Ketchen, and Nichols, 2002; Hult, Ketchen, and Slater, 2004). The value of strategic supply chain management is reflected in how firms such as Wal-Mart, Zara, Toyota, and Dell have used their supply chains as com-petitive weapons to gain advantages over peers. Meanwhile, failing to strategically manage supply chains offers serious negative consequences. As Lee (2004) describes, for example, supply chain difficulties led Cisco to write off $2.25 billion in inventory in 2001 and led Motorola to lose many crucial early camera phone sales in 2003. Given the implications for profits and sales, it is perhaps not surprising that the announcement of a major supply chain problem erodes a firm’s market value by an average of 10 percent (Hendricks and Sing-hal, 2003).
Like the Hultet al. studies, we focus on explain-ing order fulfillment cycle time—the length of time between taking an order and delivery of the needed product to the customer. As Ray, Barney, and Muhanna (2004) note, measuring the effec-tiveness of business processes helps test resource-based logic and taps into the competitive advan-tages developed within important activities. Cycle time is a key metric for directly assessing sup-ply chain functioning (Nichols, Retzlaff-Roberts, and Frolick, 1996). More importantly, cycle time is central to a firm’s strategic success. As Hand-field and Nichols (2002: 13) note, cycle time not only has ‘a direct linkage to profits’ at the firm level, but excellence in cycle time allows firms to ‘grow faster and earn higher profits relative to other firms in their industry, increase market share through early introduction of new products, con-trol overhead and inventory costs, and move to positions of industry leadership.’ In contrast to the single-organization focus of the Hultet al. studies, we examine the supply chains of multiple firms. This design feature allows us to shed new light on the critical issue of why some firms outperform others.
This paper is devoted to taking what we view as a next logical step in the emerging stream
of research on strategic supply chain manage-ment. We build on Hult et al. (2002), who intro-duced the concept of ‘cultural competitiveness’ as a reflection of innovativeness, entrepreneurial, and learning orientations,1 and Hult et al. (2004),
who examined the knowledge development pro-cess, both within the context of achieving supe-rior performance. Learning is a key element of both studies but the frameworks tested are dis-tinct. Taking the previous studies’ shared con-cern for learning as our point of departure, we build on the resource-based view (Wernerfelt, 1984), and theory from the organizational learning (Huber, 1991) and information-processing (Daft and Weick, 1984) literatures to argue that neither a culture of competitiveness nor knowledge devel-opment by itself is sufficient to achieve superior performance in varied market conditions. Instead, these phenomena operate in tandem to achieve desired outcomes. Using data from 201 firms, we apply a sophisticated technique—parsimonious latent-variable interaction modeling (e.g., Ping, 1995)—to highlight the potential value of two phe-nomena that together can facilitate superior cycle time.
THEORETICAL FOUNDATION AND HYPOTHESES
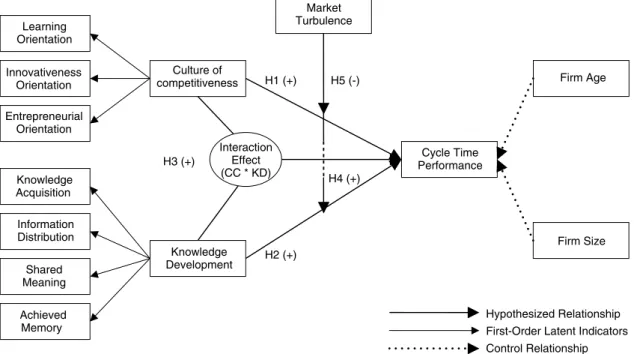
Recent research by Ray et al. (2004) and Schroeder, Bates, and Junttila (2002) highlights the value of examining resources within a firm’s operations management process. In line with this work, Figure 1 presents our conceptual model, which is intended to explain cycle time in supply chains. The model includes two higher-order fac-tors —culture of competitiveness and knowledge development—composed of seven first-order indi-cators (each of which, in turn, has a set of reflective indicators —see Appendix 1), as well as their inter-action. Culture of competitiveness (CC) is defined as the ‘degree to which [supply] chains are pre-disposed to detect and fill gaps between what 1Hult, Ketchen, and Nichols (2002) introduced the concept of ‘cultural competitiveness.’ As an anonymous referee pointed out, the term ‘cultural competitiveness’ seems to denote a comparison of one firm’s competitive characteristics against those of another to see which is more successful. Based on this referee’s sugges-tion, we adopt the term ‘culture of competitiveness.’ This better reflects the underlying concept’s focus on the degree to which values and beliefs centered on customer service are developed. We appreciate the referee’s insights on this issue.
H4 (+) H5 (-) H3 (+) H2 (+) H1 (+) Culture of competitiveness Knowledge Development Innovativeness Orientation Entrepreneurial Orientation Learning Orientation Information Distribution Knowledge Acquisition Shared Meaning Achieved Memory Market Turbulence Cycle Time Performance Firm Age Firm Size Hypothesized Relationship First-Order Latent Indicators Control Relationship Interaction
Effect (CC * KD)
Figure 1. A model of culture of competitiveness, knowledge development, and cycle time performance in supply chains
the market desires and what is currently offered’ (Hultet al., 2002: 577). Drawing on the resource-based view (Wernerfelt, 1984), CC is conceptu-alized as an unobservable latent factor (Godfrey and Hill, 1995) that is reflected in three orienta-tions —innovativeness, entrepreneurial, and learn-ing—that affects performance. The latter orienta-tion—learning—is the critical element that helps integrate CC and knowledge development. Specif-ically, learning orientation focuses on the values and beliefs that direct supply chains toward the behaviors required for knowledge development.
Knowledge development (KD), on the other hand, is a phenomenon wherein actions lead to knowledge acquisition, information distribution, shared meaning, and achieved memory in the sup-ply chain (Hult et al., 2004; cf. Huber, 1991). As such, a learning orientation is reverberated in a set of knowledge-seeking values (Baker and Sinkula, 1999) while KD is reflected by knowledge-producingbehaviors (e.g., Grant, 1996). Research on organizational learning (e.g., Huber, 1991) and information processing (Daft and Weick, 1984) serve as the primary foundation for the four first-order indicators of KD —knowledge acqui-sition, information distribution, shared meaning, and achieved memory—and its higher-order rela-tionship with performance in supply chains. The
broader learning literature (i.e., learning orienta-tion and organizaorienta-tional learning) is the basis for integrating CC and KD in the model (e.g., Argyris and Sch¨on, 1978; Hedberg, 1981; Nystrom and Starbuck, 1984).
Culture of competitiveness in supply chains
As Barney and Mackey (2005: 5) note, the contin-ued theoretical development of the resource-based view requires scholars to not ‘simply correlate aggregate measures of resources’ at the firm level but rather to move their investigations to the levels of analysis ‘where resources reside.’ Thus, theory and empirical attention should be aimed ‘at the level of the resource, not the level of the firm.’ The supply chain offers one such level of analy-sis where resources reside, and resources’ role at this level can be prominent. Indeed, as Hultet al. (2002: 580) observe, because chain members do not all share ‘a common organizational affiliation, the development of unique resources . . . may be vital to chain outcomes.’ In this sense, shared sup-ply chain resources can substitute for traditional features that bind members of a firm, such as struc-ture, culstruc-ture, and strategy (cf. Weick, 1987).
Building on the resource-based view, Hultet al. (2002) argue that a culture of competitiveness
functions as an intangible strategic resource that can be developed by interaction and cooperation among supply chain members. CC provides sup-ply chain members with a pattern of shared values and beliefs that assert the importance of certain elements (and omit others) and drive the chain’s approach to the marketplace. As such, CC is rooted in the broad phenomenon of ‘culture’ but is nar-rowly focused on a distinct set of cultural orienta-tions —entrepreneurial, innovativeness, and learn-ing—that lead supply chains to strategically fill gaps between customers’ future desires and what is currently offered.
An entrepreneurial orientation is defined as the chain members’ values associated with the pur-suit of new market opportunities and the renewal of existing areas of supply chain activities (e.g., Naman and Slevin, 1993). An innovativeness ori-entation refers to supply chain members’ values associated with new idea generation (i.e., mem-bers’ openness to new ideas; Hurley and Hult, 1998). A learning orientation is defined as mem-bers’ values associated with the generation of new insights that have the potential to shape supply chain activities (cf. Huber, 1991). Each of these three orientations is necessary, but individually insufficient, for the emergence of the higher-order intangible strategic resource of culture of com-petitiveness (Hultet al., 2002). Most importantly, rooted in the resource-based view, CC appears to be a valuable, rare, and inimitable strategic resource in supply chains (Barney, 1986; Werner-felt, 1984) that can provide a sustainable compet-itive advantage and enhanced performance (Hult
et al., 2002). Thus, we expect that:
Hypothesis 1: Culture of competitiveness has a positive association with cycle time perfor-mance.
Knowledge development in supply chains
Huber (1991: 90) describes four dimensions that are paramount to learning efforts. Hultet al. (2004) built on these elements to develop a model of knowledge development. The first dimension is knowledge acquisition—the process by which entities, such as organizations or supply chains, obtain wisdom. Information distribution is the pro-cess by which information from different sources is shared. In supply chains, this sharing occurs throughout the chain, including its various nodes
and members (Kohli, Jaworski, and Kumar, 1993). Information interpretation, or shared meaning, is the process by which members develop common understandings about data and events (Corner, Kinicki, and Keats, 1994). Given the lack of a strong culture in typical supply chains, shared meanings of supply chain data and events are needed to harness collective action (Hult et al., 2004). Perhaps the most integral component of KD is ‘organizational memory’ (Huber, 1991), labeled ‘achieved memory’ for the supply chain context by Hultet al. (2004) based on work by Moorman and Miner (1997). Memory is defined as the amount of knowledge, experience, and familiarity with the supply chain process, its operations, and behaviors; it serves as the mechanism by which knowledge is stored for future strategic use and, as such, is critical as a ‘launching’ point for future learning behaviors.
Theory from the organizational information-processing literature provides the basis for expect-ing that, as a group, the four dimensions should enhance supply chain performance. Information-processing theory argues that gathering, process-ing, and interpreting information is the primary job of organized collectivities (Daft and Weick, 1984) such as supply chains (Bowersox et al., 1999). Research on ‘strategic sensemaking’ has extended this argument to demonstrate that information-processing activities profoundly shape the strate-gic decisions made within firms and the resul-tant outcomes (Meyer, 1982; Thomas, Clark, and Gioia, 1993). The knowledge-based view (Grant, 1996) also supports a knowledge development– performance link. Building on the resource-based view’s notions of value, rarity, and inimitability, the knowledge-based view centers on the notion that unique abilities to create and exploit wisdom create competitive advantages and thereby enhance outcomes (e.g., Hultet al., 2004). As such, within the supply chain context, our contention is that:
Hypothesis 2: Knowledge development has a positive association with cycle time performance.
Synergy between culture of competitiveness and knowledge development
The broader learning literature (e.g., Argyris and Sch¨on, 1978; Hedberg, 1981; Nystrom and Star-buck, 1984) serves as the theoretical foundation
for learning being the key integrator of a cul-ture of competitiveness and knowledge develop-ment in supply chains. While Hult et al. (2002, 2004) developed both the CC and KD constructs within supply chains, they did not integrate the two concepts. This is unfortunate because the learning orientation construct within the CC framework is focused on the supply chain’s knowledge-seeking values (Baker and Sinkula, 1999) that guide its knowledge-producing behaviors within the KD development framework (e.g., Grant, 1996; Huber, 1991). As such, learning is both the missing link in the conceptualizations by Hultet al. (2002, 2004) and the resultant integrator of the two frameworks. In other words, their shared concern for learning suggests that neither CC nor KD is sufficient to maximize performance. Instead, they supplement and reinforce each other for a stronger strategic effect than either alone can provide.
For example, Baker and Sinkula (1999: 416) argue that ‘if members of an organization [e.g., supply chain] have an enhanced learning orien-tation, they will not only gather and dissemi-nate information about markets but also constantly examine the quality of their interpretive storage functions and the validity of the dominant logic that guides the entire process.’ At the same time, stressing knowledge-producing behaviors in the supply chain is likely to lead to the ‘culture of com-petitiveness’ infrastructure exemplified by the val-ues inherent in a learning orientation (e.g., Slater and Narver, 1995). Applied within supply chains, the expectation of a synergistic interaction between CC and KD is also consistent with Day’s (1994) inside-out and outside-in processes that center on the strategic interaction between superiority in pro-cess management, integration of knowledge, and diffusion of learning. Based on this logic, we expect that:
Hypothesis 3: The interaction between culture of competitiveness and knowledge development has a positive association with cycle time per-formance.
The moderating role of market turbulence
Starbuck’s (1976) review of organizational task environments provided a wealth of potential dimensions that can affect firm strategy and oper-ations. In our study, we draw from this liter-ature to focus on market turbulence—the rate
of change in the composition of customers and their preferences (Jaworski and Kohli, 1993)—as one critical element of the environment that the-oretically has an influence on the relationships studied in this research (e.g., Dess and Beard, 1984). In addition, we place particular emphasis on the notion that managerial perceptions, particu-larly regarding market uncertainty, shape strategic choice and decision making (Child, 1972; Dun-can, 1972; Lawrence and Lorsch, 1967). Similarly, Sharfman and Dean (1991: 682) state that ‘the environment is those parts of the external infor-mation flow that the firm enacts through attention and belief.’ One logical extension is that environ-mental perceptions and beliefs shape culture and behavior (Dutton and Jackson, 1987).
We expect that this argument also will hold true in supply chains. For example, one of behav-ioral theory’s tenets is that organizational mem-ory is dependent on the conditions in which the firm operates (Cyert and March, 1963; Levitt and March, 1988). Thompson (1967: 159) considered dealing with uncertainty to be the ‘essence of the administrative process.’ Accordingly, supply chains are likely to realize a positive influence of market turbulence on the knowledge develop-ment–cycle time relationship given the dynamic nature of the behaviors involved in KD. Indeed, applying the concept of requisite variety (Ashby, 1956) suggests that, as the environment’s pace of change increases, a premium on developing knowl-edge emerges. Requisite variety means that organi-zational entities, such as supply chains, must match the environment’s complexity with their own inter-nal strategies and activities. A supply chain adept at developing knowledge possesses a greater arse-nal of wisdom for overcoming the complexities created by rapid change than do other supply chains. Thus:
Hypothesis 4: Market turbulence has a positive influence on the relationship between knowledge development and cycle time performance.
Structural contingency theory suggests that the value of a resource depends on the context within which it is deployed (Lawrence and Lorsch, 1967). Building on this general tenet, we expect market turbulence to suppress the culture of the com-petitiveness –performance relationship. As defined above, CC reflects a supply chain’s predisposition to spot and strategically plug gaps between what
the market desires and what the chain currently offers (Hult et al., 2002). Under low levels of tur-bulence, these gaps are relatively consistent and slow developing, suggesting that CC can be effec-tively targeted at filling the gaps. When turbulence is high, however, the market’s desires shift rapidly and unpredictably, leading the gaps that CC seeks to fill to be fluid and nebulous.
Indeed, as Aldrich (1979: 69) stresses, a high level of turbulence ‘leads to externally induced changes . . .that are obscure to administrators and difficult to plan for.’ Weiss and Heide (1993) also note that rapid change in the marketplace can be destructive and detrimental to already-existing cultural competencies (e.g., a culture of competi-tiveness) that are deeply ingrained and embedded in the values and belief system of supply chain members. Thus, while greater market turbulence increases the supply chain’s knowledge develop-ment requiredevelop-ments (Levinthal and March, 1981), greater turbulence in the marketplace also serves as a detriment to a culture of competitiveness. As such, we expect that:
Hypothesis 5: Market turbulence has a negative influence on the relationship between a culture of competitiveness and cycle time performance.
METHOD
Data collection
Prior to collecting the data in 1999, we pretested our scale items with eight academics and seven supply chain management executives. Also, we performed a pilot study with 36 supply manage-ment executives to assess the research design’s quality. These steps resulted in some changes being made, mainly to the instructions to respon-dents and the need to keep the responses anony-mous to secure study participation (i.e., we opted not to code the surveys for identification pur-poses based on concerns raised in the pretests and pilot study). Following Huber and Power’s (1985) guidelines on how to get quality data from key informants, a survey was developed using Dill-man’s (1978) method and administered to sup-ply chain management executives drawn from the membership of the Institute of Supply Manage-ment (ISM). Founded in 1915, ISM is a not-for-profit professional organization of about 45,000
individuals who have responsibilities in supply chain management. ISM is best known for its Purchasing Managers’ Index (PMI)—a composite index of purchasing activity among manufacturing firms that is closely monitored by financial insti-tutions and economists.
We restricted our sample to manufacturing firms, and instructed respondents to focus on the last order fulfillment process within their supply chains. The sampling frame consisted of a total of 2000 supply chain management professionals with 201 responding for an effective response rate of 10.73 percent (127 were non-deliverable). These indi-viduals had been with their firms an average of 11 years, and they represented firms that had existed for an average of 64 years, employed an average of 13,688 people, and had an aver-age of 38 people in their supply manaver-agement unit. The executives who responded had titles such as Director of Purchasing, Director of Pur-chasing and Materials Management, Vice Presi-dent of Procurement, and Chief Purchasing Offi-cer.
We used Armstrong and Overton’s (1977) extrapolation procedure to assess non-response bias. Table 1 summarizes the results. Although we found a significant difference (p <0.05) between the first and fourth quartiles of the respondents for firm age (with early respondents firms’ averaging 55 years and late respondents averaging 74 years), no systematic differences were found between the early and late respondents. Thus, non-response bias is likely not an inhibitor in our analyses.
Measures
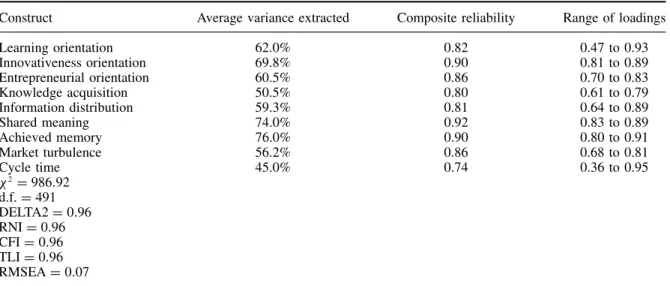
Tables 2 and 3 present the results of the measure-ment assessmeasure-ment. Table 2 summarizes the vari-ables’ means, standard deviations, correlations, and shared variances. Table 3 reports the average variances extracted, construct reliabilities, factor loadings, and fit indices. Established scales were used to measure culture of competitiveness (learn-ing, innovativeness, and entrepreneurial orienta-tions), knowledge development (knowledge acqui-sition, information distribution, shared meaning, and achieved memory), market turbulence, and cycle time performance. Also, firm age and size were included as control variables (e.g., Amburgey and Rao, 1996). Appendix 1 lists the scales used and their sources.
Table 1. Comparison of early and late respondents Respondents N Mean S.D. Learning Early 50 5.67 1.19 orientation Late 51 5.92 0.83 Innovativeness Early 50 5.13 1.23 orientation Late 51 5.08 1.29 Entrepreneurial Early 50 3.97 1.29 orientation Late 51 4.36 1.31 Knowledge Early 50 4.22 1.21 acquisition Late 51 4.19 1.14 Information Early 50 4.62 1.32 distribution Late 51 4.75 1.32 Shared Early 50 4.78 1.11 meaning Late 51 4.78 1.33 Achieved Early 50 5.31 1.12 memory Late 51 5.51 0.87 Market Early 50 4.95 1.21 turbulence Late 51 4.82 1.17
Cycle time Early 50 4.35 0.96
Late 51 4.70 1.09
Firm age∗ Early 50 55.24 42.06
Late 50 74.29 45.39
Firm size Early 50 15158.94 32458.88
Late 50 15625.24 25446.49
∗p <0.05.
All perceptual measures were subjected to assessments of dimensionality, reliability, and validity. The psychometric properties of the nine latent constructs involving 44 items were evaluated simultaneously in one confirmatory factor analysis (CFA) using LISREL 8.80 (J¨oreskoget al., 2000). Additionally, we examined the higher-order struc-ture of CC and KD to provide empirical support, in addition to the theoretical rationale, for the focus on these constructs at the higher-order aggregate level.
Fit of the measurement model
The model fit was evaluated using a series of indices recommended by Gerbing and Anderson (1992) and Hu and Bentler (1999)—the DELTA2, relative noncentrality (RNI), comparative fit (CFI), Tucker–Lewis (TLI), and the root mean square error of approximation (RMSEA) indices. After removing inadequate items (see Appendix 1), an excellent fit to the data was achieved for the first-order based CFA, with DELTA2, RNI, CFI, and
TLI all being 0.96, and RMSEA=0.07 (χ2=
986.92, d.f.=491).
Higher-order cultural competitiveness (CC) and knowledge development (KD) model
Given the theoretical arguments underlying the CC and KD constructs in Figure 1, we next ducted a higher-order assessment of these con-structs, including all purified items, the first-order indicators, and the second-order indicators. The results indicate that, in addition to the item load-ings reported in Table 3 for each of three CC and four KD dimensions, there is support for each construct’s higher-order structure. As such, learn-ing (loadlearn-ing=0.64, t-value=8.26, p <0.01), innovativeness (loading=0.88, t-value=11.25, p <0.01), and entrepreneurship (loading=0.81, t-value=8.91, p <0.01) function as first-order indicators of the higher-order construct of CC (R2s
range from 40% to 78%), where the first-order indicators are composed of the reflective indica-tors included in Appendix 1. Likewise, knowledge acquisition (loading=0.80, t-value=8.72, p < 0.01), information distribution (loading=0.89, t-value=8.62, p <0.01), shared meaning (loading=0.88, t-value=11.82, p <0.01), and achieved memory (loading=0.56,t-value=7.11, p <0.01) function as first-order indicators of the higher-order construct of KD (R2’s range from
31% to 78%). The model fit for the higher-order structure was 0.96 for each of the DELTA2, RNI, CFI, and TLI indices, and 0.08 for RMSEA (χ2=
624.85, d.f.=267).
Composite reliability
We assessed the latent factors’ reliability by cal-culating a composite reliability for each construct (Fornell and Larcker, 1981). The formula specifies that CRη= (λγi)2 (λγi)2+( εi)
where CRη=composite reliability for scale η;
λyi =standardized loading for scale item γi, and
εi =measurement error for scale item γi. Along
with the reliability calculations, we also examined the parameter estimates and their associated t -values as well as the average variances extracted
Table 2. Means, standard deviations, correlations, and shared variances (n=201)
Mean S.D. LO IN EO KA ID SM AM MT CT AGE SIZE
Learning orientation (LO) 5.88 0.98 — 0.30 0.11 0.12 0.12 0.14 0.17 0.00 0.11 0.00 0.00 Innovativeness orientation (IO) 5.33 1.13 0.55 — 0.41 0.19 0.24 0.30 0.22 0.00 0.19 0.01 0.04 Entrepreneurial orientation (EO) 4.43 1.27 0.33 0.64 — 0.29 0.25 0.31 0.20 0.01 0.22 0.02 0.04 Knowledge acquisition (KA) 4.33 1.15 0.34 0.44 0.52 — 0.49 0.37 0.18 0.08 0.18 0.01 0.03 Information distribution (ID) 4.84 1.22 0.35 0.49 0.50 0.70 — 0.46 0.24 0.05 0.04 0.00 0.06 Shared meaning (SM) 4.99 1.16 0.37 0.55 0.56 0.61 0.68 — 0.23 0.01 0.14 0.00 0.06 Achieved memory (AM) 5.55 1.00 0.41 0.47 0.45 0.42 0.49 0.48 — 0.03 0.12 0.01 0.02 Market turbulence (MT) 4.72 1.18 0.04 0.06 0.12 0.29 0.22 0.11 0.17 — 0.01 0.00 0.01 Cycle time (CT) 4.57 1.06 0.33 0.44 0.47 0.42 0.40 0.37 0.34 0.11 — 0.02 0.06
Firm age (AGE) 63.62 43.27 −0.04 −0.12 −0.14 −0.09 −0.06 −0.06 −0.08 −0.02 −0.14 — 0.13
Firm size (SIZE) 13,688 32,948 −0.05 −0.20 −0.20 −0.18 −0.24 −0.25 −0.15 0.09 −0.24 0.36 —
The correlations are included in the lower triangle of the matrix. All correlations≥0.14 are significant at thep <0.05 level. Shared variances are included in the upper triangle of the matrix.
Table 3. Summary statistics of the confirmatory factor analysis (n=201)
Construct Average variance extracted Composite reliability Range of loadings
Learning orientation 62.0% 0.82 0.47 to 0.93 Innovativeness orientation 69.8% 0.90 0.81 to 0.89 Entrepreneurial orientation 60.5% 0.86 0.70 to 0.83 Knowledge acquisition 50.5% 0.80 0.61 to 0.79 Information distribution 59.3% 0.81 0.64 to 0.89 Shared meaning 74.0% 0.92 0.83 to 0.89 Achieved memory 76.0% 0.90 0.80 to 0.91 Market turbulence 56.2% 0.86 0.68 to 0.81 Cycle time 45.0% 0.74 0.36 to 0.95 χ2=986.92 d.f.=491 DELTA2=0.96 RNI=0.96 CFI=0.96 TLI=0.96 RMSEA=0.07
(Anderson and Gerbing, 1988). Average variance extracted was calculated as
Vη= λγi2 λγi2+ εi
whereVη=average variance extracted forη;λyi =
standardized loading for scale item γi, and εi =
measurement error for scale item γi. The scales’
reliabilities ranged from 0.74 to 0.92, the factor loadings ranged from 0.36 to 0.95 (p <0.01), and the average variances extracted ranged from 45 to 76 percent (Table 3). The 34 purified items were also found to be reliable and valid when evaluated based on each item’s error variance, modification index, and residual covariation.
Discriminant validity
Following the reliability analysis, we established discriminant validity by two independent methods. First, we calculated the shared variance between each pair of constructs and verified that it was lower than the variances extracted for the involved constructs (Fornell and Larcker, 1981). Shared variance was calculated as
γ2=1−ψ
where γ2=shared variance between constructs,
and with the diagonal element ofψ indicating the amount of unexplained variance. Because η and ε were standardized, γ2 was equal to the squared
correlation between the two constructs. As shown in Table 3, the average variances extracted were above 50 percent for all but one construct (cycle time, 45%). The shared variances between pairs of all possible scale combinations indicated that the average variances extracted were higher than the associated shared variance in all cases (Table 2).
Second, we examined all possible pairs of con-structs, as suggested by Bagozzi and Phillips (1982), in a series of two-factor CFA models using LISREL 8.80. Specifically, each pairwise CFA model was run twice: first, constraining theφ coef-ficient to unity; and second, allowing φ to vary freely. Based on the results of a χ2 difference
test, the unconstrained model performed signifi-cantly better than the associated constrained model whenφ =1 (i.e., χ2
(1)>3.84 was exceeded in
all cases). The lowestχ2
(1) was found between
knowledge acquisition and information distribution (χ2
(1)=32.06).
Finally, as detailed in Appendix 2, assessment at the measurement level found no evidence of com-mon method variance. Appendix 2 also describes a more sensitive test conducted at the hypothesis level. Overall, the nine measures and their 34 puri-fied indicators were found to be reliable and valid in the context of this study.
ANALYSIS AND RESULTS
Table 4 summarizes the results. Hypothesis testing was accomplished via two techniques: (1) hierarchical regression; and (2) a parsimonious latent-variable interaction technique (e.g., Ping, 1995) via LISREL 8.80. This dual testing allows
for a robust assessment of the hypotheses, within the different strengths and constraints of each tech-nique (e.g., Shook et al., 2004). For example, on the one hand, hierarchical regression allows the direct assessment of change in explanatory power between iterative steps (which we cannot accom-plish definitively using SEM given that our step 1 equation, for example, is saturated). Further, as a traditional technique, it provides a baseline set of results for our predictions. On the other hand, the more complex ‘parsimonious latent-variable interaction technique’ allows for the inclusion of measurement errors and indicators of the higher-order factors, and can account for potential CMV problems (e.g., Netemeyeret al., 1997; Podsakoff
et al., 2003).
Hierarchical moderator regression analysis
As a first step in testing the hypotheses, we used hierarchical regression. Because three interaction terms were included in the equation, we standard-ized all variables to reduce the potential effects of multicollinearity (Cohen et al., 2003). The tech-nique of least squares was used with the control variables entered as a block in step 1 (firm age and size), followed by the main effects in step 2 (cul-ture of competitiveness, knowledge development, and market turbulence), and the interaction and moderators in step 3. Specifically, the following regression equation was analyzed in three hierar-chical steps:
Y1=α+β1X1+β2X2+β3X3+β4X4+β5X5 +β6X4X5+β7X3X4+β8X3X5+ε
where Y1=cycle time performance (CT), α=
intercept, X1=firm age (AGE), X2=firm size
(SIZE), X3=market turbulence (MT),
X4=culture of competitiveness (CC),
X5=knowledge development (KD), and
ε=random disturbance terms. Consistent with the literature on simultaneous testing of main effects along with their interactions, we examined each main effect (CC → CT and KD → CT) as the effect of a given predictor when the predictor it interacts with is at its mean (Aiken and West, 1991). As such, we discuss the main effect regres-sion results of CC conditioned on the notion that KD is at its mean, and vice versa.
Within the regression testing, market turbulence was created as a summated index. In addition,
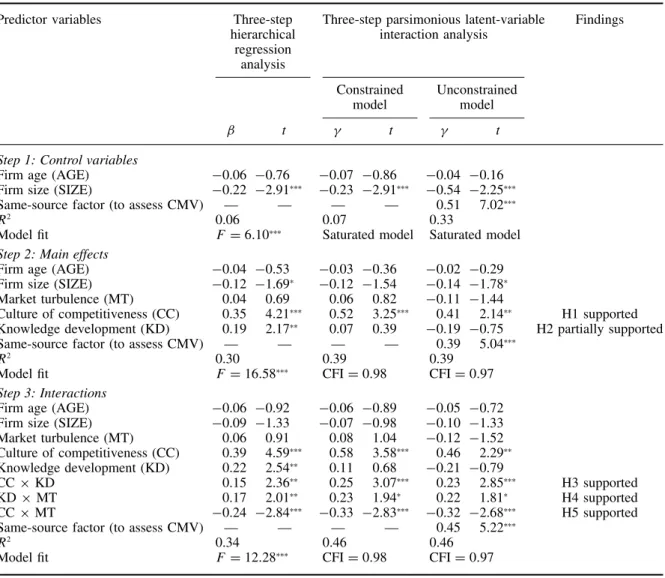
Table 4. Standardized results of the hypothesis testing with cycle time as the criterion variable (n=201)
Predictor variables Three-step
hierarchical regression
analysis
Three-step parsimonious latent-variable interaction analysis Findings Constrained model Unconstrained model β t γ t γ t
Step 1: Control variables
Firm age (AGE) −0.06 −0.76 −0.07 −0.86 −0.04 −0.16
Firm size (SIZE) −0.22 −2.91∗∗∗ −0.23 −2.91∗∗∗ −0.54 −2.25∗∗∗
Same-source factor (to assess CMV) — — — — 0.51 7.02∗∗∗
R2 0.06 0.07 0.33
Model fit F=6.10∗∗∗ Saturated model Saturated model
Step 2: Main effects
Firm age (AGE) −0.04 −0.53 −0.03 −0.36 −0.02 −0.29
Firm size (SIZE) −0.12 −1.69∗ −0.12 −1.54 −0.14 −1.78∗
Market turbulence (MT) 0.04 0.69 0.06 0.82 −0.11 −1.44
Culture of competitiveness (CC) 0.35 4.21∗∗∗ 0.52 3.25∗∗∗ 0.41 2.14∗∗ H1 supported
Knowledge development (KD) 0.19 2.17∗∗ 0.07 0.39 −0.19 −0.75 H2 partially supported
Same-source factor (to assess CMV) — — — — 0.39 5.04∗∗∗
R2 0.30 0.39 0.39
Model fit F=16.58∗∗∗ CFI=0.98 CFI=0.97
Step 3: Interactions
Firm age (AGE) −0.06 −0.92 −0.06 −0.89 −0.05 −0.72
Firm size (SIZE) −0.09 −1.33 −0.07 −0.98 −0.10 −1.33
Market turbulence (MT) 0.06 0.91 0.08 1.04 −0.12 −1.52 Culture of competitiveness (CC) 0.39 4.59∗∗∗ 0.58 3.58∗∗∗ 0.46 2.29∗∗ Knowledge development (KD) 0.22 2.54∗∗ 0.11 0.68 −0.21 −0.79 CC×KD 0.15 2.36∗∗ 0.25 3.07∗∗∗ 0.23 2.85∗∗∗ H3 supported KD×MT 0.17 2.01∗∗ 0.23 1.94∗ 0.22 1.81∗ H4 supported CC×MT −0.24 −2.84∗∗∗ −0.33 −2.83∗∗∗ −0.32 −2.68∗∗∗ H5 supported
Same-source factor (to assess CMV) — — — — 0.45 5.22∗∗∗
R2 0.34 0.46 0.46
Model fit F=12.28∗∗∗ CFI=0.98 CFI=0.97
∗∗∗p <0.01;∗∗p <0.05;∗p <0.10.
based on the higher-order analysis of the measures, empirical justification exists (in addition to the the-oretical foundation; Hult et al., 2002; cf. Hult and Ketchen, 2001) to create a summated index of CC based on the three dimensions of learning, inno-vativeness, and entrepreneurial orientations, with each construct weighted at one-third. Likewise, KD was assessed via an index composed of knowl-edge acquisition, information distribution, shared meaning, and achieved memory weighted equally based on both empirical and theoretical rationale (e.g., Huber, 1991; Hult et al., 2004).
Together with the regression results, we exam-ined the variance inflation factors (VIF) to assess the likelihood that multicollinearity affects the results. In each of the three steps in the hierarchical
regression model, the VIFs were lower than 2.10, indicating that multicollinearity does not affect the weights of the controls or hypothesized variables (Mason and Perreault, 1991). To assess Hypotheses 1 and 2, we first examined the results in step 2. In this step, both CC (p <0.01) and KD (p <0.05), when entered along with market turbulence, are significantly associated with cycle time, providing initial support for both Hypothesis 1 and Hypothe-sis 2. The inclusion of market turbulence, CC, and KD in step 2 of the model explained significant variance in cycle time beyond that explained by the control variables in step 1 (p <0.01), with the step 2 equation explaining a total ofR2=0.30.
The results of Hypotheses 1 and 2 are shown to be robust when the full model is specified in step 3
to assess Hypotheses 3, 4, and 5. Specifically, the main effects of CC and KD as well as the hypoth-esized interaction term of CC × KD (p <0.05) and the moderators of KD×MT (p <0.005) and CC×MT (p <0.01) had significant associations with cycle time. Age, size, and market turbulence had no direct association with cycle time. Given that the direct relationship between MT → CT is insignificant, the results indicate that MT serves as a pure moderator of the CC→CT (negative) and the KD → CT (positive) relationships (Sharma, Durand, and Gur-Arie, 1981). The inclusion of the interaction and moderator terms (CC×KD, KD× MT, and CC×MT) in step 3 explained significant variance beyond step 2 (R2=0.04, p <0.01).
The fully specified model (i.e., including steps 1, 2, and 3) resulted inR2=0.34 (p <0.01). Overall,
all five hypotheses were supported in the hierar-chical regression analysis.
Parsimonious latent-variable interaction analysis
As a second step in testing the hypotheses, we used a parsimonious latent-variable interaction tech-nique via LISREL 8.80. This techtech-nique, devel-oped by Ping (1995, 1998), is a more parsimo-nious estimation technique for latent interaction and quadratic variables than its predecessors by Kenny and Judd (1984) and Hayduk (1987). Our use of this technique to examine the hypothe-ses adds to the hierarchical regression analysis in two ways. First, the latent-variable technique allows us to incorporate measurement errors for the main and interaction effects (Ping, 1995, 1998) in order to assess whether such errors under-mine any statistical significant links within the results (Busemeyer and Jones, 1983). Second, we are able to incorporate a test of potential CMV issues at the hypothesis-testing level to determine whether CMV inflates or curtails the magnitude of the obtained effects (e.g., Netermeyer et al., 1997; Podsakoffet al., 2003). Appendix 2 contains details on this analysis.
The results of the parsimonious latent-variable interaction analyses mirror those in the hierarchi-cal regression analysis, with the exception that KD is not significant in either the unconstrained or the constrained models (i.e., Hypothesis 2 is not sup-ported). Consistent with the hierarchical regression analysis, we followed Ganzach’s (1997) hierarchi-cal procedure to SEM testing to estimate whether
the inclusion of main and interaction effects is empirically meaningful (the results for each of the three steps are included in Table 4).
In the full three-step and constrained model, the results indicate that CC (p <0.01) and the hypothesized interaction term CC × KD (p < 0.01) as well as the two moderators of KD × MT (p <0.10) and CC × MT (p <0.01) had significant relations with cycle time (R2=0.46;
χ2=83.63, d.f.=48, DELTA2, RNI, CFI, and
TLI all=0.98, RMSEA=0.06). Likewise, in the unconstrained model, the results indicate that CC (p <0.05), the interaction term CC × KD (p < 0.01), the two moderators of KD × MT (p < 0.10) and CC × MT (p <0.01), and the ‘same-source’ factor (p <0.01) had a significant asso-ciation with cycle time (R2=0.46;χ2=120.20,
d.f.=53, DELTA2, RNI, CFI, and TLI all=0.97, RMSEA=0.08). The results for steps 1 and 2 are also included in Table 4 for completeness. In comparing steps 2 and 3, using the method devised by McCallum and Mar (1995), the third step in both the constrained and unconstrained models explained an additional 7 percent of vari-ance beyond that explained by earlier steps.
These results verify that the strengths of the Hypotheses 1, 3, 4, and 5 paths were consistent and supported across the hierarchical regression and parsimonious latent-variable interaction analyses. However, Hypothesis 2 was supported in the hier-archical regression analysis only. Finally, based on an anonymous referee’s suggestion, we checked whether our model had greater explanatory value than a simpler model wherein all first-order fac-tors (i.e., LO, IO, EO, KA, ID, SM, and AM) along with the controls (e.g., AGE, SIZE, MT) and the moderators (e.g., CC × KD, KD × MT, CC × MT) were allowed to affect cycle time directly. In this path model test, the three mod-erators of CC × KD (parameter estimate=0.14, p <0.05), KD × MT (PE=0.17, p <0.01), and CC × MT (PE= −0.24, p <0.01) along with EO (PE=0.23, p <0.01) and KA (PE= 0.15,p <0.01) were the only significant variables (R2=0.35). Overall, the higher-order model had
a greater explanatory power than the direct model (R2=0.46 vs.R2=0.35), lending support to our
conceptualization of higher-order structures of at least CC and potentially KD (at least in its mod-erated format).
DISCUSSION
Some caveats apply to our findings. We were unable to draw on objective indicators of per-formance due to informants’ concerns about the sensitivity of that information. Also, the inferences that can be drawn from the results are restricted by use of cross-sectional data drawn from key infor-mants. Using multiple informants from each firm over time would likely enhance the robustness of future studies, especially in light of the fact that objective supply chain performance data are often not available. Also, our study tapped into one firm in a supply chain, limiting our ability to fully cap-ture our variables for entire chains. Despite these limitations, the results offer important steps in building knowledge about ‘strategic supply chain management’ in general and about why some sup-ply chains outperform others in particular. Below, we discuss the implications of our findings. Specif-ically, we focus on (1) the main effects of CC and KD (i.e., Hypotheses 1 and 2) for cycle time performance, (2) the interaction between CC and KD (Hypothesis 3), and (3) the moderating role of market turbulence (Hypotheses 4 and 5). Man-agers should recognize that the importance of the normative implications we offer below is tied to the extent to which their firms compete based on cycle time.
Culture of competitiveness, knowledge development, and cycle time performance
Our initial predictions examined the potential main effects relating culture of competitiveness (Hypoth-esis 1) and knowledge development (Hypoth(Hypoth-esis 2) to cycle time performance. Both analyses we conducted supported the main effect for CC, but only the hierarchical regression analysis supported the main effect for KD. This set of findings can be addressed from both a technical perspective and from a substantive, conceptual perspective. In terms of technical issues, structural equation takes into account the potential error variances in mea-surement, whereas regression does not. Thus, it may be that SEM simply offers a more precise test, suggesting that its results for Hypothesis 2 are the ones in which we should have confidence. As such, it is reasonable to conclude that CC has a direct link with cycle time (as shown in the tests of Hypothesis 1) but KD does not.
In terms of substantive issues, this conclusion offers implications for firms, especially those that are interested in gaining the benefits of strate-gic supply chain management, but whose supply chains currently rate poorly in terms of CC and KD. Dramatic reorientations of supply chains are difficult to accomplish (Hult et al., 2002), and it is unlikely that the lack of both elements can be remedied quickly. Our results suggest that such firms might benefit by building a culture of com-petitiveness first, and then emphasizing knowledge development once the cultural elements are estab-lished. This would ensure that the firm enjoys at least some cycle time reduction benefits as soon as possible. Achieving such benefits is valuable strategically because of cycle time’s links with profits and other firm-level metrics (Handfield and Nichols, 2002).
The interaction between culture of
competitiveness and knowledge development
Building on two recent works on ‘culture of com-petitiveness’ (Hult et al., 2002) and ‘knowledge development’ (Hult et al., 2004) as vehicles to improve cycle time performance in supply chains, we used the learning component that is at the core of both the CC and KD frameworks to link these elements. Specifically, we drew on the resource-based view and theories from organizational learn-ing and information processlearn-ing to offer a the-oretical delineation that integrates the concepts and predicted an interaction effect (Hypothesis 3). The results showed that the CC–KD interaction explains a significant amount of variance in cycle time above and beyond individual effects. These findings suggest that neither a culture of competi-tiveness, nor knowledge development, by itself is sufficient to achieve the supply chain performance goals examined by Hultet al. (2002, 2004).
Based on the results of Hypotheses 1 and 2, we suggested above that firms that are launch-ing a strategic supply chain management approach should focus first on building CC and then pur-sue KD initiatives. The results for Hypothesis 3 indicate that once both foundational elements are in place, potential synergies between CC and KD can be exploited in order to gain additional cycle time performance. The results also inform firms
whose supply chains are currently good at knowl-edge development, but that have not yet estab-lished much of a culture across supply chain mem-bers. These firms are likely to find that stressing knowledge development without a reinforcing cul-ture will not significantly enhance cycle time. Such firms should focus attention on developing shared beliefs and values across their supply chains.
We view learning as central to these processes. Learning is the concept that links CC and KD. As such, it may be the linchpin for firms seeking to exploit synergies between CC and KD. Learning in the CC context is manifested in a set of knowledge-seeking values (Baker and Sinkula, 1999), while learning in the KD context is manifested in a set of knowledge-producing behaviors (e.g., Huber, 1991). These values perform a dual role as the learning element of CC while also being the glue that centers innovativeness and entrepreneurial ori-entations on supply chains’ competitiveness in the marketplace.
Similarly, the learning behaviors within the KD framework (i.e., knowledge acquisition and infor-mation distribution) also serve in a dual capac-ity. Specifically, they are the main knowledge-producing activities as well as the cultural builders of a ‘common affiliation’ that facilitates members arriving at shared meanings and the effective stor-age of new knowledge in achieved memory (cf. Daft and Lengel, 1986; Gioia and Thomas, 1996). Thus, supply chain members’ desire to acquire knowledge and then distribute it to other mem-bers provides a mechanism to achieve a bonding that has been found to be critical in complex sup-ply chain relationships (Anderson, H˚akansson, and Johanson, 1994).
The moderating role of market turbulence
The tests of Hypotheses 4 and 5 revealed that mar-ket turbulence moderates the effects of both CC and KD, although one caveat is that the results involving KD were weakly supported (p <0.10) in our SEM analysis. These findings are critical to understanding what drives supply chain success. For example, on the one hand, the results indi-cate that a firm that devotes a great deal of effort on developing a supply chain culture focused on satisfying the market (i.e., a culture of competi-tiveness) is likely to reap positive advantages in stable market environments, but will fall behind when market turbulence is strong (cf. Slone, 2004).
On the other hand, firms that focus on develop-ing appropriate knowledge development behaviors reap lesser results in stable environments (i.e., their supply chains are not able to take full advantage of their superior learning skills) but are likely to reap greater advantages in turbulent markets (because they are prone to knowledge seeking and establish-ing the requisite variety needed to operate effec-tively in turbulent market conditions).
The results suggest that managers who are con-fident in their sense about the level of market tur-bulence they will face can use this sense to decide whether to emphasize developing either CC or KD in their supply chains. For those firms whose man-agers are unlikely to be able to predict the degree of turbulence that will be present in their mar-ketplace over time, learning efforts centered on both CC and KD are critical to sustained suc-cess (cf. Lee, 2004). In fact, our results would tend to suggest that supply chains that develop strong elements of both a culture of competitive-ness and knowledge development may be able to offset the effects that the environment has on their operations (at least with respect to market turbu-lence; other aspects of environmental turbulence need to be investigated in future research to better understand the full potential value of the syner-gistic effect of a culture of competitiveness and knowledge development). From a resource-based perspective, a supply chain’s unique confluence of a culture of competitiveness and knowledge devel-opment seems likely to provide the high level of inimitability that is required to establish a sustain-able competitive advantage (cf. Barney, 1991; Ray
et al., 2004; Schroederet al., 2002).
CONCLUSION
One of the central trends in today’s economy is that competition is becoming less ‘firm vs. firm’ and more ‘supply chain vs. supply chain.’ Indeed, firms such as Dell and Wal-Mart have, in essence, rewrit-ten the rules of strategy and rivalry in their respec-tive industries through using supply chains not just as a means for moving material, but also as a com-petitive weapon. Drawing on multiple theories, our study advances the emerging research stream on strategic supply chain management by shedding new light on why some firms outperform others in terms of cycle time. Given that supply chain activi-ties shape firms’ profits, growth, market share, and
other key metrics (Handfield and Nichols, 2002), closing the gap between what we know and what we need to know about the determinants of cycle time across multiple firms is important. While past inquiry suggests independent roles for a culture of competitiveness and knowledge development, our results highlight the criticality of simultaneously considering these two concepts and market turbu-lence in order to minimize cycle time.
ACKNOWLEDGEMENTS
This research was supported by FedEx, the Insti-tute of Supply Management (ISM), the Center for International Business Education and Research at Michigan State University (MSU-CIBER) and the Lowder Center for Family Business and Entre-preneurship at Auburn University.
REFERENCES
Aiken LS, West SG. 1991. Multiple Regression: Testing and Interpreting Interactions. Sage: Newbury Park, CA.
Aldrich HE. 1979. Organizations and Environments. Prentice-Hall: Englewood Cliffs, NJ.
Amburgey TL, Rao H. 1996. Organizational ecology: past, present, and future directions. Academy of Management Journal 39(5): 1265 – 1286.
Anderson JC, Cleveland GC, Schroeder RG. 1989. Oper-ations strategy: a literature review.Journal of Opera-tions Management 8(2): 133 – 158.
Anderson JC, Gerbing DW. 1988. Structural equation modeling in practice: a review and recommended two-step approach. Psychological Bulletin 103(3): 411 – 423.
Anderson JC, H˚akansson H, Johanson J. 1994. Dyadic business relationships within a business network context.Journal of Marketing58: (October): 1 – 15. Argyris C, Sch¨on DA. 1978. Organizational Learning:
A Theory of Action Perspective. Addison-Wesley: Reading, MA.
Armstrong JS, Overton TS. 1977. Estimating nonre-sponse bias in mail surveys. Journal of Marketing Research 14: (August): 396 – 402.
Ashby WR. 1956.An Introduction to Cybernetics. Wiley: New York.
Bagozzi RP, Phillips LW. 1982. Representing and testing organizational theories: a holistic construal. Administrative Science Quarterly 27: (September): 459 – 489.
Baker WE, Sinkula JM. 1999. The synergistic effect of market orientation and learning orientation on organizational performance. Journal of the Academy of Marketing Science27: (Fall): 411 – 427.
Barney JB. 1986. Organizational culture: can it be a source of sustained competitive advantage?Academy of Management Review 11(3): 656 – 665.
Barney JB. 1991. Firm resources and sustained com-petitive advantage. Journal of Management 17(3): 99 – 120.
Barney JB, Mackey TB. 2005. Testing resource-based theory. In Research Methodology in Strategy and Management, Vol. 2, Ketchen DJ, Bergh DD (eds). Elsevier: New York; 1 – 13.
Bowersox DJ, Closs DJ, Stank TP. 1999. 21st Century Logistics: Making Supply Chain Integration a Reality. Council of Supply Chain Management Professionals: Oak Brook, IL.
Busemeyer JR, Jones LE. 1983. Analysis of multiplica-tive combination rules when the causal variables are measured with error. Psychological Bulletin 93(3): 549 – 562.
Child J. 1972. Organizational structure, environment, and performance: the role of strategic choice. Sociology
6(1): 1 – 22.
Cohen J, Cohen P, West SG, Aiken LS. 2003. Applied Multiple Regression/Correlation Analysis for the Behavioral Sciences(3rd edn). Erlbaum: Mahwah, NJ. Corner PD, Kinicki AJ, Keats BW. 1994. Integrating organizational and individual information processing perspectives on choice. Organization Science 5(3): 294 – 308.
Cyert RM, March JG. 1963.A Behavioral Theory of the Firm.Prentice-Hall: New York.
Daft RL, Lengel RH. 1986. Organizational information requirements, media richness, and structural design. Management Science32(5): 554 – 571.
Daft RL, Weick KE. 1984. Toward a model of
organizations as interpretation systems. Academy of Management Review 9(2): 284 – 295.
Day GS. 1994. The capabilities of market-driven organizations. Journal of Marketing 58: (October): 37 – 52.
Dess GG, Beard DW. 1984. Dimensions of organi-zational task environments. Administrative Science Quarterly29(1): 52 – 73.
Dillman DA. 1978. Mail and Telephone Surveys: The Total Design Method.Wiley: New York.
Duncan RB. 1972. Characteristics of organizational envi-ronments and perceived environmental uncertainty. Administrative Science Quarterly 17(3): 313 – 327. Dutton JE, Jackson SE. 1987. Categorizing strategic
issues: links to organizational action. Academy of Management Review 12(1): 76 – 90.
Fornell C, Larcker DF. 1981. Evaluating structural equation models with unobservable variables and measurement error.Journal of Marketing Research18: (February): 39 – 50.
Ganzach Y. 1997. Misleading interaction and curvilinear terms.Psychological Methods 2(3): 235 – 247. Gerbing DW, Anderson JC. 1992. Monte Carlo
eval-uations of goodness of fit indices for structural equation models.Sociological Methods and Research
21: (November): 132 – 160.
Gioia DA, Thomas JB. 1996. Identity, image, and issue interpretation: sensemaking during strategic change
in academia.Administrative Science Quarterly 41(3): 370 – 403.
Godfrey PC, Hill CWL. 1995. The problem of unob-servables in strategic management research.Strategic Management Journal 16(7): 519 – 533.
Grant RM. 1996. Toward a knowledge-based theory of the firm. Strategic Management Journal, Winter Special Issue17: 109 – 122.
Handfield RB, Nichols EL. 2002.Supply Chain Redesign: Transforming Design Chains into Integrated Value Sys-tems. Financial Times – Prentice-Hall: Upper Saddle River, NJ.
Hayduk LA. 1987. Structural Equation Modeling with LISREL: Essentials and Advances. Johns Hopkins Press: Baltimore, MD.
Hedberg B. 1981. How organizations learn and unlearn. InHandbook of Organizational Design, Nystrom PC, Starbuck WH (eds). Oxford University Press: New York; 3 – 27.
Hendricks KB, Singhal VR. 2003. The effect of supply chain glitches on shareholder wealth. Journal of Operations Management21(5): 501 – 522.
Hitt M, Boyd B, Li D. 2004. The state of strategic management research and a vision of the future. In Research Methodology in Strategy and Management, Vol. 1, Ketchen DJ, Bergh D (eds). Elsevier: New York; 1 – 31.
Hu L, Bentler PM. 1999. Cutoff criteria for fit indexes in covariance structure analysis: conventional criteria versus new alternatives.Structural Equation Modeling
6(1): 1 – 55.
Huber GP. 1991. Organizational learning: the contribut-ing processes and the literatures.Organization Science
2(1): 88 – 115.
Huber GP, Power DJ. 1985. Retrospective reports of strategic-level managers: guidelines for increas-ing accuracy. Strategic Management Journal 6(2): 171 – 180.
Hult GTM. 1998. Managing the international strategic sourcing function as a market-driven organizational learning system.Decision Sciences 29(1): 193 – 216. Hult GTM, Ketchen DJ. 2001. Does market orientation
matter? A test of the relationship between positional advantage and performance. Strategic Management Journal 22(9): 899 – 906.
Hult GTM, Ketchen DJ, Nichols EL Jr. 2002. An examination of a culture of competitiveness and order fulfillment cycle time within supply chains.Academy of Management Journal 45(3): 577 – 586.
Hult GTM, Ketchen DJ, Slater SF. 2004. Information processing, knowledge development, and strategic supply chain performance. Academy of Management Journal 47(2): 241 – 253.
Hurley RF, Hult GTM. 1998. Innovation, market orien-tation, and organizational learning: an integration and empirical examination. Journal of Marketing 62(3): 42 – 54.
Jaworski BJ, Kohli AK. 1993. Market orientation: antecedents and consequences.Journal of Marketing
52: (July): 53 – 70.
J¨oreskog KG, S¨orbom D, Du Toit S, Du Toit M. 2000. LISREL 8: New Statistical Features (2nd edn). Scientific Software International: Chicago, IL. Kenny D, Judd CM. 1984. Estimating the nonlinear and
interactive effects of latent variables. Psychological Bulletin 96: (July): 201 – 210.
Kohli AK, Jaworski BJ, Kumar A. 1993. MARKOR: a measure of market orientation. Journal of Marketing Research 15: (November): 467 – 477.
Lawrence PR, Lorsch JW. 1967.Organization and Envi-ronment: Managing Differentiation and Integration. Harvard University Press: Cambridge, MA.
Lee HL. 2004. The triple-a supply chain. Harvard Business Review 83: (October): 102 – 112.
Levinthal D, March JG. 1981. A model of adaptive organizational search. Journal of Economic Behavior and Organization 2(4): 307 – 333.
Levitt B, March JG. 1988. Organizational learning. Annual Review of Sociology14: 319 – 340.
Mason CH, Perreault WD Jr. 1991. Collinearity, power, and interpretation of multiple regression analy-sis. Journal of Marketing Research 28: (August): 268 – 280.
McCallum R, Mar CM. 1995. Distinguishing between moderator and quadratic effects in multiple regression. Psychological Bulletin 118(3): 405 – 421.
Meyer AD. 1982. Adapting to environmental jolts. Administrative Science Quarterly 27(4): 515 – 536. Moorman C, Miner AS. 1997. The impact of
organiza-tional memory on new product performance and cre-ativity.Journal of Marketing Research34: (February): 91 – 106.
Naman JL, Slevin DP. 1993. Entrepreneurship and the concept of fit: a model and empirical tests.Strategic Management Journal 14(2): 137 – 154.
Netemeyer RG, Boles JS, McKee DO, McMurrian R. 1997. An investigation into the antecedents of organizational citizenship behaviors in a personal selling context. Journal of Marketing 61: (July): 85 – 98.
Nichols EL Jr, Retzlaff-Roberts D, Frolick MN. 1996.
Reducing order fulfillment cycle time in an
international supply chain.Cycle Time Research2(1): 13 – 28.
Nystrom PC, Starbuck WH. 1984. To avoid organiza-tional crisis, unlearn. Organizational Dynamics 13: (Spring): 53 – 65.
Ping RA. 1995. A parsimonious estimating technique for interaction and quadratic latent variables. Journal of Marketing Research32(3): 336 – 347.
Ping RA. 1998. EQS and LISREL examples using survey data. In Interactions and Nonlinear Effects in Structural Equation Modeling, Schumacker RE,
Marcoulides GA (eds). Erlbaum: Mahwah, NJ;
63 – 100.
Podsakoff PM, Organ DW. 1986. Self-reports in organi-zational research: problems and prospects.Journal of Management 12(4): 531 – 544.
Podsakoff PM, McKenzie SB, Lee J-Y, Podsakoff NP. 2003. Common method biases in behavioral research: a critical review of the literature and recommended
remedies. Journal of Applied Psychology 88(5): 879 – 903.
Ray G, Barney JB, Muhanna WA. 2004. Capabilities, business processes, and competitive advantage: choosing the dependent variable in empirical tests of the resource-based view. Strategic Management Journal 25(1): 23 – 37.
Rumelt RP, Schendel DE, Teece DJ. 1994. Fundamental issues in strategy. InFundamental Issues in Strategy: A Research Agenda, Rumelt RP, Schendel DE, Teece DJ (eds). Harvard Business School Press: Boston, MA; 9 – 47.
Schroeder RG, Bates KA, Junttila MA. 2002. A resource-based view of manufacturing strategy and the relationship to manufacturing processes. Strategic Management Journal 23(2): 105 – 117.
Sharfman MP, Dean JW Jr. 1991. Measuring and
conceptualizing the environment: a multi-dimensional approach.Journal of Management 17(4): 681 – 700. Sharma S, Durand RM, Gur-Arie O. 1981. Identification
and analysis of moderator variables. Journal of Marketing Research18(3): 291 – 300.
Shook CL, Ketchen DJ, Hult GTM, Kacmar KM. 2004. An assessment of the use of structural equation modeling in strategic management research.Strategic Management Journal 25(4): 397 – 404.
Slater SF, Narver JC. 1995. Market orientation and the learning organization. Journal of Marketing 59(3): 63 – 74.
Slone RE. 2004. Leading a supply chain turnaround. Harvard Business Review 83: (October): 114 – 121. Starbuck WH. 1976. Organizations and their
environ-ments. In Handbook of Industrial and Organiza-tional Psychology, Dunette MD (ed). Rand McNally: Chicago, IL; 345 – 354.
Summer C, Bettis R, Duhaime I, Grant J, Hambrick D, Snow C, Zeithaml C. 1990. Doctoral education in the field of business policy and strategy. Journal of Management 16(6): 361 – 398.
Thomas JB, Clark SM, Gioia DA. 1993. Strategic sense-making and organizational performance: linkages among scanning, interpretation, action, and
perfor-mance. Academy of Management Journal 36(2):
239 – 270.
Thompson JD. 1967. Organizations in Action: Social Science Bases of Administrative Theory. McGraw-Hill: New York.
Weick K. 1987. Substitutes for strategy. In The Competitive Challenge, Teece DJ (ed). Ballinger: Cambridge, MA; 221 – 234.
Weiss AM, Heide JB. 1993. The nature of organizational search in high technology markets. Journal of Marketing Research30(2): 220 – 233.
Wernerfelt B. 1984. A resource-based view of the firm. Strategic Management Journal 5(2): 171 – 180.
APPENDIX 1: MEASUREMENT SCALES The respondents were asked to relate their answers to the last order fulfillment process that they had
undertaken in the supply chain, with a focus on the ‘inbound’ portion of the chain (i.e., as appli-cable to their organization’s supply management activity). ‘We’ and ‘participants’ refer to the users, buyers, and suppliers that participate in the order fulfillment process. ‘Products’ refer to both tangi-ble (physical goods) and intangitangi-ble products (ser-vices). An item with ‘a’ at the end of the
ques-tion was deleted after the measurement purificaques-tion process. Seven-point Likert-type scales were used for all items ranging from ‘strongly disagree’ to ‘strongly agree.’
Learning orientation (Hult, 1998)
• We agree that our ability to learn is the key to improvement in the supply management pro-cess.
• The basic values of this supply management pro-cess include learning as a key to improvement.
• Once we quit learning in the supply management process we endanger our future.a
• The sense around there is that employee learning is an investment not an expense.
Innovativeness orientation (Hurley and Hult, 1998)
• Technical innovation, based on research results, is readily accepted in supply management.
• We actively seek innovative supply management ideas.
• Innovation is readily accepted in the supply management process.
• People are not penalized for new ideas that do not work.a
• Innovation in our supply management process is encouraged.
Entrepreneurial orientation (Naman and Slevin, 1993)
• We emphasize research and development and technological leadership.a
• We initiate actions to which other organizations respond.
• We are fast to introduce new administrative techniques and operating technologies.