This is a repository copy of Determining predictive uncertainties and global sensitivities for large parameter systems: A case study for N-butane oxidation.
White Rose Research Online URL for this paper: http://eprints.whiterose.ac.uk/81534/
Version: Accepted Version
Article:
Hébrard, E, Tomlin, AS, Bounaceur, R et al. (1 more author) (2015) Determining predictive uncertainties and global sensitivities for large parameter systems: A case study for
N-butane oxidation. Proceedings of the Combustion Institute, 35 (1). pp. 607-616. ISSN 1873-2704
https://doi.org/10.1016/j.proci.2014.06.027
[email protected] https://eprints.whiterose.ac.uk/
Reuse
Items deposited in White Rose Research Online are protected by copyright, with all rights reserved unless indicated otherwise. They may be downloaded and/or printed for private study, or other acts as permitted by national copyright laws. The publisher or other rights holders may allow further reproduction and re-use of the full text version. This is indicated by the licence information on the White Rose Research Online record for the item.
Takedown
If you consider content in White Rose Research Online to be in breach of UK law, please notify us by
DETERMINING PREDICTIVE UNCERTAINTIES AND GLOBAL SENSITIVITIES FOR LARGE PARAMETER SYSTEMS: A CASE STUDY FOR N-BUTANE
OXIDATION
E´ric H´ebrarda, Alison S. Tomlinb, Roda Bounaceura, Fr´ed´erique Battin-Leclerca*
a
Laboratoire Réactions et Génie des Procédés, CNRS - Université de Lorraine, 1 rue Grandville, 54000 Nancy, FRANCE
b
Energy Research Institute, School of Process Environmental and Materials Engineering,
University of Leeds, Leeds, LS2 9JT, UK
Abstract
A global sampling approach based on low discrepancy sequences has been applied in order to
propose error bars on simulations performed using a detailed kinetic model for the oxidation ofn-butane (including 1111 reactions). A two parameter uncertainty factor has been assigned to
each considered rate constant. The cases of ignition and oxidation in a jet-stirred reactor (JSR) have both been considered. For t h e JSR, not only the reactant mole fraction has been considered, but also that of some representative products. A temperature range from 500 to
1250 K has been studied, including the negative temperature coefficient (NTC) region where the predictive error bars have been found to be the largest. It is this temperature region where
the highest number of reactions play a role in contributing to the overall output errors. A global sensitivity approach based on high dimensional model representations (HDMR) has t h e n
then b e e n applied in order to identify those reactions which make the largest contributions to
the overall uncertainty of the simulated results. The HDMR analysis has been restricted to the
most important reactions based on a non-linear screening method, using Spearman Rank Correlation Coefficients at all s t u d i e d temperatures. The final global sensitivity analysis for p r ed ic t ed ignition delays illustrates that the key reactions are mainly included in the primary
mechanism, for temperatures from 700 to 900 K, and in the C0-C2 reaction base at higher
temperatures. Interestingly, for predicted butane mole fractions in the JSR, the key reactions are almost exclusively from the reaction base, whatever the temperature. The individual
contribution of some key reactions is also discussed.
Keywords:Uncertainties, detailed kinetic model, global sampling, global sensitivity, oxidation
INTRODUCTION
The effective use of combustion mechanisms to model and design practical devices requires robust models that can be used in a predictive way over wide ranges of temperatures,
pressures and compositions. A measure of the robustness of a model can be obtained by estimating predictive error bars based on our knowledge about the uncertainties within the
model parameterization and model structure [1]. However, model error bars are not commonly presented when comparing experimental data with equivalent model simulations. A
single comparison is usually made using the best estimates of the model input parameters, with a local sensitivity analysis often applied afterwards to evaluate which parameters most strongly
influence the selected target model outputs. Whilst local sensitivities have been used successfully to highlight important parameters within mechanisms for many combustion systems, the estimation of model error bars cannot generally rely on their use. This is
dimensional spaces. For such models, the propagation of uncertainties requires a sampling
approach to ensure that all sensitive regions of the input space are covered. Within such an approach, the uncertainties within the inputs are represented by a given distribution (uniform, log-normal etc.), which is then sampled and propagated through the model, providing
distributions of the final model predictions. A large number of model runs may be required in order to obtain stable output statistics, such as the mean and variance of the predicted targets.
The sampling approach used is critical, since we would like to obtain stable statistics using the lowest po ss ib le number of model runs in order to minimize computational costs [2, 3] . Once
stable output distributions are obtained, error bars may be calculated using variance based measures (e.g. 1 or 2 errors).
We may also wish to determine by how much each of the input parameter uncertainties
contributes to the total output variance i.e. to perform an ANOVA (ANalysis Of VAriance) decomposition [4]. Such global sensitivity analyses are also usually based on sampling approaches and could be particularly challenging for large models where the input parameter
space is highly multi-dimensional.
In this paper we develop a methodology for estimating error bars for model simulations which incorporate high dimensional combustion mechanisms. Here we focus on uncertainties within
the temperature dependent rate coefficients, but the approach could be applied to a wider range of inputs including thermodynamic parameters, transport properties, etc. We use a global
sampling approach based on low discrepancy sequences with application to an n-butane oxidation model containing 1111 reactions [5, 6]. A screening method is applied based on the
order to determine a subset of the main parameters which may affect the final errors over a
wide range of conditions. A fully global sensitivity analysis is then performed for this parameter subset using high dimensional model representations (HDMR) [7-9]. We demonstrate that it is possible to achieve an accurate variance decomposition of the output distributions
using this two-step approach using reasonably small sample sizes. The work therefore provides a general method for estimating error bars for complex combustion models and obtaining a
full ANOVA decomposition of these errors.
METHODOLOGY
Three types of experimental systems are mainly used to provide data for validating detailed gas
phase oxidation mechanisms at low-temperatures: rapid compression machines (RCM), shock tubes (ST) and heated flow reactors, such as flow tubes or jet-stirred reactors (JSR). If models
are able to reproduce s u c h e x p e r i m e n t a l data over wide ranges of temperatures and pressures, this suggests that the mechanisms may be appropriate for modeling practical combustion devices. However, discrepancies between model predictions and experimental data
still exist for certain temperatures and it is therefore important to explore the impact of uncertainties in model input data on the model predictions.
The n-butane mechanism used in this study comprises 176 species and 1111 reactions based
updates to that proposed in [5] by Bahrini et al. [ 6 ] . It is an automatically generated mechanism using the computer package EXGAS, which was previously used to generate
o xidat io n mechanisms for many hydrocarbons and oxygenated fuels [10, 11]. The system provides reaction mechanisms composed of three parts:
are the initial organic compounds and oxygen. The following reactions are considered:
• From the initial reactants: production of alkyl radicals through unimolecular and
bimolecular initiations, and H atom abstractions by small radicals;
• From alkyl radicals: reactions with O2 (addition with subsequent reactions of
peroxy radicals through isomerizations, second additions to O2, cyclic ether
formations, and disproportionations with HO2 radicals) or decomposition to
alkenes and HO2radicals), and isomerizations;
• From all radicals: decompositions of radicals by -scission involving the
breaking of C-C, C=O or C-H bonds.
2. A C0-C2 reaction base, including all the reactions involving radicals or molecules
containing less than three carbon atoms.
3. A lumped secondary mechanism, containing the reactions consuming the molecular products of the primary mechanism (e.g ketohydroperoxides, alkenes, cyclic ethers, aldehydes, ketones), which do not react in the reaction base.
Thermochemical data for molecules or radicals are automatically calculated based on group and bond additivity methods. Kinetic data are estimated either based on thermochemical kinetics methods, or on quantitative structure-reactivity relationships obtained from a literature
review [11]. The complete mechanism and its associated uncertainties are available as Supplementary Material.
Uncertainty factors were adopted for each rate coefficient and propagated through to determine
d e v e lo p e d specifically for the present study. RCM/ST simulations were performed using
SENKIN assuming a constant volume adiabatic reactor. Whilst this assumption has been questioned for RCM simulations where post compression volume changes may occur due to heat losses, for the shorter ignition delays simulated here this is not expected to have a major
influence on the predictions as demonstrated by [13]. JSR simulations have been performed using the PSR code assuming a homogeneous isothermal reactor.
UNCERTAINTY ANALYSIS
Chemical kinetics databases provide recommended values of Arrhenius parameters for many
elementary gas-phase reactions, as well as the temperature-dependence of their uncertainties. Ideally, input uncertainties in the temperature-dependence of reaction rates should be described
as an analytical expression derived from the covariance matrix of the Arrhenius parameters, as recommended in [ 1 4 , 1 5 ] . However, this is difficult to realize in practice for many large
combustion mechanisms where a large number of reactions have not been evaluated. Therefore, we estimate an uncertainty factor F(T) of a reaction rate k(T) at any given temperature
following an expression adapted from [ 1 6 ] :
( ) =
(300 )
(
1
1300
)
(1)
where F(300K) is the uncertainty in the rate constant k(T) atT = 300 K andg is the
”uncertainty-extrapolating” coefficient used to obtain the rate constant uncertainty F(T) at different temperatures. The approach is based on the fact that rate constants are almost always known with a minimum uncertainty at room temperature, but allows u s to quantify the
using appropriate evaluation studies where available. This is mostly the case for the C0-C2
reaction base, where many reviews provide temperature-dependent uncertainties assuming that
the minimum and maximum values of the rate coefficients correspond to 1 [ 1 6 ] , 2 [18] or
3 [ 1 7 ] deviations from the recommended value on a logarithmic scale. For example, Baulch
et al. [ 1 7] recommended uncertainties for the rate of the reaction H + O2= O + OH (reaction
927) as F(300K) = 1.08 and F(5000K) = 1.47, giving F(300K) = 1.08 and g = 100 over the temperature range 300-5000 K. For the calculated parameters within the primary and secondary
mechanisms, factorsF= 1.26, g = 0 were used for unimolecular or bimolecular initiations and additions with oxygen, whereas F = 1.12, g = 100 were used otherwise.
Because of the highly non-linear nature of combustion models and their potentially large ranges o f uncertainties, a linear uncertainty propagation is not expected to produce valid
results. Propagation of distributions by random sampling across the whole space spanned by the input distributions is better adapted to such problems [ 1 9 ] . Due to the positivity constraint on these properties, their distributions are modeled by lognormal probability density functions:
( ) =
1√2
exp
( − )
(2)
with µ =ln k(T), the logarithm of the nominal value of the reaction rate at temperatureT, and
= lnF(T), the logarithm of the geometric standard uncertainty F(T) of the lognormal
distribution. With these notations, the 67% confidence interval for a reaction rate at a given temperature is given as [k(T)/F(T), k(T)×F(T)]. Adopted F values are supplied with the mechanism in the Supplementary Material and represent 1 values. Within the uncertainty analysis 3 errors were propagated in order to encompass most possible values of the rate
at 3 . A fuller description is given in Supplementary Material. For many reactions, particularly
those from the primary and secondary mechanisms, these uncertainties have to be estimates since there is insufficient experimental or theoretical data from which to perform a full evaluation. The adopted uncertainties will inevitably affect the variance decomposition and this should be noted
in the interpretation of the global sensitivity results.
Many different sampling methods have been used for sensitivity and uncertainty analysis [20].
Monte Carlo methods are commonly used and involve generating a large number of independent random parameter sets that correspond to the joint probability density function of
model inputs or cover their feasible region using a given distribution. Subsequently model simulations are carried out for each set and the scatter or distributions in the target model
outputs are investigated. Random sampling forms the standard method, b u t with the possible disadvantage of clustering occurring in some regions of the input space and gaps in other
regions. A possible alternative is the use of low discrepancy sequences. Discrepancy is a measure of the uniformity of a sequence; high uniformity equals low discrepancy. Successive
sample points are added to positions as far away as possible from existing sample points so that clustering can be avoided. One of the best known low discrepancy sequences was proposed by Sobol [21]1.
A normal distribution of random numbers can be obtained from a uniform distribution of random numbers using the Box-Muller algorithm (e.g., [22]). However, for low discrepancy sequences, it should be avoided because it may damage their intrinsic properties, either by
therefore compute directly the inverse normal distribution of the Sobol sequence given its
cumulative distribution function2.
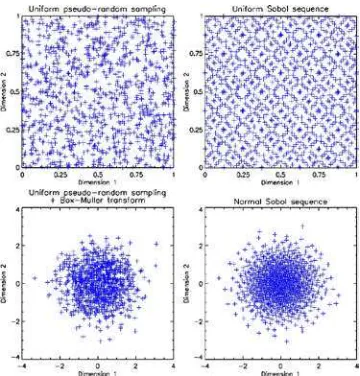
Fig. 1 displays a comparison of samples obtained from a uniform pseudo-random distribution and a
Sobol sequence for a 2-parameter sample where the sample size N=1000. The Sobol sequence provides a more uniform coverage compared to the random sample. Clustering and gaps are
visible for the random sample even within two dimensions, and for small sample sizes (~1000) these could become quite extreme within a 1111 dimensional space as studied here. However,
using a Sobol sequence we found that the variance of the model outputs achieved convergence even using a small sample size of 1000, in agreement with previous work that evaluated the
convergence properties of different sampling strategies [3].
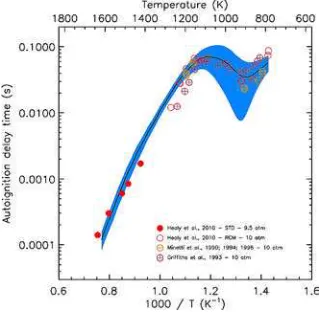
After a quasi-random sample is drawn from the input distribution, the autoignition delay times
and the J S R mole fractions are predicted for each member of this quasi-random sample. Error
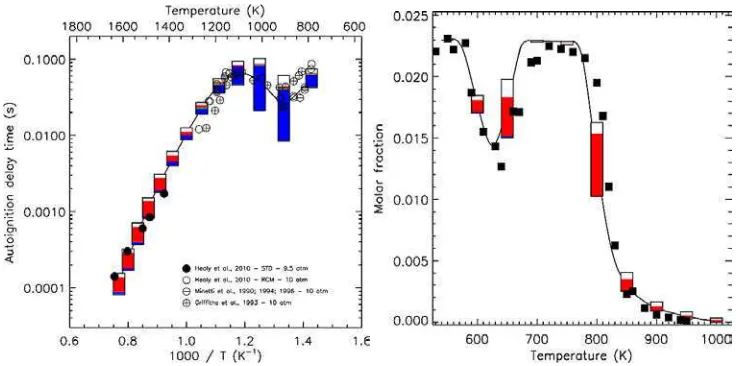
bars on simulations represented by 1 bands vs. temperature are shown in Fig. 2 in the case
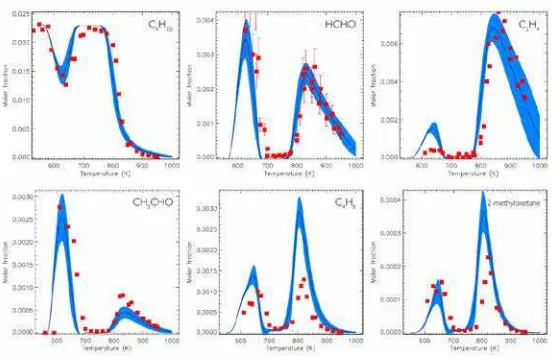
of autoignition, and in Fig. 3 in the case of JSR mole fractions. For the JSR, simulations were
performed under the conditions of [ 6 ] ( =1, P=1atm, T=500−1000K, t=6s). Simulated autoignition delay times in air were performed using the conditions of [ 2 5 ] ( =1, P=10 atm, T=700−1300K). The related experimental results are also shown for comparison. To indicate
Fig. 2 shows that the error bars are largest (up to a factor of 8) in the NTC region ( 750-850 K) and are larger than the scatter in experimental data from various sources. Above 850 K, these error bars significantly decrease, to around a factor of 2. Fig. 3 shows predicted means and confidence intervals for the mole fractions of the reactant in the JSR, as well as for 5
representative products. Aldehydes and ethylene are considered as good indicators of low and high temperature reactivity, respectively. Butenes and 2-methyloxetane are amongst the
important primary products. As for ignition, the error bars related to the reactivity are largest in the NTC region, as indicated by the reactant and aldehyde mole fractions. The errors for
ethylene are especially large above 900 K. Also note that the error bars for the cyclic ether are perhaps lower than would be expected from t he usua l level of agreement found between
simulations and experiments for this family of compounds [ 2 6 ] . The simulated error bars and data points do not overlap in Fig. 3. This could be due to a number of reasons including
experimental error, even for compounds with the largest experimental uncertainty such as CH2O
[6] (see given experimental error bars), but a likely reason is that the adopted uncertainty factors for some reactions in the primary mechanism were perhaps too optimistic. The influence of input
parameter uncertainty estimation, especially in the primary and secondary mechanisms, on predicted error bars should certainly be more thoroughly investigated in future work.
GLOBAL SENSITIVITY ANALYSIS
Global sensitivity analysis was then performed at various temperatures in order to provide a variance decomposition of the error bars shown in the previous figures. Butane was chosen as
sample sizes with associated computational costs. A screening method was therefore first used
in order to pre-select those parameters which are likely to contribute to the overall variance of the model predictions. Whilst linear sensitivity analysis is commonly used as pre-screening step, it was not used here since the response of the predicted outputs to changes in inputs may not be
linear across the input uncertainty ranges. Focusing calculations around the nominal parameter values may therefore give misleading results [8]. A global screening approach based on
Spearman Rank Correlation Coefficients (RCCs) was therefore adopted using the input-output distributions built from the original Sobol sequences.
RCCs [31] provide a measure of the strength of the non-linear relationship between model
inputs and target outputs, by assessing how well the relationship between two variables can be described using a monotonic function. The RCC threshold was set to 0.2 to give a reasonable
yet restricted set of s i g n i f i c a n t reactions as shown in Table 1 for simulated autoignition delay times and butane mole fractions in the JSR. 29 key reactions were identified for ignition delays and 34 for the JSR mole fractions. These inputs were then selected for the subsequent global
sensitivity analysis.
A further Sobol sequence was then generated for these restricted sets of inputs and checks were made to ensure that the total predicted output variance from this restricted sample was well
matched to that from the original sample where all 1111 parameters were varied. This provides confidence that a successful screening was performed and that the following variance decomposition accurately provides the importance of each parameter in terms of its contribution
The global sensitivity study was performed using a high dimensional model representation
(HDMR) method based on a hierarchical expansion of the input-output relationship generated from the Sobol sample as described in [9]. Using HDMR, variance based sensitivity indices can be determined in an automatic way from the hierarchical function expansion, hence providing a
ranking of each parameter in terms of its contribution to the predicted output variance.
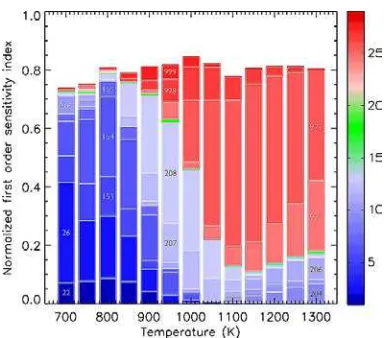
Fig. 4 displays the global first-order sensitivity indices calculated for ignition delays every 50 K from 700 to 1300 K. Two excel files in Supplementary Material present the results in
more detail for ignition and PSR results, respectively. The analyzed reactions are numbered as shown in Table 1. If a full variance decomposition is achieved then the sum of the sensitivities
should be 1. Second-order indices were calculated but are not shown here for simplicity of interpretation. The white parts in Fig. 4 and in the boxes of Fig. 5 correspond to these and
potentially higher order effects. Based on the first order terms from the AN O V A analysis, Fig. 5 presents how the error bars shown in Figs. 2 and 3 are decomposed into contributions attributable to reactions included in the primary mechanism, the secondary mechanism, and
the reaction base, respectively. For autoignition delay times, Figs. 4 and 5(a) highlight, as expected, the importance of reactions of the primary mechanism up to 900 K whilst at higher
temperatures reactions from the C0-C2reaction base dominate. Whilst the input uncertainties for
reactions of the secondary mechanism are certainly large, their contribution to output
uncertainty is very small and only s ig nific ant below 1000 K. T h is s u p p o r t s t h e lu mp i n g a p p r o a c h u s e d in t h e g e n e r a t io n o f s e c o n d a r y m e c h a n is m s b y t h e
E X G A S s o ft w a r e [ 1 1 ] . Perhaps more surprisingly, Fig. 5(b) indicates that the JSR
simulations are almost exclusively d o min a t e d by uncertainties in reactions from the C0-C2
isomerization of one of the butylperoxy radicals (reaction 26 in Table 1) is the only identified
contributor to the error bar, and at 600 K, the reactions of radicals derived from ethyl radicals (e.g
reaction 897), which are mainly obtained from ketohydroperoxides decomposition, have a
significant contribution. However at higher temperature only reactions of HO2, CH3, HCHO, and
to minor extent CH3CHO have a notable contribution. Further studies of these reactions could
help to improve the predictability of the mechanism.
In Fig. 4 and better shown in Supplementary Material, under ignition conditions below 800 K,
the reactions with the highest contributions are the isomerizations ofbothbutylperoxy radicals (reactions 22 and 26) and oxidation to give butene and HO2 radicals from butyl radicals
(reactions 153-155). Above 900 K, the contribution of the metathesis of butane with HO2
radicals (reactions 207 and 208) and of the combina ion of methyl and HO2radicals (reaction
977) start to be significant, with the contribution of these last reactions being dominant for all temperatures above 1050 K. A notable contribution of the formation of H2O2 from HO2
radicals (reaction 998) appears from 950 to 1050 K, and finally one of the reaction H + O2=
O + OH (reaction 927) starts from 1150 K, confirming the determinant role of branching steps in ignition.
CONCLUSION
We have demonstrated a computationally efficient method for providing predictive error bars on
combustion simulations using complex reaction mechanisms, based on a sampling approach using low discrepancy sequences. The variance decomposition of these errors provides
two-step process using a prior screening of the parameters using Spearman Rank Correlation
Coefficients, followed by HDMR analysis for the selected parameters to estimate global sensitivity indices. When applied to simulations of experimental data obtained from RCM, shock tube and a JSR forn-butane oxidation, the results provide a highly visual way to evaluate how the
sensitivities to uncertainties within the mechanism change across the different temperature regimes. Very little sensitivity to the secondary mechanism was observed across all temperature
ranges for all reactor studies. Sensitivities to the reactions within the primary butane scheme were mainly observed for the low temperature ignition delay experiments, suggesting that such
experiments could provide useful constraints on the R+O2, and RO2 to QOOH isomerization
pathways if used within an optimization approach. Perhaps surprisingly, the predicted butane
mole fractions within the JSR simulations were mainly sensitive to reactions within the base scheme, particularly reactions involving HO2, HCHO, CH3, and to a minor extent C2H5 or
CH3CHO.
ACKNOWLEDGEMENT
This work was supported by the European Commission through the ”Clean ICE” Advanced Research Grant of the European Research Council and by COST Action CM0901.
3 SUPPLEMENTARY MATERIALS 1/ Mechanism and uncertainties (pdf file) 2/ SI_results_HDMR_SENKIN (excel.file)
REFERENCES
[1] A. S. Tomlin, Proc. Combust. Inst. 34 (2013) 159–176.
[2] A. Saltelli, M. Ratto, T. Andres, F. Campolongo, J. Cariboni, D. Gatelli, M. Saisana, S. Tarantola, Global
sensitivity analysis: The primer, WileyInterscience, Wiley, 2008.
[3] A. S. Tomlin, T. Ziehn, in: A. Gorban, D. Roose (Eds.), Coping with complexity: Model reduction and
data analysis, Lecture notes in computational science and engineering, Springer, 2011, pp. 9–36.
[4] I. Sobol, Math. Comput. Simulat. 55 (2001) 271–280.
[5] F. Battin-Leclerc, O. Herbinet, P.-A. Glaude, R. Fournet, Z. Zhou, L. Deng, H. Guo, M. Xie, F. Qi, Proc.
Combust. Inst. 33 (2011) 325–331.
[6] C. Bahrini, P. Morajkar, C. Schoemaecker, O. Frottier, O. Herbinet, P.A. Glaude, F. Battin-Leclerc, C.
Fittschen, Phys. Chem. Chem. Phys. 15 (2013) 19686–19698.
[7] T. Ziehn, A. S. Tomlin, Int. J. Chem. Kinet. 40 (2008) 742–753.
[8] T. Ziehn, K. J. Hughes, J. F. Griffiths, R. Porter, A. S. Tomlin, Combust. Theo. Model. 13 (2009)
589–605.
[9] T. Ziehn, A. S. Tomlin, Environ. Modell. Softw. 24 (2009) 775–785.
[10] F. Buda, R. Bounaceur, V. Warth, P. Glaude, R. Fournet, F. BattinLeclerc, Comb. Flame 142 (2005)
170–186.
[11] E. Blurock, F. Battin-Leclerc, in: F. Battin-Leclerc, J. M. Simmie, E. Blurock (Eds.), Cleaner Combustion,
Green Energy and Technology, Springer London, 2013, pp. 17–57.
[12] R. J. Kee, F. M. Rupley, J. A. Miller, Chemkin II: A FORTRAN chemical kinetics package for the
analysis of gasphase chemical kinetics, Technical Report SAND89-8009B, Sandia National Laboratories,
1993.
[13] Z. Serinyel, O. Herbinet, O. Frottier, P. Dirrenberger, V. Warth, P.A. Glaude, F. Battin-Leclerc, Combust.
Flame 160 (2013) 2319.
Picard, I. R. Sims, J. Phys. Chem. A 113 (2009) 11227–11237.
[15] T. Nagy, T. Tura´nyi, Int. J. Chem. Kinet. 43 (2011) 359–378.
[16] S. P. Sander, J. Abbatt, J. R. Barker, J. B. Burkholder, R. R. Friedl, D. M. Golden, R. E. Huie, C. E.
Kolb, M. J. Kurylo, G. K. Moortgat, V. L. Orkin, P. H. Wine, JPL Publication 10-6 (2011).
[17] D. L. Baulch, C. T. Bowman, C. J. Cobos, R. A. Cox, T. Just, J. A. Kerr, M. J. Pilling, D. Stocker, J. Troe,
W. Tsang, R. W. Walker, J. Warnatz, J. Phys. Chem. Ref. Data 34 (2005) 757–1397.
[18] R. Atkinson, D. L. Baulch, R. A. Cox, J. N. Crowley, R. F. Hampson, R. G. Hynes, M. E. Jenkin, M.
J. Rossi, J. Troe, T. J. Wallington, Atmos. Chem. Phys. 8 (2008) 4141–4496.
[19] BIPM, IEC, IFCC, ISO, IUPAC, IUPAP, OIML, Evaluation of measurement data Supplement 1 to the
GUM: Propagation of distributions using a Monte-Carlo method, Technical Report, BIPM, 2006.
[20] J. Helton, J. Johnson, C. Sallaberry, C. Storlie, Reliab. Eng. Syst. Saf. 91 (2006) 1175–1209.
[21] I. Sobol, USSR Comput. Math. Math. Phys. 7 (1967) 86–112.
[22] W. Press, S. Teukolsky, W. Vetterling, B. Flannery, Numerical recipes in Fortran. The art of scientific
computing, Cambridge University Press, 1992.
[23] B. Moro, Risk 8 (1995) 57–58.
[24] S. Galanti, A. Jung, J. Deriv. 5 (1997) 63–83.
[25] D. Healy, N. Donato, C. Aul, E. Petersen, C. Zinner, G. Bourque, H. Curran, Comb. Flame 157 (2010)
1526–1539.
[26] M. Cord, B. Sirjean, R. Fournet, A. Tomlin, M. Ruiz-Lopez, F. BattinLeclerc, J. Phys. Chem. A 116
(2012) 6142–6158.
[27] M. Carlier, C. Corre, R. Minetti, J.-F. Pauwels, M. Ribaucour, L.-R. Sochet, Symp. Int. Combust. Proc.
23 (1991) 1753–1758.
[28] R. Minetti, M. Ribaucour, M. Carlier, C. Fittschen, L. Sochet, Comb. Flame 96 (1994) 201–211.
[29] R. Minetti, M. Ribaucour, M. Carlier, L. Sochet, Combust. Sci. Technol.113 (1996) 179–192.
[30] J. Griffiths, P. Halford-Maw, D. Rose, Comb. Flame 95 (1993) 291–306.
Table 1:Key reactions during the simulations of the autoignitition delay times with SENKIN [S] and of the oxidation of n-butane with PSR [P]. Reactions are numbered in the first column as in
the mechanism (see Supporting Information).
N° Reactions S P
6 1-C4H9+O2 C4H9−1−OO 1
7 2-C4H9+O2 C4H9−2−OO 2
22 C4H9−1−OO C4H8−1−OOH 1
26 C4H9−2−OO C4H8−2−OOH 2
81 2-C4H7−13−(OOH)2 HO2+C4H7OOH 3
131 2-C4H7−34−(OOH)2 OH+2-methoxy-1,3-dioxolane 4
132 1-C4H7−34−(OOH)2 OH+2-methoxy-1,3-dioxolane 4
153 1-C4H9+O2 1-C4H8+HO2 5
154 2-C4H9+O2 1-C4H8+HO2 6 5
155 2-C4H9+O2 1-C4H8+HO2 7
177 1-C4H7−24−(OOH)2+O2 1-C4H6-2,4,-(OOH)2+HO2 8
204 C4H10+H H2+2-C4H9 9
205 C4H10+OH H2O+1-C4H9 10
206 C4H10+OH H2O+2-C4H9 11
207 C4H10+HO2 H2O2+1-C4H9 12
208 C4H10+HO2 H2O2+2-C4H9 13
256 CH3C(O)C2H4OOH OH+CH3C(O)C2H4O 6
282 C3H8+CH3 CH4+1-C3H7 14 7
291 C5H12+HO2 H2O2+CH3+C2H4+C2H4 15
297 C5H12+C2H5 C2H6+CH3+C2H4+C2H4 8
314 methyloxirane+OH H2O+CH3+CH2CO 9
344 propyloxirane+OH H2O+1-C3H7+CH2CO 10
353 methylpropyloxirane+H H2+1-C3H7+C2H3CHO 16
364 methylpropyloxirane+C2H5 C2H6+1-C3H7+C2H3CHO 11
425 C5H10+OH CH3+C3H7CHO 17
444 C5H10+H H2+13−C4H6+CH3 12
454 C5H10+CH3 CH4+13−C4H6+CH3 18
470 C6H12+CH3 CH4+13−C4H6+C2H5 19 13
497 C3H6+O C3H5+OH 20 14
509 C3H7OH+HO2 H2O2+OH+C3H6 21
545 C2H5CHO+HO2 H2O2+C3H5O 15
570 C5H9O CO+1-C4H9 16
587 C3H7CHO+HO2 H2O2+CH2CO+C2H5 17
652 CH+H C+H2 22
704 C2H6+C2H C2H2+C2H5 18
730 H+O+M OH+M 19
780 HCHO+H HCO+H2 23 20
837 CH3OH+OH CH3O+H2O 21
845 HCCO+OH HCO+CO+H 24
897 C2H5O HCHO+CH3 22
911 C2H5OH+O2 C2H4−1−OH+HO2 23
927 O2+H OH+O 25 24
977 HO2+CH3 CH3O+OH 26 25
990 HO2+HCHO HCO+H2O2 26
995 HO2+CH3CHO CH3CO+H2O2 27
997 HO2+HO2 H2O2+O2 28
998 HO2+HO2 H2O2+O2 27 29
999 H2O2(+M) OH+OH(+M) 28
1038 CH3O2+H2O2 CH3OOH+HO2 30
1041 CH3OOH CH3O+OH 31
1055 C2H5OO+HCHO C2H5OOH+HCO 32
1071 C2H5OOH C2H5O+OH 33
FIGURE CAPTIONS
Figure 1: A comparison of distributions for different sampling strategies for a 2-parameters sample with N = 1000. Uniform pseudo- random sample (top left), Sobol’s quasi-random
sequence sample (top right), Box-Muller transformation applied to an uniform pseudo-random sample (bottom left) and the normal inverse cumulative function of a Sobol’s quasi-random sequence sample (bottom right).
Figure 2: Predictions of the autoignition delay times vs. temperature. Black solid line: nominal and mean profile. Blue-filled area corresponds to the standard deviation (1 ) of the modeled
results. STD = shock-tube data. RCM = rapid compression machine [25,27,28,30].
Figure 3: Predictions of the mole fraction profiles vs. temperature of some representative products during the oxidation of n-butane in a JSR. Black solid lines: nominal and mean.profiles.
Blue-filled area corresponds to the standard deviation (1 ) of the modeled results. Red squared symbols are GC measurements [6].
Figure 4: Normalized estimates of first-order contributions to the overall variance of predicted autoignition delay times vs. temperature calculated using the global HDMR method under the conditions of Fig. 2. Reactions are numbered on the boxplot as in the mechanism (see Supporting
Information) but the colormap has been scaled to the limited set of reactions numbered and ordered as specified in the third column of the Table 1.
Figure 5: Predictions of autoignition delay times and C4H10 mole fraction profiles vs.
observed variance in a particular variable is partitioned into components attributable to different
Figure 1: A comparison of distributions for different sampling strategies for a 2-parameters sample with N = 1000. Uniform pseudo- random sample (top left), Sobol’s quasi-random
Figure 3: Predictions of the mole fraction profiles vs. temperature of some representative products during the oxidation of n-butane in a JSR. Black solid lines: nominal and mean.profiles. Blue-filled area corresponds to the standard deviation (1 ) of the modeled results. Red squared
Figure 4: Normalized estimates of first-order contributions to the overall variance of predicted autoignition delay times vs. temperature calculated using the global HDMR method under the
conditions of Fig. 2. Reactions are numbered on the boxplot as in the mechanism (see Supporting Information) but the colormap has been scaled to the limited set of reactions numbered and
Figure 5: Predictions of autoignition delay times and C4H10 mole fraction profiles vs.
temperature under the conditions of Figs. 2 (left) and 3(a) (right). The boxplots display the
observed variance in a particular variable is partitioned into components attributable to different chemical sources of variation in the mechanism [6]: primary mechanism (blue), secondary
![Table 1: Key reactions during the simulations of the autoignitition delay times with SENKIN [S]](https://thumb-us.123doks.com/thumbv2/123dok_us/7887662.185443/19.595.72.296.186.684/table-key-reactions-simulations-autoignitition-delay-times-senkin.webp)