eurostat
EC-ACP TRADE
A STATISTICAL ANALYSIS
1970-1981
eurostat
STATISTICAL OFFICE OF THE EUROPEAN C O M M U N I T I E S OFFICE STATISTIQUE DES C O M M U N A U T É S EUROPÉENNES
L-2920 Luxembourg - Tél. 43011 Télex: Comeur Lu 3423
B-1049 Bruxelles, Bâtiment Berlaymont, Rue de la Loi 2 0 0 (Bureau de liaison) - Tél. 235 11 11
EC-ACP TRADE
A STATISTICAL ANALYSIS
1970-1981
ÉCHANGES CE-ACP
UNE ANALYSE STATISTIQUE
Cataloguing data can be found at the end of this volume Une fiche bibliographique figure à la fin de l'ouvrage
Luxembourg: Office des publications officielles des Communautés européennes, 1983
ISBN 9 2 - 8 2 5 - 3 8 9 2 - 3
CAT.: CA-36-82-144-2A-C
Reproduction of the contents of this publication is subject to acknowledgement of the source
La reproduction des données est subordonnée à l'indication de la source
Foreword
Avant-propos
With the opening of negotiations on the renewal of
the Convention associating the African, Caribbean
and Pacific (ACP) countries with those of the
Euro-pean Community approaching, to have so detailed a
retrospective study of EC-ACP trade is a timely
working tool for clarifying our thoughts and
facili-tating our discussions.
The place of the ACP in world trade and in that of
the Community remains depressed, and the current
world economic crisis is holding back the onset of
conditions for a strong recovery.
Consequently, our efforts must open up a greater
transparency in trade and the possibility of
foresee-ing and modifyforesee-ing future developments. In fact the
development of the ACP in the years to come
depends in part on this being done.
Through such work the importance of statistical
information is demonstrated once more; its
im-provement should thus be of concern to all, so that
the relations between the ACP States and the
Euro-pean Community, which can only continue to
de-velop, are set in a sound and reliable frame.
A l'approche de l'ouverture des négociations visant
au renouvellement de la convention qui associe les
pays d'Afrique, des Caraïbes et du Pacifique (ACP)
et ceux de la Communauté européenne, disposer
d'une étude rétrospective aussi détaillée des
échan-ges CE-ACP est un outil de travail propre à éclairer
nos réflexions et à faciliter nos discussions.
La place des ACP dans le commerce international
et dans celui de la Communauté demeure faible, et
la crise économique mondiale actuelle freine la mise
en route des conditions d'une forte progression.
Dès lors, nos efforts doivent déboucher sur une plus
grande transparence des échanges et sur la
possibi-lité d'en prévoir et d'en orienter les évolutions
futu-res. Il s'agit d'ailleurs d'une conditions du
dévelop-pement des ACP dans les années à venir.
A travers de tels travaux apparaît, une fois de plus,
l'importance de l'information statistique, dont
l'amé-lioration doit aussi être un souci de tous, afin
d'as-seoir sur des bases claires et fiables les rapports qui
ne pourront qu'aller en se développant entre États
ACP et pays de la Communauté européenne.
Richard BURKE
Member of the Commission
Membre de la Commission
Richard BURKE
Preface
Préface
The publication
EC-ACP trade 1970-81, a
statisti-cal analysis
is the latest in the series of analyses of
Community external trade produced over the last
few years by the Statistical Office of the European
Communities in collaboration with specialized
re-search institutes in the Member States.
La publication «Echanges CEACP 19701981
-Analyse statistique» poursuit la série d'analyses du
commerce extérieur de la Communauté entreprises
depuis quelques années par l'Office statistique des
Communautés européennes avec la collaboration
d'instituts de recherche spécialisés des États
mem-bres.
In this way structured information is available to
users, be they policy-makers, negotiators of
inter-national agreements, researchers or social partners,
which can rapidly shed light on the whole range of
issues raised by Community trade.
Il s'agit par ce moyen de mettre à la disposition des
utilisateurs, qu'ils soient hommes politiques,
négo-ciateurs d'accords internationaux, chercheurs ou
partenaires sociaux, une information déjà élaborée,
susceptible de les éclairer rapidement sur
l'ensem-ble des problèmes posés par les échanges de la
Communauté.
The analysis presented in this publication is of
parti-cular interest. In effect, this study is published at
the moment when negotiations between the
Euro-pean Community and the ACP States are about to
start, with a view to renewing the Lomé Convention.
L'analyse présentée dans cette publication revêt un
intérêt particulier. En effet, cette étude est diffusée
au moment où débutent les négociations entre la
Communauté européenne et les États ACP en vue
du renouvellement de la «convention de Lomé».
The Statistical Office of the European Communities
thus hopes to play its part in the work of these
negotiations by examining how EC-ACP trade has
evolved in the course of the period 1970-81.
L'Office statistique des Communautés européennes
espère ainsi apporter sa contribution aux travaux de
cette négociation en examinant comment ont
évolué les échanges CE-ACP au cours de la période
1970-1981.
The analysis which follows aims above all to be a
factual one. Using a few simple statistical
tech-niques, it attempts to describe the modifications in
the structure of EC-ACP trade over the course of a
period marked by events which have profoundly
influenced world trade: oil crises, fluctuations in the
dollar and raw material prices, but also the
enlarge-ment of the Community and the coming into force
of international agreements (GSP, Lomé
Conven-tions, etc.).
L'analyse proposée s'est voulue avant tout
fac-tuelle. Elle tente à travers quelques techniques
sta-tistiques simples de décrire les modifications dans
la structure des échanges CE-ACP au cours d'une
période marquée par des événements qui ont
in-fluencé le commerce mondial: chocs pétroliers,
fluctuations du dollar et des matières premières,
mais aussi l'élargissement de la Communauté et la
mise en œuvre d'accords internationaux (SPG,
con-ventions de Lomé, etc.).
The analysis also aims at being as exhaustive as
possible, highlighting the essential data for the
products and the partner countries in EC-ACP trade.
L'analyse s'est également voulue aussi exhaustive
que possible, en s'attachant autant aux données de
synthèse que par produits ou par pays partenaires
dans les échanges CE-ACP.
It goes without saying, however, that the statistics
in this publication represent only a part of the
information available to the Statistical Office. In the
field of foreign trade the Office potentially has at its
disposal a considerable volume of information
relat-ing not only to ACP countries but also to all third
countries.
Il va de soi toutefois que les statistiques présentées
dans cette publication ne représentent qu'une
par-tie de l'information disponible à l'Office statistique.
Celui-ci dispose en effet d'un potentiel
d'informa-tion considérable dans le domaine du commerce
extérieur, non seulement avec les pays ACP, mais
aussi avec l'ensemble des pays tiers.
Thus this analysis is a synthesis of the available Cette analyse synthétise ainsi, sur un thème
parti-information on a particular topic which would oth- culier, l'ensemble de l'parti-information disponible, mise
erwise be available to users only from a variety of par ailleurs à la disposition des utilisateurs grâce à
different sources. des moyens de diffusion très diversifiés.
Contents
Table des matières
Introduction
Methodology and sources
Abbreviations
Exchange rates
The ACP countries and their groupings
Page
1
2
10
11
12
Préface
Méthodologie et sources
Abréviations
Taux de change
Les pays ACP et leurs groupements
PART ONE
1.
The economy and external trade of
the ACP countries
1.1.
The economy of the ACP countries
1.1.1.
1.1.2.
1.1.3.
1.1.4.
1.1.5.
1.1.6.
1.1.7.
1.1.8.
1.1.9.
1.1.10.
1.1.11.
1.2.
1.2.1.
1.2.2.
1.3.
1.3.1.
1.3.2.
1.3.3.
1.3.4.
1.3.5.
Location
Regional organizations
Population
Gross national product
Gross national product per capita
Economic growth
The openness of the ACP countries
Official development assistance
External public sector debt
Agricultural
production
Extractive industries
The ACP countries, world trade by
broad economic regions
The ACP countries and world trade
Trade by broad economic regions
IntraACP trade
Preliminary remarks
Comparison of intra
trade
IntraACP trade by main zones
and extraA C Ρ
15
15
16
17
19
21
21
21
22
23
26
1.1.1.
1.1.2.
1.1.3.
1.1.4.
1.1.5.
1.1.6.
1.1.7.
1.1.8.
1.1.9.
1.1.10.
1.1.11.
Imbalances within the zones: importance
of individual
countries
Comparative
elements for intraACP
trade between 1970 and 1980
28
30
32
34
38
43
46
PREMIÈRE PARTIE
1.
Économie et commerce extérieur des
pays ACP
1.1.
L'économie des pays ACP
Situation
Organisations
régionales
Population
Produit national brut
Produit national brut par habitant
Croissance économique
L'ouverture des pays ACP
Aide publique au développement
Dette publique extérieure
Production agricole
Industries
extractives
1.2.
Les pays ACP, le commerce mondial
et les échanges par grandes régions
économiques
1.2.1.
Les pays ACP et le commerce mondial
1.2.2.
Échanges par grandes régions écono
miques
1.3.
Les échanges intraACP
1.3.1.
Remarques
préliminaires
1.3.2.
Comparaison des échanges intra et
extraACP
1.3.3.
Les échanges intraACP par grandes
zones
1.3.4.
Les déséquilibres au sein des zones:
importance des pays individuels
1.3.5.
Éléments de comparaison des échan
ges intraACP entre 1970 et 1980
PART T W O
ACP (62) trade with the European
Community and applicant States
DEUXIÈME PARTIE
Les échanges entre les ACP (62), la
Communauté et les pays candidats
2 . 1 . Trade between the European
Com-munity and the ACP (62) countries
2.1.1. General remarks
2.1.2. EC-ACP (62) trade excluding fuels
2.1.3. Trends
2.1.4. EC's share of ACP (62)'s trade with
industrialized countries
2.1.4.1. General aspects
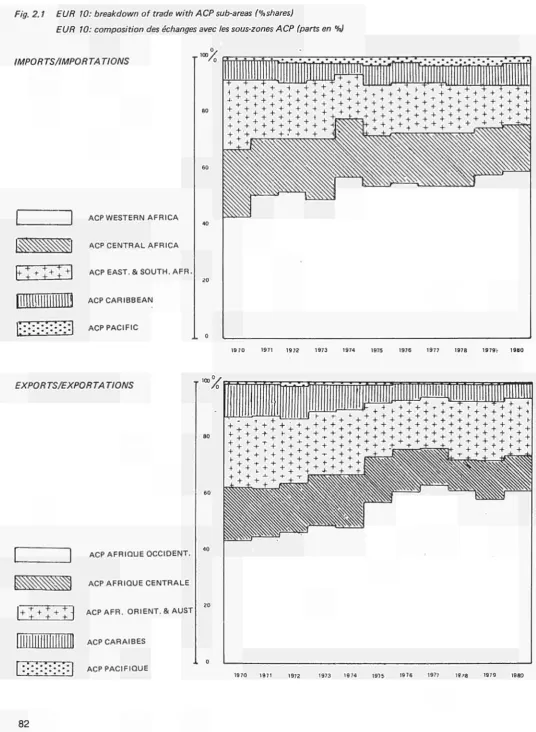
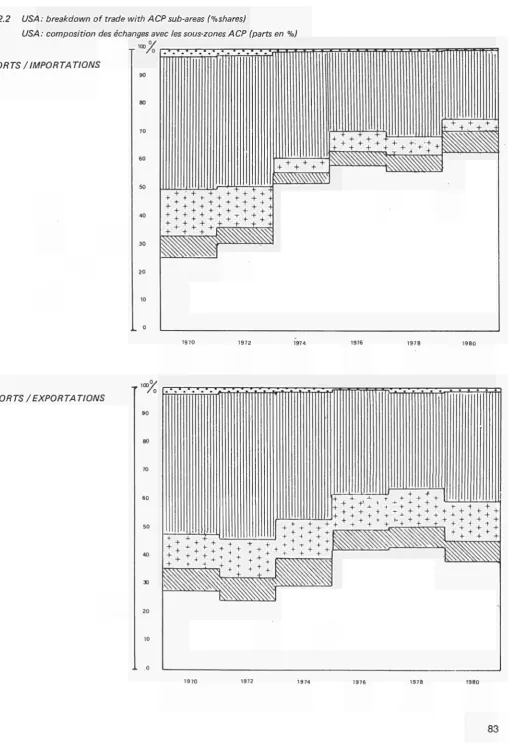
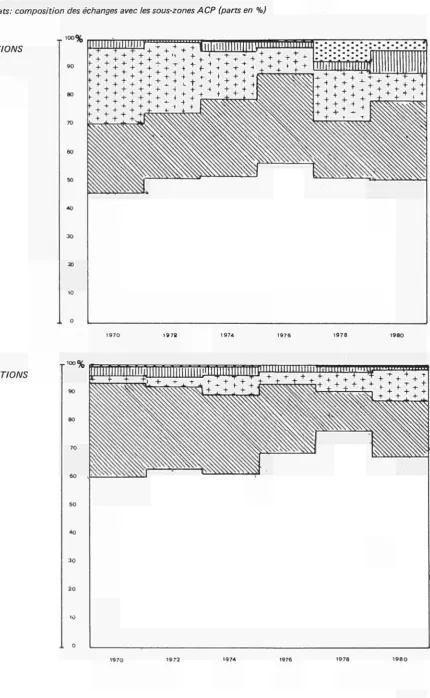
2.1.4.2. Regional differences: trade with certain
groups of ACP countries
2.1.4.3. Main ACP trading partners
2.1.5. ACP trading partners of the EC
2.1.5.1. Concentration of trade
2.1.5.2. Current trends: differences between
, countries
2.1.5.3. Relative performance in the EC market
of various ACP countries compared with
the ACP average
2.2. Trade between the Member States
of the EC and ACP (62)
75
77
77
79
79
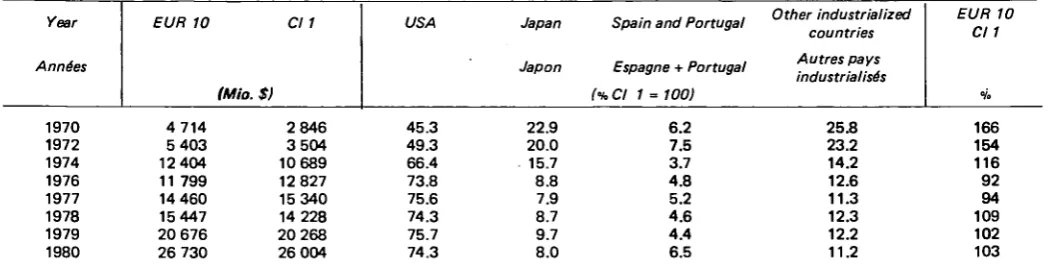
81
87
89
89
93
93
2.1.
Les échanges entre la Communauté
et les pays ACP (62)
2.1.1. Considérations généra/es
2.1.2. Les échanges CE-ACP (62) sans
com-bustibles
2.1.3. Les tendances
2.1.4. La place de la CE dans les échanges des
ACP (62) avec les pays industrialisés
2.1.4.1. Aspects généraux
2.1.4.2. Différenciations territoriales: les
échan-ges avec certains groupements de pays
ACP
2.1.4.3. Les principaux partenaires ACP
2.1.5. Les partenaires ACP de la CE
2.1.5.1. Concentration des échanges
2.1.5.2. Les tendances: aspects différentiels
2.1.5.3. Évolution relative des différents pays
ACP par rapport à leur moyenne
géné-rale
2.2.
2.2.7.
2.2.2.
2.2.3.
2.2.4.
2.2.5.
2.2.6.
2.2.7.
2.2.8.
2.2.9.
2.2.10.
2.2.11.
General remarks
Main European trading partners of
groups of ACP countries
Trade between the Federal Republic
of Germany and ACP (62)
Trade between France and ACP (62)
Trade between Italy and ACP (62)
Trade between the Netherlands and
ACP (62)
Trade between the BLEU and ACP (62)
Trade between the United Kingdom
and ACP (62)
Trade between Ireland and ACP (62)
Trade between Denmark and ACP (62)
Trade between Greece and ACP (62)
98
102
105
107
109
110
112
114
117
118
120
2.2.1.
2.2.2.
2.2.3.
2.2.4.
2.2.5.
2.2.6.
2.2.7.
2.2.8.
2.2.9.
2.2.10.
2.2.11.
2.3. Trade between the applicant States 2.3.
and ACP (62)
2.3.1. General remarks
121
2.3.1.
2.3.2. Main trading partners
122
2.3.2.
2.3.3. Current trends
123
2.3.3.
Les échanges entre les pays membres
de la Communauté et les pays ACP
(62)
Considérations généra les
Les principaux partenaires européens
dans les échanges avec les groupes de
pays ACP
Les échanges entre la république
fédé-rale d'Allemagne et les ACP (62)
Les échanges entre la France et les
ACP (62)
Les échanges entre l'Italie et les ACP
(62)
Les échanges entre les Pays-Bas et les
ACP (62)
Les échanges entre l'UEBL et les ACP
(62)
Les échanges entre le Royaume-Uni et
les ACP (62)
Les échanges entre l'Irlande et les ACP
(62)
Les échanges entre le Danemark et les
ACP (62)
Les échanges entre la Grèce et les ACP
(62)
Les échanges entre les pays candidats
et les pays ACP (62)
Considérations générales
Les principaux partenaires
Les tendances
PART THREE
3. Trade between the EC and ACP (62)
by broad economic category (BEC)
3.1. EC imports from ACP (62) by broad
economic category (BEC)
3.1.1. Structure of and trends in EC imports
180
from ACP (62)
TROISIÈME PARTIE
3. Les échanges CE-ACP par grandes
catégories économiques (GCE)
3 . 1 . Les importations de la CE en
prove-nance des ACP (62) par grandes
ca-tégories économiques (GCE)
3.1.1.2. Market shares 183
3.1.1.3. Comparison b e t w e e n the EC and other 1 8 5
industrialized countries
3.1.1.4. Structure by groups of ACP countries 187
3.1.2. Analysis of imports by BEC 1 9 0
1-3 Raw materials
1 Food 11 Primary food
111 Primary food for industry
112 Primary food for households
12 Processed food
121 Processed food for industry
2 Industrial supplies nes
21 Primary industrial supplies nes
22 Processed industrial supplies nes
3 Fuels 31 Primary fuels 32 Processed fuels
4-7 Manufactured goods
3 . 2 . EC exports to A C P (62) by broad economic category (BEC)
3.2.1. Structure of and trends in EC export to ACP (62)
3 . 2 . 1 . 1 . Structure and specialization 3.2.1.2. Market shares
3.2.1.3. Comparison between the EC and other industrialized countries
3.2.1.4. Structure by groups of ACP countries 3.2.2. Analysis of exports by BEC
1-3 Raw materials
1 Food
2 Industrial supplies nes 3 Fuels
4-7 Manufactured goods 4 Capital equipment 5 Transport equipment 51 Passenger motor cars
52 Other transport equipment 53 Parts of transport equipment 6 Consumer goods nes
62 Semi-durable consumer goods nes
63 Non-durable consumer goods nes
3.1.1.2. 3.1.1.3.
2 0 2
1.4.
2.
3 . 2 .
3.2.1.
203
204
208
209
213
3.2.1.1.
3.2.1.2.
3.2.1.3.
3.2.1.4.
3.2.2.
Parts de marché
Comparaison entre la CE et les autres pays industrialisés
Structure par groupements ACP Analyse par catégories GCE
d'impor-tation
1-3 Matières premières
1 Produits alimentaires
11 Produits alimentaires de base
111 Produits alimentaires de base pour l'industrie
112 Produits alimentaires de base pour consommation des ménages
12 Produits alimentaires transformés 121 Produits alimentaires transformés pour
l'industrie
2 Approvisionnements industriels n.d.a. 21 Approvisionnements industriels de base
n.d.a.
22 Approvisionnements industriels trans-formés n.d.a.
3 Combustibles 31 Combustibles de base 32 Combustibles transformés
4-7 Produits manufacturés
Les exportations de la CE vers les A C P (62)
Structure et tendances des exportations de la CE vers les ACP (62)
Structure et spécialisation Parts de marché
Comparaison entre la CE et les autres pays industrialisés
Structure par groupements ACP Analyse par catégorie GCE d'exportation
1-3 Matières premières
1 Produits alimentaires
2 Approvisionnements industriels n.d.a. 3 Combustibles
4-7 Produits manufacturés
4 Biens d'équipement 5 Matériel de transport
51 Automobiles pour le transport des personnes
52 Matériel de transport sauf automobiles 53 Pièces, parties et accessoires 6 Biens de consommation n.d.a. 62 Biens de consommation semi-durables
n.d.a.
63 Biens de consommation non durables n.d.a.
P A R T F O U R
4.
4 . 1 .
4.1.1.
4.1.2.
M a i n products imported by the EC from A C P (62)
Global analysis
Definition of the products
Main products imported by the EC from ACP (62)
3 1 7 3 2 9
Q U A T R I È M E P A R T I E
4 . Principaux produits de provenance A C P (62) importés par la CE
4 . 1 . Analyse d'ensemble
4.1.1. Définition des produits
4.1.2. Les principaux produits dans les impor-tations de la CE en provenance des ACP (62)
4.1.3.
4.1.4.
4.1.5.
4.1.6.
4.2.
011.1
031
032
042.1
042.2
051.3
053
054.2
054.81
061.1
071.1
071.3
072.1
072.2
072.31
072.32
074.1
075
081.2
081.3
112.4
121
211
221
221
221
231.1
242
243
263.1
265.4
271.3
281
283.1*
283.3*
283.4*
283.5*
283.6*
283.7
283.92
286.0
331
332
421.4
422.2
422.3
422.4
513.65
611
631.1
631.2
651
652
655.61
841.2
.1
.2
.3
Market shares
Growth rates in value, volume and
prices
Trends in market shares
Indices of specialization
Analysis of each product (58
pro-ducts: SITC Rev. 1)
Meat of bovine animals
Fish, fresh and simply preserved
Fish, crustácea, etc., preserved
Rice in the husk
Rice glazed or polished
Bananas
Fruits, preserved
Dried leguminous vegetables
Manioc, arrow root
Raw sugar
Coffee, green or roasted
Coffee extracts, essences
Cocoa beans
Cocoa powder
Cocoa paste
Cocoa butter
Tea
Spices
Residues from cereals
Oil seed cake
Distilled alcoholic beverages
Tobacco, unmanufactured
Hides and skins
Groundnuts (peanuts)
Copra
Palm nuts and kernels
Natural rubber
Wood in the rough
Wood, shaped or simply worked
Raw cotton
Sisal
Natural phosphates
Iron ores and concentrates
Copper ores and concentrates
Aluminium ores and concentrates
Lead ores and concentrates
Zinc ores and concentrates
Tin ores and concentrates
Manganese ores and concentrates
Tungsten ores and concentrates
Uranium ores and concentrates
Petroleum, crude
Petroleum products
Groundnut oil
Palm oil
Coconut (copra) oil
Palm kernel oil
Aluminium oxydes and hydroxydes
Leather
Veneered sheets
Plywood including veneered panels
Textile yarn and thread
Cotton fabrics, woven
Cordage, cable, twine
Clothing of textile fabric
329
330
331
332
4.1.3.
4.1.4.
4.1.5.
4.1.6.
4.2.
332
335
337
339
341
343
345
347
349
351
353
356
358
360
362
364
366
368
371
373
375
377
379
382
384
386
388
390
393
395
398
400
402
404
406
408
410
412
414
416
419
420
422
425
427
429
431
433
436
438
440
442
444
447
449
011.1
031
032
042.1
042.2
051.3
053
054.2
054.81
061.1
071.1
071.3
072.1
072.2
072.31
072.31
074.1
075
081.2
081.3
112.4
121
211
221.1
221:2
221.3
231.1
242
243
263.1
265.4
271.3
281
283.1*
283.3*
283.4*
283.5*
283.6*
283.7
283.92
286.0
331
332
421.4
422.2
422.3
422.4
513.65
611
631.1
631.2
651
652
655.61
841.1
Parts de marché
L'évolution des valeurs, des quantités
et des prix
L'évolution des parts de marché
Les indices de spécialisation
Analyse par produit (58 produits:
CTCI rév. 1)
Viande bovine
Poissons frais ou simplement conservés
Poissons, crustacés, etc., conservés
Riz non décortiqué
Riz glacé ou poli
Bananes
Conserves de fruits
Légumes à cosses, secs
Manioc, arrow root
Sucre non raffiné
Café vert ou torréfié
Extraits ou essences de café
Fèves de cacao
Poudre de cacao
Pâte de cacao
Beurre de cacao
Thé
Épices
Résidus de céréales
Tourteaux
Boissons alcooliques distillées
Tabacs bruts
Cuirs et peaux
Arachides
Coprah
Noix et amandes de palmiste
Caoutchouc naturel
Bois bruts
Bois équarris ou dégrossis
Coton brut
Sisal
Phosphates naturels
Minerais de fer et concentrés
Cuivre, minerais et concentrés
Aluminium, minerais et concentrés
Plomb, minerais et concentrés
Zinc, minerais et concentrés
Étain, minerais et concentrés
Manganèse, minerais et concentrés
Tungstène, minerais et concentrés
Uranium, minerais et concentrés
Pétrole brut
Produits dérivés du pétrole
Huiles d'arachide
Huile de palme
Huile de coprah
Huile de palmiste
Oxydes d'aluminium — alumine
Cuirs
Feuilles de placage en bois
Bois plaqués et contre-plaqués
Filés et fils textiles
Tissus de coton
PART FIVE
CINQUIÈME PARTIE
5.1
Terms of trade of the EC with the
ACP countries 1970-80
Changes in the value, unit value and
volume indices for EC/ACP trade
5.
5.1.
5.1.1.
5.1.2.
5.1.3.
Change in imports
Change in exports
Import-export comparison
All
479
479
5.1.1
5.1.2
5.1.3
5.2. Change in the unit value indices and ' 5.2.
the terms-of-trade indices for trade
between the EC and the ACP countries
and broad regional groupings
5.2.1. Changes in the Community unit values,
480
5.2.1.
1970-80
5.2.1.1. Changes in indices, petroleum included
5.2.1.2. Movement of the indices, petroleum
excl.
5.2.1.3. Overall comparison of the movement
of unit values
5.2.2. Movement of EC/ACP terms-of-trade
index
5.2.2.1. Movement of the terms-of-trade index,
petroleum included
5.2.2.2. Movement of the terms-of-trade,
pe-troleum excluded
5.3. 'Bartering power' of products in EC- 5.3.
ACP trade
5.3.1 Bartering power of ACP products in
493
5.3.1.
relation to the EC
5.3.2. Bartering power of ACP products in
496
5.3.2.
relation to those of Member States of
the EC
480
484
486
486
486
489
5.2.1.1.
5.2.1.2.
5.2.1.3.
5.2.2.
5.2.2.1.
5.2.2.2.
Les termes de l'échange de la CE
avec les pays ACP 1970-80
Évolution des indices de valeur, de
valeur unitaire et de volume des
échanges CE-ACP
Évolution à l'importation
Évolution à l'exportation
Comparaison importation-exportation
Évolution des indices de valeurs
unitaires et des termes de l'échange
de la CE avec les pays ACP et par
grandes régions
Évolution des indices de valeurs
uni-taires de la Communauté, 1970-80
Évolution des indices, pétrole inclus
Évolution des indices, pétrole exclu
Comparaison de l'évolution de
l'en-semble des valeurs unitaires
Évolution de l'indice des termes de
l'échange de la CE et des pays ACP
Évolution de l'indice des termes de
réchange, pétrole inclus
Évolution des termes de l'échange,
pé-trole exclu
«Pouvoir de troc» des produits entrant
dans les échanges CE-ACP
Pouvoir de troc de produits ACP par
rapport à la CE
Pouvoir de troc des produits ACP par
rapport à ceux des États membres de
la CE
INTRODUCTION
INTRODUCTION
This publication analyses the development and structure of trade between the Community and the main industrialized countries on the one hand and the ACP States on the other, over the period from 1970 to 1981.
The first part consists of three chapters: the first chapter summarizes the general aspects of the ACP States' economic situation. The aim of the second chapter is to determine the part played by the ACP States in world trade and the desti-nation and origin of this trade according to the main econo-mic zones. Finally, the third chapter examines briefly the trends in trade between the ACP States themselves.
The second part comprises three chapters. The first analyses in overall terms and by broad categories of products trade between the Community as a whole and each ACP State. It also includes a comparison between EUR 10 and the main industrialized countries. The second chapter contains an analysis of each Member State's trade with the ACP States as a whole, and the same analysis for Spain and Portugal is given in chapter 3.
The third part analyses the trade of the European Community and the main industrialized countries with the ACP States by Broad Economic Categories (BEC): this classification has the advantage of grouping products together according to their economic purpose: consumer goods, intermediate products, capital goods.
The fourth part examines Community imports of some 60
products, which represent the main products exported by the ACP countries.
The fifth and last part contains a brief analysis of trends in the terms of trade between EUR 10 and the ACP coun-tries from 1970 to 1980.
The introduction is followed by a brief methodological note showing certain differences between the statistics published in the present study and those published elsewhere by EUROSTAT. A list of the main sources of the statistics contained in this publication is given at the end of the methodological note.
The study was conducted by Mr A. De Michelis, Head of the Specialized Service 'Analyses and Developments' at EU ROSTAT, under the guidance of Mr S. Ronchetti, Director. The study was prepared jointly by EUROSTAT (Parts 1 and 5), namely Messrs G. Delannoy and D. Koszerek, and a group of researchers at the Statistical Institute of the Uni-versity of Milan led by Professor G. Landenna. In particular the second part was prepared by Prof. G. C. Blangiardo, the third part by Mr. A. D'Angiò and the fourth part by Prof. M. Martini; (the review by product has been prepared by Mr. D. De Lucchi, whilst Mr. M. Boffi carried out the data processing.
The translation from the original languages into French and/ or English was prepared by the medium - and long-term Translation Service of the Commission of the European Communities.
La présente publication analyse de développement et la structure des échanges commerciaux entre la Communauté et les principaux pays industrialisés d'une part et les Etats ACP d'autre part, pour la période allant de 197Ö à 1981. La première partie est composée de trois chapitres: le premier chapitre expose synthétiquement les aspects généraux de la situation économique des Etats ACP. Le deuxième a pour but de déterminer l'importance des Etats ACP dans les échanges mondiaux ainsi que la destination et la provenance de ces échanges selon les principales zones économiques. Enfin, le troisième chapitre examine brièvement l'évolution des échanges entre les Etats ACP eux-mêmes.
La deuxième partie comprend trois chapitres. Le premier
analyse globalement et par grandes catégories de produits le commerce entre la Communauté dans son ensemble et chaque Etat ACP. Y figure également une comparaison entre la CE et les principaux pays industrialisés. Le deuxième chapitre complète l'analyse des échanges avec l'ensemble des Etats ACP pour chacun des Etats membres, et la même analyse pour l'Espagne et le Portugal figure au chapitre 3.
La troisième partie analyse les échanges de la CE et des
principaux pays industrialisés avec les ACP par Grandes Catégories Economiques (GCE): cette classification présente l'intérêt de regrouper les produits en fonction de leur destination économique: produits de consommation, produits intermédiaires, biens d'investissement.
La quatrième partie examine les importations
communautai-res d'une soixantaine de produits qui représentent les principales productions exportées par les pays ACP.
La cinquième et dernière partie comporte une brève analyse de l'évolution des termes de l'échange entre la CE et les ACP de 1970 à 1980.
Une brève note méthodologique met en lumière certaines différences entre les statistiques publiées dans la présente étude et celles publiées ailleurs par l'EUROSTAT. La liste des principales sources des statistiques contenues dans cette publication se trouve à la fin de la note méthodologique. La conduite de l'étude a été assurée par M. A. De Michelis, chef du service spécialisé "Analyses et Développement" de l'EUROSTAT, sous la direction de M. S. Ronchetti, directeur. L'étude a été préparée jointement par l'EUROSTAT, MM. G. Delannoy et D. Koszerek (parties 1 et 5) et un groupe d'experts de l'"lstituto di Scienze Statistiche e Matematiche
Marcello Boldrini" de l'Université de Milan, dirigé par le Prof. G.P. Landenna, et notamment la deuxième partie a été préparée par le Prof. G.C. Blangiardo, la troisième partie par M.A. D'Angiò, la quatrième par le Prof. M. Martini; les fiches par produit ont été préparées par M.D. De Lucchi. M.M. Boffi a contribué au traitement informatique.
METHODOLOGY AND SOURCES
METHODOLOGIE ET SOURCES
A. GENERAL CONSIDERATIONS
As for as the methodology is concerned, the following points should be made clear:
¡) the nature and limitations of the statistical sources used;
ii) the criteria governing the selection and grouping of the geographical zones;
iii) the selection criteria used in defining the products to be analysed.
Except where explicitly indicated, the data are taken from the UN Statistical Office's 'COMTRADE' data bank.
For the EUR 10 economic zone shown in the tables, the data are not therefore trade statistics harmonized with regard to concepts and methods as usually published by EUROSTAT, but external trade data which the Member States' statistical institutes compile in accordance with national concepts and usually send to the international organizations.
The main differences between the two sources concern the compilation of data according to countries of origin or consignment of the products and in accordance with the concept of 'special trade' or 'general trade'.
This may lead to discrepancies between the statistics given in this study and those produced by EUROSTAT and pub-lished in the form of microfiches, bulletins or yearbooks on external trade.
There are two reasons why this study uses non-harmonized statistics: the first is the length of the time series as regards the availability of the data, while the second concerns the length of the series as regards the consistency of the classifi-cations.
EUROSTAT's methods of processing trade statistics are based on concepts which have been standardized only in the last few years, particularly as regards the Member States which have joined the Community since 1973.
This study analyses the development of the European Com-munity's imports for the ACP countries since 1970. In order to ensure some degree of consistency in the data for the purposes of temporal analysis, it was therefore preferable to take the series produced by the Member States rather than those compiled by the European Community. This was done by using the statistics contained in the Geneva data bank.
As regards the second reason, the Geneva data bank is the only one that can be used to monitor the development of trade in a given product from 1963 to 1981, since the data are available for the whole period according to the SITC Rev. 1, whereas the Community statistics are available for the Member States according to the SITC Rev. 1 up to 1977 only and according to the SITC Rev. 2 from 1978 onwards. Direct comparison of the two classifications is not
A. CONSIDERATIONS GENERALES
Du point de vue méthodologique, il convient de préciser: i) La nature et les limites des sources statistiques utilisées; ii) Les critères de choix et de regroupement des zones
géographiques;
iii) Les critères de choix adoptés pour définir les produits à analyser.
Sauf exceptions expressément signalées il s'agit de données provenant de la banque de données "COMTRADE" du Bureau Statistique des Nations Unies.
Pour la zone économique EUR 10 qui apparaît dans les tableaux, il ne s'agit donc pas de statistiques des échanges harmonisées sur le plan des concepts et des méthodes habi-tuellement publiées par l'EUROSTAT, mais des données sur le commerce extérieur que les Instituts statistiques des Etats membres élaborent selon des concepts nationaux et communiquent habituellement aux organismes internatio-naux.
Les principales différences entre les deux sources portent sur l'élaboration des données suivant les pays d'origine ou de provenance des produits, ainsi que suivant le concept de "commerce spécial" ou de "commerce général".
Cela peut entraîner d'éventuelles discordances entre les statistiques présentées dans cette étude et celles élaborées par l'EUROSTAT et publiées sous forme de microfiches, bulletins ou annuaires du commerce extérieur.
Les raisons pour lesquelles cette étude utilise des statistiques non harmonisées sont au nombre de deux: la première est celle de la longueur des séries historiques en ce qui concerne la disponibilité des données,la seconde concerne la longueur des séries en ce qui concerne la cohérence des nomenclatures. Les traitements de statistiques commerciales EUROSTAT suivent des concepts qui ne sont uniformisés que depuis quelques années seulement, et particulièrement en ce qui concerne les pays membres qui sont entrés dans la Commu-nauté depuis 1973.
La présente étude analyse l'évolution des importations de la Communauté Européenne en provenance des pays ACP depuis 1970. Donc, pour assurer une certaine cohérence des données dans l'analyse temporelle, il était préférable de reprendre les séries élaborées par les Etats membres plutôt que celles élaborées par la CE. Cela a été possible en utilisant les statistiques contenues dans la banque de données de Genève.
com-The second point concerns the definition of the countries and geographical zones analysed in this study and the types of trade used in the statistics analysed. The study presents series of data which analyse trends in Community imports from the ACP countries, Class 2 countries and the rest of the world. In defining the countries or groups of countries, the following criteria as given in EUROSTAT's Geonomenclature were used:
a) European Community (EUR 10): comprises all the countries belonging to the EC as at 1 January 1983, i.e. including Greece.
b) Applicant States: Spain and Portugal.
c) ACP: in the publication the abbreviation ACP is follo-wed immediately by the figure 62; this means that the group of countries studied comprises 62 ACP countries, divided into five zones:
West Africa:
Mauritania, Mali, Upper Volta, Niger, Republic of Cape Verde, Senegal, Gambia, Guinea Bissau, Guinea, Sierra Leone, Liberia, Ivory Coast, Ghana, Togo, Benin, Nigeria.
Central Africa:
Chad, Cameroon, Central African Republic, Equatorial Guinea, Sao Tomé and Principe, Gabon, Congo, Zaire, Burundi.
East and Southern A frica :
Sudan, Rwanda, Ethiopia, Djibouti, Somalia, Kenya, Uganda, Tanzania, Seychelles and Dependencies, Madagascar, Mauritius, Comoros, Zambia, Zimbabwe, Malawi, Botswana, Swaziland, Lesotho.
Caribbean :
Belize, Bahamas, Dominica, Jamaica, St Lucia, St Vincent, Barbados, Trinidad and Tobago, Grenada, Guyana, Suriname. Pacific:
Papua New Guinea, Solomon Islands, Tuvalu, Kiribati, Pitcairn, Fiji, Vanuatu, Tonga, Western Samoa.
d) Developing countries (CL 2): all the countries included under code '1030' in EUROSTAT's 1981 Geonomencla-ture. It should be noted that all the ACP countries belong to the group CL 2.
e) Extra-EUR 10: all the countries of the world apart from the ten Community countries.
The volume of trade between EUR 10 and Extra-EUR 10 does not therefore include intra-Community trade.
B. INDICES
a) Trend indicators S/l
In order to synthesize and extrapolate the trends over time of the aggregates to be considered for the various areas concerned, each time series has been identified in the second part of this document by a (straight-line) function of the following type:
Y = I + St
Le deuxième point concerne la définition des pays et des zones géographiques analysées dans cette étude, ainsi que les types de commerce repris dans les statistiques analysées. L'étude présente des séries de données qui analysent l'évolu-tion des importal'évolu-tions communautaires en provenance des pays ACP, des pays de la Classe 2 et du reste du monde. Pour la définition des pays ou groupes de pays les critères suivant définis dans la géonomenclature EUROSTAT ont été utilisés:
a) Communauté Européenne (EUR 10): sont compris tous les pays faisant partie de la CE à la date du 1er janvier 1983 donc y compris la Grèce.
b) Pays candidats: Espagne et Portugal.
c) ACP: dans la publication l'abréviation ACP est immédia-tement suivie du chiffre 62: ceci signifie que le regrou-pement considéré comprend 62 pays ACP regroupés en cinq zones:
Afrique de l'Ouest:
Mauritanie, Mali, Haute-Volta, Niger, République du Cap Vert, Sénégal, Gambie, Guinée Bissau, Guinée, Sierra Leone, Libéria, Côte d'Ivoire, Ghana, Togo, Bénin, Nigéria.
Afrique Centrale:
Tchad, Cameroun, République Centrafricaine, Guinée Equatoriale, Sao Tomé et Prince, Gabon, Congo, Zaire, Burundi.
Afrique de l'Est et du Sud:
Soudan, Rwanda, Ethiopie, Djibouti, Somalie, Kenya, Ouganda, Tanzanie, Seychelles et dependances, Madagascar, Maurice, Comores, Zambie, Zimbabwe, Malawi, Botswana, Swaziland, Lesotho.
Caraïbes:
Belize, Bahamas, Dominique, Jamaïque, Ste Lucie, St Vin-cent, Barbade, Trinité et Tobago, Grenada, Guyana, Surinam.
Pacifique:
Papouasie Nouvelle Guinée, Iles Salomon, Tuvalu, Kiribati, Pitcairn, Fidji, Vanuatu, Tonga et Samoa Occidentales.
d) Pays en voie de développement (CL 2): tous les pays compris dans le code "1030" de la géonomenclature EUROSTAT 1981. Il faut noter que tous les pays ACP font partie du groupe CL 2.
e) Extra-EUR 10: tous les pays du monde à l'exclusion des 10 pays communautaires.
Le volume des échanges entre la CE et l'extra-EUR 10 ne comprend pas les échanges intracommunautaires.
B. LES INDICES
a) Indices de tendance S/l
Afin de décrire de façon succincte et d'extrapoler la dynami-que temporelle des grandeurs qui seront examinées, pour les différentes régions, dans la seconde partie de la présente étude, on a estimé qu'il convenait d'identifier chaque série chronologique par une fonction linéaire du type:
in which the variable Y represents in each case the monetary value or its percentage share of the ACP (62) total annual imports, exports or the trade balance of the areas considered; the variable t' (t = time; t' = t - 1975) takes the values —5, —4, —3, —2, —1,0, 1,2, , 5 representing, respectively, t = 1970, 1971, ..., 1980; and lastly the parameters I (inter-cept) and S (slope) represent respectively the intercept and gradient of the straight line.
The parameters I and S were established by means of the least squares method. In the context of the calculation procedure adopted they take on the following significance:
I identifies with the arithmetic mean of the values which comprise the time series. S represents the (absolute) 'average' annual variation of these values.
The S/l ratio can therefore be taken as the average annual value of the percentage rate of relative variation for the 1970-1980 period.
By way of example, let us consider the following time series relating to the 1970-1980 imports of two hypothetical countries A and B.
B's Imports
YB
40 42 43 45 47 50 53 55 57 58 60
The straight lines which interpolate the two time series by means of the least squares method are respectively: Years
t 1970 1971 1972 1973 1974 1975 1976 1977 1978 1979 1980
t'=t-1975
- 5 - 4 - 3 - 2 -1
0
1
2
3
4
5
A's Imports
YA
100 140 150 160 180 200 220 240 250 260 300
YA = 200 +
Therefore:
hence: 100 (S/I)A
18 t'
= 9;
and YB =50+2.11 t
lA=200; lB =50
SA = 18; SB=2-11
100 (S/l)B =4.22
In this specific case, the S/l index indicates in A a relative increase in imports equal to twice that for B.
b) Specialization index
The specialization index measures the degree of specializa-tion of a partner country as a supplier or purchaser of a given commodity to or from a declaring country.
dans laquelle la variable Y représente, selon les cas, la valeur ou sa part exprimée en pourcentage du total ACP (62), des importations, des exportations ou du solde commercial annuels des régions considérées. La variable t' (t = temps; t' = t-1975) prend les valeurs - 5 , - 4 , - 3 , - 2 , - 1 , 0 , 1,2, ...., 5 qui correspondent respectivement à t = 1970, 1971, ...., 1980; enfin, les paramètres I et S (pente) représentent respectivement du barycentre et le coefficient angulaire de cette droite.
On a déterminé les paramètres I et S par la méthode des moindres carrés. Dans la méthode de calcul adoptée, ils ont la signification suivante:
I représente la moyenne arithmétique des valeurs qui consti-tuent la série chronologique, S représente la variation (abso-lue) "moyenne" annuelle de ces valeurs.
Le rapport S/l exprime donc la valeur moyenne annuelle du taux (en pourcentage) de variation relative pour la période 1970-1980.
Prenons, à titre d'exemple, les séries chronologiques suivantes relatives aux importations 1970-1980 de deux pays hypothé-tiques A et B:
Années Importations de A Importations de B
t
1970 1971 1972 1973 1974 1975 1976 1977 1978 1979 1980
t'= t-1975
- 5 - 4 - 3 - 2 -1
0
1
2
3
4
5
100 140 150 160 180 200 220 240 250 260 300
B 40 42 43 45 47 50 53 55 57 58 60
Les droites qui interpolent les deux séries chronologiques, par la méthode des moindres carrés, sont respectivement:
YA= 2 0 0 + 18t' et YB =50 + 2,11 t'
Donc: lA =200; lß =50;
d'où:
1 0 0 ( S / I )A= 9 ;
SA = 18;SB =2,11;
100 (S/l)B =4.22
Dans le cas en question, l'indice S/l fait apparaître pour A une augmentation relative des importations égale au double de l'augmentation de B.
b) Indice de spécialisation
In this context:
Xp,: declaring country's (country A) imports of product i from country B;
X · . . : declaring country's imports of product i from the world;
X jß: declaring country's total imports from country B; X y . . : declaring country's total imports from the world.
Country B's specialization index I as a supplier of product i to the declaring country is determined as follows:
Xi B / XT B
XT B XT M
i.e. from the ratio between the share of imports of product i from country Β in relation to total imports of product i from the world and the share of total imports from country Β in relation to total imports from the world. The index is also equal to:
I = Xi B /
XT B '
2¡M_
T M
i.e. to the ratio between the relative importance of the product in country B's imports and the corresponding relative importance in imports from the world.
If the ratio is greater than one, country Β is 'specialized' as a supplier of product i to the declaring country.
Similarly, if the ratio calculated on the basis of the export values is greater than one, country Β is specialized as a purchaser of product i from country A.
Example: if the following are the values of country A's trade with country Β and with the world:
A's imports A's exports
from country
Β
from the world
to country
Β
to the world
Product I Total
100 2 000
1 000 4 0 000
100 1 000
2 000 20 000
We have the following values:
100
1 000
100
I (imports) =
/
=
2 000
/40 000
1 000
Β is specialized as a supplier of i to A :100 , 2 000 100
, 2 000
40 000
1 000 I (export)
1 000 ' 20 000 2 000 ' 20 000
Β is not specialiazed as a purchaser of i from A.
1;
acheteur d'un produit déterminé par rapportai au pays décla rant.
Soit:
X; B1
X;
les importations par le pays déclarant du produit i en provenance du pays B;
les importations par le pays A déclarant du produit i en provenance du reste du monde;
les importations totales du pays déclarant en pro venance du pays B;
les importations totales du pays déclarant en prove nance du reste du monde.
L'indice I de spécialisation du pays B en tant que fournisseur du produit i au pays déclarant est donné par:
M"
T B ·
T M "
XiB I VTB
¡M T M
o
c'estàdire par le rapport entre la part des importations du produit i en provenance du pays B sur les importations du produit i en provenance du reste du monde et la part des importations totales en provenance du pays B sur les im portations totales du reste du monde. L'indice est aussi égal à:
I = Xi B /Xi M XTQ T B Λ τ ι ι T M
c'estàdire au rapport entre le poids relatif du produit dans les importations provenant du pays B et le poids relatif correspondant dans les importations en provenance du reste du monde.
Si le rapport est supérieur à 1, le pays B est "spécialisé" en tant que fournisseur du produit i au pays déclarant.
De même, si le rapport calculé sur les valeurs des exporta tions est supérieur à 1, le pays B est spécialisé en tant qu'a cheteur du produit i provenant du pays A.
Exemple: étant donné les valeurs suivantes des échanges du pays A avec le pays B et avec le reste du monde,
Importations de A Exportations de A
Produit i Totaux
en provenance
du paysB
100 2 000
en provenance
du monde
1 000 4 0 000
vers pays B
100 1 000
vers rest du monde
2 000 20 000
On a:
I (importations) :
100
1 000
100 . 2 000
/
= 2:
2 000 ' 40 000
1 000
'
40 000
B est spécialisé en tant que fournisseur de i à A;100 , 2 000 100
I (exportations) = /
' 1
, 1 000
/ = 1 ;
1 000 ' 20 000 2 000 ' 20 000
c) Shift
This compares the import (or export) trends of one product for one country with the corresponding trends vizàvîz the rest of the world.
Taking the following:
0Xi B , tXi B :
0Xi M , tXi M :
declaring country's imports of product i from country Β during period O and period t respectively;
declaring country's imports of product i from the rest of the world during period O and period t respectively.
The shift is the result of:
t
XiB
oXiB
tXi M
oXiM
i.e. of the ratio between the time index related to period t (base 0) of imports of product i from country B and the corresponding index relating to imports from the rest of the world. The shift is also equal to:
tXi B o lb
tXi M
oXiM
i.e. to the ratio between the actual value of imports of product i from country B and the 'theoretical' value which it would have had if the pattern of imports from B had been the same as that from the rest of the world.
Example: given the following values of A's imports of product i from countries B.C.D and the rest of the world
from B from C from D
from the rest of the world
1975
100 200 100 1 000
1980
200 300 150 2 000
The gives:
B's shift as
C's shift as
D's shift as 200
100
500
200
150
/
/
/
2 000
1 000
2 000
1 000
2 000 = 1
000
1,25
= 0,75
A's imports from country B showed the same trend as imports from the world (shift = 1 ).
Country C's imports showed a more pronounced trend (shift = 1.25); country D's a less pronounced trend (shift = 0.75).
c) Taux de décalage
Avec le taux de décalage, on compare la dynamique des importations (ou des exportations) d'un produit provenant d'un pays avec la dynamique de cellesci en provenance du reste du monde.
Soit:
0Xi B e t tXi B
0Xi Me ttXi M
les importations par le pays déclarant du produit i provenant du pays B, respecti vement à la date O et à la date t;
les importations par le pays déclarant du produit i en provenance du reste du monde respectivement à la date O et à la date t. Le taux de décalage est donné par:
tXi B
0Xi B
/
tXi M
0Xi M
c'estàdire par le rapport entre l'indice temporel à la date t (base O) des importations du produit i en provenance du pays B et l'indice correspondant aux importations en pro venance du reste du monde. Le taux de décalage est ausli égal à:
tXi B / 0Xi B
t
XJM
0Xî Mc'estàdire au rapport entre la valeur effective des impor tations du produit i en provenance du pays B et la valeur "théorique" qu'elles auraient eue si la dynamique des im portations en provenance de B avait été la même que celle des importations en provenance du reste du monde.
Exemple: étant donné les valeurs suivantes des importations par le pays A du produit i en provenance des pays B, C, D et du reste du monde,
1975 1980
deB de C deD
du reste du monde
On a:
Taux de décalage de B
Taux de décalage de C
100 200
200 300
100 150
1 000 2 000
200 .2 000
100 1 000 "
500 f 2 000
200 1 000
1 5 0 , 2 000 Taux de décalage de D
= 1
100 1000
1,25
= 0,75
Les importations de A en provenance du pays B ont eu une dynamique identique à celle des importations provenant du reste du monde (taux de décalage = 1).
d) Average growth rate (AGR)
The AGR of the value, volume or unit value of trade during a period is equal to the geometric mean of the moving base indices for each year ( 1 , 2 , , t) calculated the pre vious year.
1
\X1 X2 Xt 1 / \ X 1 /
The AGR is given by the percentage difference:
ir
tef ι
AGRe) Indices of the terms of trade
χ 100
The following analysis will discuss in detail the changes in quantities and values.
Two questions, however, remain outstanding. Has there been an increase in trade at constant prices? Have the prices of the products exchanged between the Community and the ACP countries moved in the same or in different directions?
This question can be at least partially answered by calcula ting volume indices and unit values, from which the terms of trade indices can be derived. The answer in respect of these indices is partial to the extent that any estimate of the indices of the terms of trade is always a delicate undertaking, quite apart from the question of the meaning of the concept (representativeness of the products chosen, variations in their value, weighting etc.). This analysis has therefore been supplemented by an estimate of the 'bartering power' of a sample of products.
Unit values and terms of trade indices (net)
The period covered is 19701980. 1970 was chosen as a base in preference to 1975, when there was a general drop in the prices of basic products.
The analysis relates to the change in the unit value indices for Community imports from and exports to the ACP countries. The ratio of these indices thus determines the terms of Community/ACP trade. The reason for this un conventional approach lies in the difficulties in acquiring data from the ACP countries on their external trade.
Even the intermediate solution of calculating the index of the terms of ACP/EC trade from the reciprocal of the terms of EC/ACP trade cannot be adopted because of the difference between the cif and fob values.
Although the analysis is concerned with a Community/ACP comparison, two further elements of comparison have been introduced.
Firstly, because of the number of ACP countries and the characteristic differences between them, several subdivisions have been made: geographical subdivisions (distinction
d) Taux de croissance moyen (VAM)
L'indice de croissance moyen de la valeur des quantités ou des valeurs unitaires des échanges d'une période est égale à la moyenne géométrique des indices à base mobile de chaque année (1, 2,...., t) calculés au cours de l'année précédente.
1
F T
A
/^2_ *3_
*t\
/ M
\
X1
X2
Xt J
\
X1 /
Le taux de croissance moyen (VAM) est donné par la diffé rence exprimée en pourcentage:
VAM
[Qf
]
χ 100e) Indices des termes de l'échange
Dans la suite de l'analyse, l'évolution des quantités et des valeurs sera examinée de manière détaillée. Deux questions subsistent cependant: y atil eu un accroissement des échan ge entre la Communauté et les pays ACP? ontils évolué dans le même sens ou de façon différente?
Les éléments de réponse, au moins partiels, à cette question sont donnés par le calcul d'indices de volume, de valeurs uni taires, ces dernières permettent de déduire les indices des termes de l'échange. Concernant ces derniers indices, la réponse est partielle dans la mesure où toute évaluation des indices des termes de l'échange se révèle, indépendamment de la signification du concept, toujours délicate (représentativi té des produits retenus, variation de leur valeur, choix des pondérations...). Aussi, cette analyse est complétée par une évaluation du "pouvoir de troc" d'un échantillon de pro duits.
Valeurs unitaires et indices des termes de l'échange nets
L'analyse couvre la période 19701980. L'année 1970 a été retenue comme base de préférence à 1975 qui fût marquée par une baisse généralisée des cours des produits de base.
Elle porte sur l'évolution des indices de valeurs unitaires à l'importation et à l'exportation de la Communauté et les pays ACP. Le rapport de ces indices définira donc l'indice des termes de l'échange de la Communauté avec les pays ACP. Cette présentation, non conventionnelle, tient aux difficultés de saisie de données du commerce extérieur des pays ACP en tant que déclarants.
Même la solution intermédiaire, consistant à calculer l'indice des termes de l'échange des ACP avec la CE à partir de l'in verse des termes de l'échange de la CE avec les ACP, ne peut être retenue en raison de l'écart des valeurs caf/fob.
Bien que l'analyse porte sur une comparaison Communauté ACP, deux éléments de comparaison ont été introduits.