Open Access
R499 Vol 6 No 5
Research article
Transcriptomic changes in human breast cancer progression as
determined by serial analysis of gene expression
Martin C Abba
1, Jeffrey A Drake
1, Kathleen A Hawkins
1, Yuhui Hu
1, Hongxia Sun
1,
Cintia Notcovich
1, Sally Gaddis
1, Aysegul Sahin
2, Keith Baggerly
3and C Marcelo Aldaz
11Department of Carcinogenesis, The University of Texas MD Anderson Cancer Center, Science Park – Research Division, Smithville, Texas, USA 2Department of Pathology, The University of Texas MD Anderson Cancer Center, Houston, Texas, USA
3Department of Biostatistics, The University of Texas MD Anderson Cancer Center, Houston, Texas, USA
Corresponding author: C Marcelo Aldaz, [email protected]
Received: 2 Mar 2004 Revisions requested: 17 May 2004 Revisions received: 21 May 2004 Accepted: 25 May 2004 Published: 6 Jul 2004
Breast Cancer Res 2004, 6:R499-R513 (DOI 10.1186/bcr899)http://breast-cancer-research.com/content/6/5/R499
© 2004 Abba et al.; licensee BioMed Central Ltd. This is an Open Access article: verbatim copying and redistribution of this article are permitted in all media for any purpose, provided this notice is preserved along with the article's original URL.
Abstract
Introduction Genomic and transcriptomic alterations affecting
key cellular processes such us cell proliferation, differentiation and genomic stability are considered crucial for the development and progression of cancer. Most invasive breast carcinomas are known to derive from precursor in situ lesions. It is proposed that major global expression abnormalities occur in the transition from normal to premalignant stages and further progression to invasive stages. Serial analysis of gene expression (SAGE) was employed to generate a comprehensive global gene expression profile of the major changes occurring during breast cancer malignant evolution.
Methods In the present study we combined various normal and
tumor SAGE libraries available in the public domain with sets of breast cancer SAGE libraries recently generated and sequenced in our laboratory. A recently developed modified t
test was used to detect the genes differentially expressed.
Results We accumulated a total of approximately 1.7 million
breast tissue-specific SAGE tags and monitored the behavior of more than 25,157 genes during early breast carcinogenesis.
We detected 52 transcripts commonly deregulated across the board when comparing normal tissue with ductal carcinoma in situ, and 149 transcripts when comparing ductal carcinoma in situ with invasive ductal carcinoma (P < 0.01).
Conclusion A major novelty of our study was the use of a
statistical method that correctly accounts for the intra-SAGE and inter-SAGE library sources of variation. The most useful result of applying this modified t statistics beta binomial test is the identification of genes and gene families commonly deregulated across samples within each specific stage in the transition from normal to preinvasive and invasive stages of breast cancer development. Most of the gene expression abnormalities detected at the in situ stage were related to specific genes in charge of regulating the proper homeostasis between cell death and cell proliferation. The comparison of in situ lesions with fully invasive lesions, a much more heterogeneous group, clearly identified as the most importantly deregulated group of transcripts those encoding for various families of proteins in charge of extracellular matrix remodeling, invasion and cell motility functions.
Keywords: breast cancer, gene expression profiling, serial analysis of gene expression
Introduction
Invasive ductal breast carcinoma (IDC) is the most com-mon malignancy of the breast, accounting for ~80% of all invasive breast tumors [1]. Although an issue of much con-troversy over the years, there is now general agreement and overwhelming histopathological and genetic evidence indi-cating that most invasive breast carcinomas appear to develop gradually from defined precursor lesions [2]. How-ever, it also became clear that progression toward more
aggressive phenotypes is not obligatory [3]. It is further evi-dent that many genetic abnormalities underlying tumor pro-gression are probably phenotypically silent.
Numerous molecular genetic changes have been reported as relevant in human breast carcinogenesis, such as anom-alies affecting cell proliferation, apoptosis and invasion [4]. Preinvasive breast lesions such as high-grade ductal carci-noma in situ (DCIS) are known to have acquired a myriad
R500
of genomic and transcriptomic changes, but as their name implies they are not yet invasive. The development of the ability to invade surrounding tissues is perhaps the most critical event in cancer progression. Among proposed inva-sion-related genes with reported altered expression in tumor cells are cell adhesion molecules, proteases and cytoskeletal molecules that may influence motility [5]. Iden-tifying the key and most common gene expression abnor-malities involved in the transition steps from preinvasion to a fully invasive phenotype is an extremely important topic of research and the main objective of the present report. Studies on this area may provide clues to better diagnose premalignant lesions at high risk of progression and may aid in achieving a better understanding of critical early molecular mechanisms involved in breast cancer evolution.
Serial analysis of gene expression (SAGE) is a comprehen-sive profiling method that allows for global, unbiased and quantitative characterization of transcriptomes [6,7]. SAGE provides a statistical description of the mRNA population present in a cell without prior selection of the genes to be studied, and this constitutes a major advantage. In this sense, only open systems can identify expressed genes that have not yet been cloned or partially sequenced. A second major advantage is that the information generated is digital in format, and can be directly compared with data generated from any other laboratory or with data available in public databases such as the Cancer Genome Anatomy Project http://cgap.nci.nih.gov/SAGE.
To perform a comparative SAGE analysis of normal, prein-vasive and inprein-vasive lesions, we used a modified t test that we have recently developed [8]. This method has the advantage of taking into account both the intra-sample and inter-sample variability, identifying 'common patterns' of gene changes systematically occurring across samples. Most of the tests developed for measuring differential expression in SAGE data focus on capturing the first type of variation correctly, but tend to neglect the second type [9,10]. The aim of the present study was to provide a sta-tistically robust global gene expression analysis on the pro-gression of breast cancer using the described statistical approach comparing breast normal and tumor SAGE librar-ies obtained from public databases combined with addi-tional SAGE libraries recently generated in our laboratory.
Materials and methods
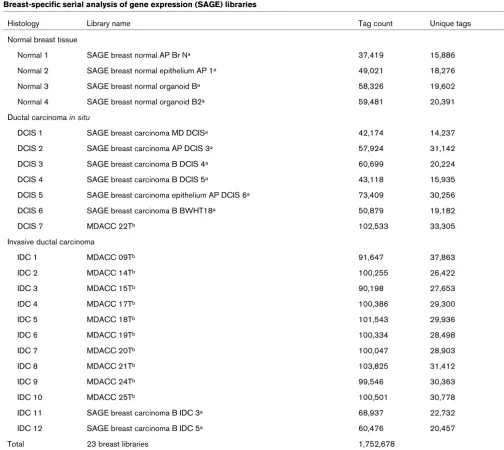
SAGE librariesTo perform the comparative analysis of different stages of breast cancer progression, we combined SAGE libraries available in public databases with breast cancer libraries generated and sequenced at our own laboratory. To this end, 12 SAGE libraries of breast tissues (four normal breast tissues, six DCIS tissues and two IDC tissues) were downloaded from the Cancer Genome Anatomy Project –
SAGE Genie database (libraries generated at the Polyak Laboratory, Dana-Farber Cancer Institute, Boston, MA, USA). We used 11 additional breast cancer SAGE libraries generated by ourselves, at an approximate resolution of 100,000 SAGE tags per library. All IDC SAGE libraries used in this study were from lymph node-negative, estrogen receptor-positive and progesterone receptor-positive tumor samples, with a tumor size classification of T1 or T2 (i.e. T1–T2 N0 M0). Table 1 summarizes all the SAGE libraries used in this comparative analysis.
SAGE methodology
For the SAGE libraries generated in our laboratory we fol-lowed standard methods. Briefly, total RNA was extracted from snap-frozen tissues using TRIzol (Invitrogen, San Fran-cisco, CA, USA). SAGE library construction was per-formed with the I-SAGE kit (Invitrogen) according to the manufacturer's protocol and introducing only minor modifi-cations. The anchoring enzyme was NlaIII and the tagging enzyme used was BsmFI. Concatemerized ditags were cloned into pZERO-1 and sequenced with an ABI 3700 DNA Analyzer (Applied Biosystems, Foster City, CA, USA).
SAGE data processing
SAGE tags were extracted from sequencing files using the SAGE2000 software version 4.0 (a kind gift from Dr K. Kin-zler, John Hopkins School of Medicine, Baltimore, MD, USA). Tag abundances for all libraries were normalized to a total of 100,000 tags (at which level a tag present 10 times has an abundance of 0.01%). Tag to gene assign-ments as well as additional annotations using public data-bases (e.g. Gene Ontology, Locus Link, Unigene cluster) were performed, using web-based SAGE library tools developed by ourselves http://spi.mdacc.tmc.edu/bitools/ about/sage_lib_tool.html. In our comparison we used only tags with only one reliable assigned gene.
Statistical analysis of SAGE libraries
To compare the 23 SAGE libraries, we utilized a modified t test recently developed by us [8]. This analysis allowed us to identify SAGE tags with significantly different expression levels (P < 0.01) between normal tissue and DCIS and between DCIS and IDC. Tags with total counts of less than three in all libraries were filtered out before the analysis. In order to enable visualization and illustration of our analyses, we utilized the TIGR MultiExperiment Viewer (MeV 2.2) software (The Institute for Genomic Research, Rockville, MD, USA). This tool was employed for normalization and average clustering of the SAGE data.
R501 and illustrate further the differences found by the modified
t test, showing the clusters of differentially coexpressed genes between the normal tissue, DCIS and IDC groups.
Results and discussion
Generation and analysis of SAGE libraries
The primary goal of our study was to identify the most com-monly occurring transcriptome changes in the transition from normal breast epithelium to DCIS and invasive carci-noma. To this end, SAGE data obtained from 11 breast cancer libraries generated in our laboratory (1,090,815 tags) were combined and compared with data available in the public domain (661,863 tags), thus generating a
data-set of almost 1.7 million breast cancer and normal specific tags, representing approximately 25,157 transcripts from a total of 23 libraries (Table 1).
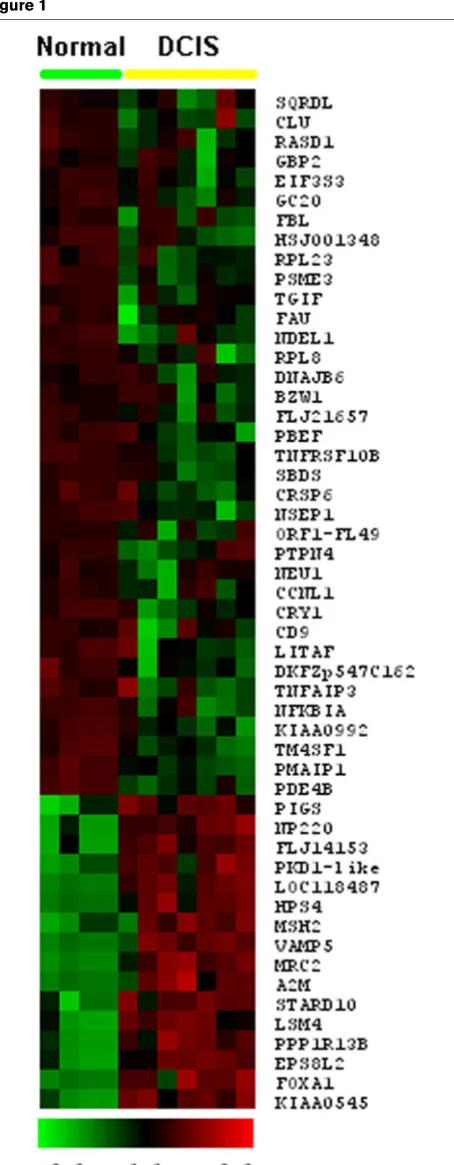
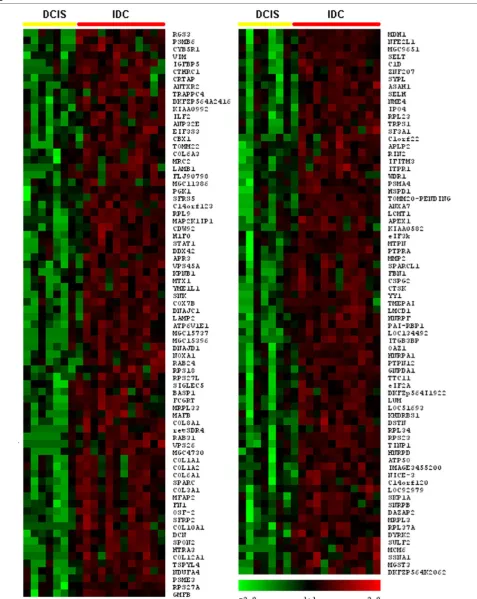
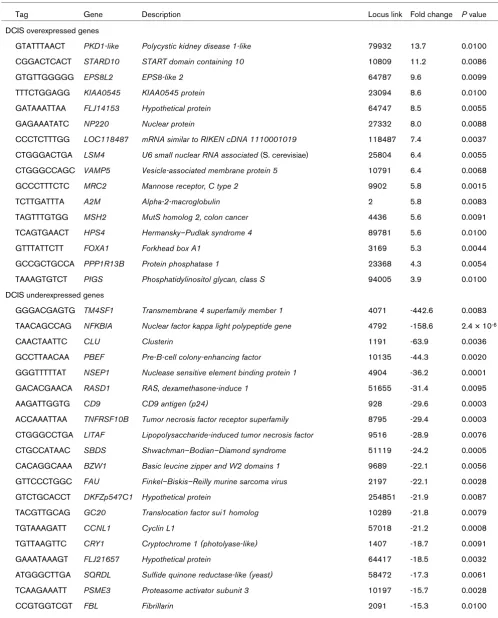
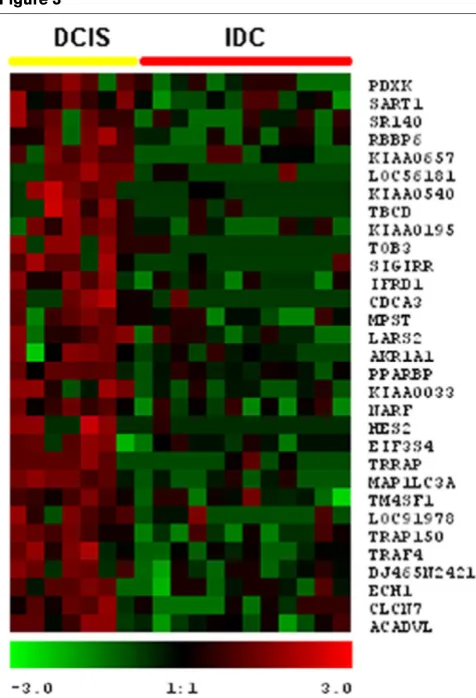
[image:3.612.53.557.103.553.2]Our statistically stringent analysis revealed 52 transcripts commonly deregulated across the board when comparing normal tissue with DCIS (Fig. 1), and 149 transcripts when comparing DCIS with IDC (P < 0.01) (Fig. 2) (see addi-tional data files 1 and 2 for addiaddi-tional information with sta-tistical cutoff at P < 0.05). Selected genes based on relative abundance, highly statistical differences and high fold changes between compared groups are sorted and represented in Tables 2 and 3.
Table 1
Breast-specific serial analysis of gene expression (SAGE) libraries
Histology Library name Tag count Unique tags
Normal breast tissue
Normal 1 SAGE breast normal AP Br Na 37,419 15,886
Normal 2 SAGE breast normal epithelium AP 1a 49,021 18,276
Normal 3 SAGE breast normal organoid Ba 58,326 19,602
Normal 4 SAGE breast normal organoid B2a 59,481 20,391
Ductal carcinoma in situ
DCIS 1 SAGE breast carcinoma MD DCISa 42,174 14,237
DCIS 2 SAGE breast carcinoma AP DCIS 3a 57,924 31,142
DCIS 3 SAGE breast carcinoma B DCIS 4a 60,699 20,224
DCIS 4 SAGE breast carcinoma B DCIS 5a 43,118 15,935
DCIS 5 SAGE breast carcinoma epithelium AP DCIS 6a 73,409 30,256
DCIS 6 SAGE breast carcinoma B BWHT18a 50,879 19,182
DCIS 7 MDACC 22Tb 102,533 33,305
Invasive ductal carcinoma
IDC 1 MDACC 09Tb 91,647 37,863
IDC 2 MDACC 14Tb 100,255 26,422
IDC 3 MDACC 15Tb 90,198 27,653
IDC 4 MDACC 17Tb 100,386 29,300
IDC 5 MDACC 18Tb 101,543 29,936
IDC 6 MDACC 19Tb 100,334 28,498
IDC 7 MDACC 20Tb 100,047 28,903
IDC 8 MDACC 21Tb 103,825 31,412
IDC 9 MDACC 24Tb 99,546 30,363
IDC 10 MDACC 25Tb 100,501 30,778
IDC 11 SAGE breast carcinoma B IDC 3a 68,937 22,732
IDC 12 SAGE breast carcinoma B IDC 5a 60,476 20,457
Total 23 breast libraries 1,752,678
R502
As expected, we detected various ribosomal genes among the most abundant transcripts in all the breast SAGE librar-ies, and these genes were highly upregulated in the inva-sive carcinomas. This agrees with the previous global expression profiles and with the comparisons of cancers and the corresponding normal tissues in general [7,11,12]. To simplify illustration of the data, ribosomal genes are not included in the figures and tables.
Global comparison of normal tissues and DCIS
Among the 52 transcripts detected as differentially expressed in DCIS (P < 0.01), 36 were downregulated transcripts and 16 were upregulated transcripts in these lesions when compared with normal breast epithelial cells and mammary epithelial organoids (Fig. 1 and Table 2). We defined and classified the 52 genes differentially expressed into the nine functional categories [13] shown in Fig. 3a. Interestingly, we found that 38% of these transcripts are related to the cell cycle (15%), signal transduction (8%) and apoptosis (15%).
As expected, our analysis of DCIS versus normal breast epithelium revealed numerous similarities with SAGE data reported previously [12,14], but more importantly it also provided novel information. The expression of numerous genes was significantly downregulated in DCIS, including: transmembrane 4 super family member 1 (TM4SF1), nuclear factor kappa light polypeptide (NFKB1A), pre-B-cell (PBEF), RAS dexamethasone-induced (RASD1), tumor necrosis factor receptor superfamily member 10b (TNFRSF10B), and tumor necrosis factor α-induced pro-tein (TNFAIP). All these transcripts were also observed downregulated in previous reports [12,14] (Table 2). On the contrary, our analysis revealed additional clusters of genes significantly downregulated in the DCIS group that were not previously reported by others: clusterin/apolipo-protein J (CLU), nuclease sensitive element binding pro-tein 1 (NSEP1), lipopolysaccharide-induced TNF factor (LITAF/PIG7), basic leucine zipper/W2 domains 1 (BZW1), and cyclin L1 (CCNL1) (Table 2).
[image:4.612.64.291.86.669.2]Clusterin was one of the most dramatically downregulated genes (-63.9-fold; P = 0.0036) in DCIS libraries. This gene encodes a heterodimeric, highly conserved, secreted glycoprotein. Alterations in Clusterin expression and/or protein maturation are linked to changes in tissue growth or regression, which may be related to specific proapoptotic or antiapoptotic protein isoforms [15]. Clusterin was reported as overexpressed during tissue and cell involution, and was downregulated in esophageal squamous cell car-cinoma and prostate carcar-cinoma, suggesting that this expression alteration could be a general phenomenon dur-ing tumor progression [16,17]. On the contrary, and in con-trast to these and our observations, Redondo and colleagues reported increased Clusterin expression in Figure 1
Hierarchical clustering of the most commonly different expressed genes between normal breast tissue and ductal carcinoma in situ
(DCIS) groups (P < 0.01)
R503 Figure 2
Hierarchical clustering of the most commonly differentially expressed genes between ductal carcinoma in situ (DCIS) and invasive ductal carcinoma (IDC) groups (P < 0.01)
R504
Table 2
Most frequent differentially expressed genes between normal breast epithelium and ductal carcinoma in situ (DCIS)
Tag Gene Description Locus link Fold change P value
DCIS overexpressed genes
GTATTTAACT PKD1-like Polycystic kidney disease 1-like 79932 13.7 0.0100 CGGACTCACT STARD10 START domain containing 10 10809 11.2 0.0086
GTGTTGGGGG EPS8L2 EPS8-like 2 64787 9.6 0.0099
TTTCTGGAGG KIAA0545 KIAA0545 protein 23094 8.6 0.0100
GATAAATTAA FLJ14153 Hypothetical protein 64747 8.5 0.0055
GAGAAATATC NP220 Nuclear protein 27332 8.0 0.0088
CCCTCTTTGG LOC118487 mRNA similar to RIKEN cDNA 1110001019 118487 7.4 0.0037 CTGGGACTGA LSM4 U6 small nuclear RNA associated (S. cerevisiae) 25804 6.4 0.0055 CTGGGCCAGC VAMP5 Vesicle-associated membrane protein 5 10791 6.4 0.0068 GCCCTTTCTC MRC2 Mannose receptor, C type 2 9902 5.8 0.0015
TCTTGATTTA A2M Alpha-2-macroglobulin 2 5.8 0.0083
TAGTTTGTGG MSH2 MutS homolog 2, colon cancer 4436 5.6 0.0091 TCAGTGAACT HPS4 Hermansky–Pudlak syndrome 4 89781 5.6 0.0100
GTTTATTCTT FOXA1 Forkhead box A1 3169 5.3 0.0044
GCCGCTGCCA PPP1R13B Protein phosphatase 1 23368 4.3 0.0054 TAAAGTGTCT PIGS Phosphatidylinositol glycan, class S 94005 3.9 0.0100 DCIS underexpressed genes
GGGACGAGTG TM4SF1 Transmembrane 4 superfamily member 1 4071 -442.6 0.0083 TAACAGCCAG NFKBIA Nuclear factor kappa light polypeptide gene 4792 -158.6 2.4 × 10⁻⁶
CAACTAATTC CLU Clusterin 1191 -63.9 0.0036
GCCTTAACAA PBEF Pre-B-cell colony-enhancing factor 10135 -44.3 0.0020 GGGTTTTTAT NSEP1 Nuclease sensitive element binding protein 1 4904 -36.2 0.0001 GACACGAACA RASD1 RAS, dexamethasone-induce 1 51655 -31.4 0.0095
AAGATTGGTG CD9 CD9 antigen (p24) 928 -29.6 0.0003
ACCAAATTAA TNFRSF10B Tumor necrosis factor receptor superfamily 8795 -29.4 0.0003 CTGGGCCTGA LITAF Lipopolysaccharide-induced tumor necrosis factor 9516 -28.9 0.0076 CTGCCATAAC SBDS Shwachman–Bodian–Diamond syndrome 51119 -24.2 0.0005 CACAGGCAAA BZW1 Basic leucine zipper and W2 domains 1 9689 -22.1 0.0056 GTTCCCTGGC FAU Finkel–Biskis–Reilly murine sarcoma virus 2197 -22.1 0.0028 GTCTGCACCT DKFZp547C1 Hypothetical protein 254851 -21.9 0.0087 TACGTTGCAG GC20 Translocation factor sui1 homolog 10289 -21.8 0.0079
TGTAAAGATT CCNL1 Cyclin L1 57018 -21.2 0.0008
TGTTAAGTTC CRY1 Cryptochrome 1 (photolyase-like) 1407 -18.7 0.0091 GAAATAAAGT FLJ21657 Hypothetical protein 64417 -18.5 0.0032 ATGGGCTTGA SQRDL Sulfide quinone reductase-like (yeast) 58472 -17.3 0.0061 TCAAGAAATT PSME3 Proteasome activator subunit 3 10197 -15.7 0.0028
R505 breast carcinoma samples [18]. The reason for this
discrepancy is unclear at this point. The role of Clusterin in cell survival, cell death and neoplastic transformation remains controversial [15].
Another commonly observed downregulated gene in DCIS libraries was NSEP-1 (-36.2-fold; P = 0.0001). Also known as YB1, NSEP-1 is a member of the highly conserved Y-box family of proteins, which regulate the transcription of several genes associated with cell death including both fas, a cell death-associated receptor, and the tumor suppressor gene p53 [19]. The decrease in expression of NSEP-1 transcripts could play an important role in the early stages of breast carcinogenesis in order to overcome cell prolifer-ation controls.
Interestingly, and as previously observed, we also detected significant downregulation of various cytokines and chem-okines: interleukin enhancer binding factor 2 (ILF2), inter-leukin 13 receptor alpha 1 (IL13RA1), leukemia inhibitory factor (LIF), cardiotrophin-like cytokine (CLC), chemokine C–C ligand 2 (CCL2), and chemokine C–X–C ligand 1 (CXCL1). All these cytokines and chemokines are highly expressed in normal mammary epithelium and are dramati-cally downregulated in the DCIS samples. These differen-tially expressed genes were detected within a range of 0.02 <P < 0.05 by means of the modified t test analysis. These small secretory molecules, although usually linked to inflammatory processes, could also play important auto-crine and/or paraauto-crine roles in the physiology of normal mammary epithelial cells in particular because receptors for
these cytokines are also normally found expressed in nor-mal breast epithelial cells [20]. Some of these molecules (e.g. CXCL1, LIF) appear to play important roles in the nor-mal periodic cycles of growth and involution of the mam-mary gland following pregnancy and lactation. They may thus be part of the physiologic mechanisms associated with the massive apoptosis observed during involution [21,22]. Unfortunately we understand very little of the rele-vance of their intriguing de facto silencing in expression, both in in situ as well as in invasive breast cancer lesions.
Interestingly, we also detected a series of transcripts com-monly overexpressed in the DCIS samples: polycyctic kid-ney disease 1-like (PKD1-like), START domain containing 10 (STARD10), EPS8-like2 (EPS8L2), and KIAA0545 protein (Fig. 1d). One of these genes, EPS8-like2, encodes a protein that is related to epidermal growth factor receptor pathway substrate 8 (EPS8), and was shown to be essential in Ras/PI3K to Rac signaling [23]. PKD1-like encodes a member of the polycystin protein family. Mem-bers of this protein family may function in cell development and morphology, and may modulate intracellular calcium homoeostasis and other signal transduction pathways [24,25]. Although the PKD1 gene has been associated with cancer mechanisms, this homologous family member has not been implicated in carcinogenesis processes to the best of our knowledge. KIAA0545, also known as signal-induced proliferation-associated 1 like 3 (SIPA1L3), is a member of the Sipa1 family and encodes a protein bearing a domain highly homologous to the catalytic region of human Rap1 GTPase-activating protein (Rap1GAP).
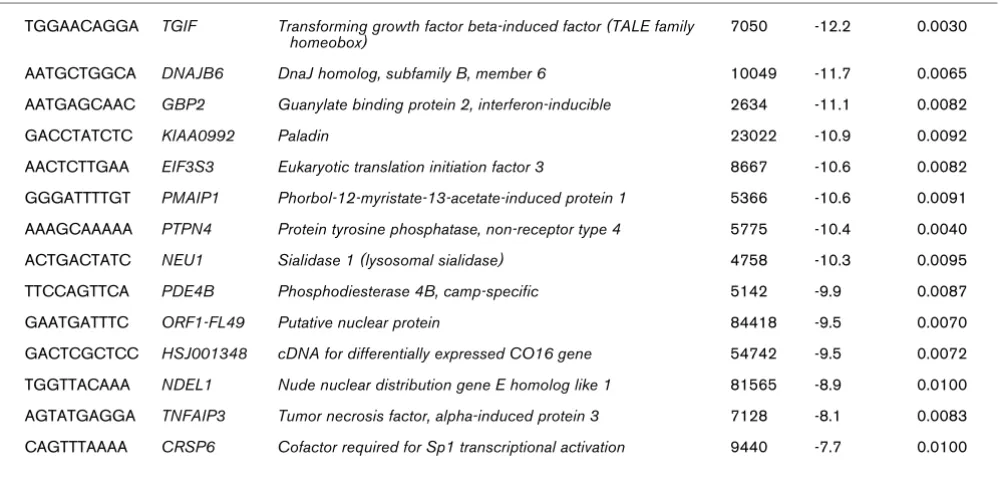
TGGAACAGGA TGIF Transforming growth factor beta-induced factor (TALE family homeobox)
7050 -12.2 0.0030
AATGCTGGCA DNAJB6 DnaJ homolog, subfamily B, member 6 10049 -11.7 0.0065 AATGAGCAAC GBP2 Guanylate binding protein 2, interferon-inducible 2634 -11.1 0.0082
GACCTATCTC KIAA0992 Paladin 23022 -10.9 0.0092
[image:7.612.58.558.113.355.2]AACTCTTGAA EIF3S3 Eukaryotic translation initiation factor 3 8667 -10.6 0.0082 GGGATTTTGT PMAIP1 Phorbol-12-myristate-13-acetate-induced protein 1 5366 -10.6 0.0091 AAAGCAAAAA PTPN4 Protein tyrosine phosphatase, non-receptor type 4 5775 -10.4 0.0040 ACTGACTATC NEU1 Sialidase 1 (lysosomal sialidase) 4758 -10.3 0.0095 TTCCAGTTCA PDE4B Phosphodiesterase 4B, camp-specific 5142 -9.9 0.0087 GAATGATTTC ORF1-FL49 Putative nuclear protein 84418 -9.5 0.0070 GACTCGCTCC HSJ001348 cDNA for differentially expressed CO16 gene 54742 -9.5 0.0072 TGGTTACAAA NDEL1 Nude nuclear distribution gene E homolog like 1 81565 -8.9 0.0100 AGTATGAGGA TNFAIP3 Tumor necrosis factor, alpha-induced protein 3 7128 -8.1 0.0083 CAGTTTAAAA CRSP6 Cofactor required for Sp1 transcriptional activation 9440 -7.7 0.0100
Table 2 (Continued)
R506
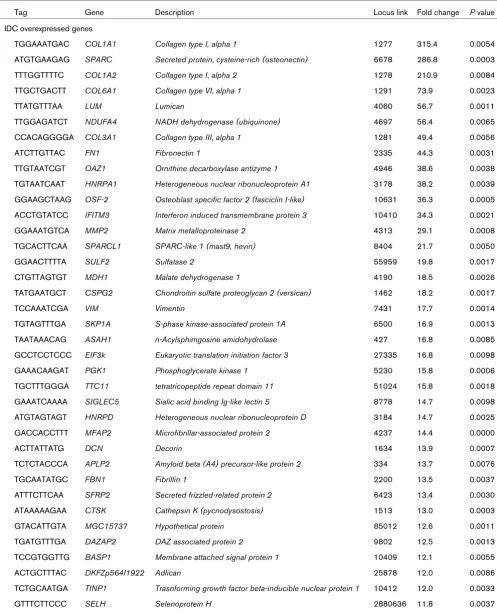
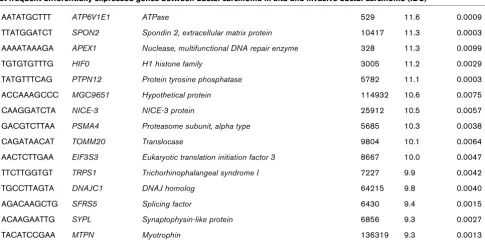
Table 3
Most frequent differentially expressed genes between ductal carcinoma in situ and invasive ductal carcinoma (IDC)
Tag Gene Description Locus link Fold change P value
IDC overexpressed genes
TGGAAATGAC COL1A1 Collagen type I, alpha 1 1277 315.4 0.0054 ATGTGAAGAG SPARC Secreted protein, cysteine-rich (osteonectin) 6678 286.8 0.0003 TTTGGTTTTC COL1A2 Collagen type I, alpha 2 1278 210.9 0.0084 TTGCTGACTT COL6A1 Collagen type VI, alpha 1 1291 73.9 0.0023
TTATGTTTAA LUM Lumican 4060 56.7 0.0011
TTGGAGATCT NDUFA4 NADH dehydrogenase (ubiquinone) 4697 56.4 0.0065 CCACAGGGGA COL3A1 Collagen type III, alpha 1 1281 49.4 0.0056
ATCTTGTTAC FN1 Fibronectin 1 2335 44.3 0.0031
TTGTAATCGT OAZ1 Ornithine decarboxylase antizyme 1 4946 38.6 0.0038 TGTAATCAAT HNRPA1 Heterogeneous nuclear ribonucleoprotein A1 3178 38.2 0.0039 GGAAGCTAAG OSF-2 Osteoblast specific factor 2 (fasciclin I-like) 10631 36.3 0.0005 ACCTGTATCC IFITM3 Interferon induced transmembrane protein 3 10410 34.3 0.0021
GGAAATGTCA MMP2 Matrix metalloproteinase 2 4313 29.1 0.0008
TGCACTTCAA SPARCL1 SPARC-like 1 (mast9, hevin) 8404 21.7 0.0050
GGAACTTTTA SULF2 Sulfatase 2 55959 19.8 0.0017
CTGTTAGTGT MDH1 Malate dehydrogenase 1 4190 18.5 0.0026
TATGAATGCT CSPG2 Chondroitin sulfate proteoglycan 2 (versican) 1462 18.2 0.0017
TCCAAATCGA VIM Vimentin 7431 17.7 0.0014
TGTAGTTTGA SKP1A S-phase kinase-associated protein 1A 6500 16.9 0.0013 TAATAAACAG ASAH1 n-Acylsphimgosine amidohydrolase 427 16.8 0.0085 GCCTCCTCCC EIF3k Eukaryotic translation initiation factor 3 27335 16.8 0.0098
GAAACAAGAT PGK1 Phosphoglycerate kinase 1 5230 15.8 0.0006
TGCTTTGGGA TTC11 tetratricopeptide repeat domain 11 51024 15.8 0.0018 GAAATCAAAA SIGLEC5 Sialic acid binding Ig-like lectin 5 8778 14.7 0.0098 ATGTAGTAGT HNRPD Heterogeneous nuclear ribonucleoprotein D 3184 14.7 0.0025 GACCACCTTT MFAP2 Microfibrillar-associated protein 2 4237 14.4 0.0000
ACTTATTATG DCN Decorin 1634 13.9 0.0007
TCTCTACCCA APLP2 Amyloid beta (A4) precursor-like protein 2 334 13.7 0.0076
TGCAATATGC FBN1 Fibrillin 1 2200 13.5 0.0037
ATTTCTTCAA SFRP2 Secreted frizzled-related protein 2 6423 13.4 0.0030 ATAAAAAGAA CTSK Cathepsin K (pycnodysostosis) 1513 13.0 0.0003
GTACATTGTA MGC15737 Hypothetical protein 85012 12.6 0.0011
TGATGTTTGA DAZAP2 DAZ associated protein 2 9802 12.5 0.0013
TCCGTGGTTG BASP1 Membrane attached signal protein 1 10409 12.1 0.0055
ACTGCTTTAC DKFZp564I1922 Adlican 25878 12.0 0.0086
TCTGCAATGA TINP1 Trasnforming growth factor beta-inducible nuclear protein 1 10412 12.0 0.0033
R507 Sipal1 is involved in the regulation of the Ras-mediated
sig-nal transduction pathway for cell proliferation and cell cycle progression [26]. These genes could be involved in signaling pathways that lead to cell proliferation, but their potential role in malignant transformation remains unknown.
Differentially expressed genes associated with NF-κB and tumor necrosis factor pathways
One of the transcripts observed to be most differentially expressed when comparing normal tissue with DCIS was NFKBIA (better known as IκBα), demonstrating a 150-fold higher expression (P < 0.0001) in normal mammary epithe-lial cells (Table 2 and Fig. 1b). NFKBIA is a member of IκB family genes that play a critical role in regulating the activity of the NF-κB transcription factor [27,28]. NF-κB plays a major role in diverse biological processes such as cell pro-liferation, differentiation, apoptosis and metastasis [29,30]. NF-κB is also required to prevent cell death induced by tumor necrosis factor (TNF) [31].
Interestingly, and perhaps pointing to connected pathways and related outcomes, we also detected a strong decrease in the expression levels of TNFRSF10 (29-fold; P < 0.0003), LITAF/PIG7 (29-fold; P < 0.0003) and TNFAIP3 (eightfold; P < 0.0083) transcripts in the DCIS group. The protein encoded by TNFRSF10, also known as TRAIL/ APO2, is a member of the TNF-receptor superfamily and contains an intracellular death domain. This receptor can be activated by TNF-related apoptosis inducing ligand and its role is to transduce apoptosis signals [32,33]. LITAF/ PIG7, a transcription factor, termed
lipopolysaccharide-induced TNF-alpha factor, also found downregulated, was reported to regulate TNF-alpha gene expression playing a major role in TNF-alpha activation [34]. This gene, also known as P53-induced gene 7 (PIG7), has been shown to be induced by p53 when apoptosis is triggered, and there-fore could also play a role in programmed cell death [35]. The concerted decline of these transcripts early in breast tumor progression appears conducive to a virtual silencing of apoptosis induction pathways and a consequential net increase in cell proliferation. In other words, the homeosta-sis of proliferation cell death normally operating in the breast epithelium is altered and inclined towards a net gain in cell numbers via multiple signaling pathways.
Global comparison of in situ and invasive carcinomas We found 149 transcripts differentially expressed between DCIS and IDC at P < 0.01. All of these genes were found overexpressed commonly at the invasive stage (Fig. 2). Table 2 summarizes the 52 most commonly overexpressed genes in invasive carcinoma lesions. We defined and clas-sified the 149 genes differentially expressed in 10 func-tional categories [13] as shown in Fig. 3b. Interestingly, we found that 37% of these upregulated transcripts are related to the cell cycle (12%), extracellular matrix or secreted pro-teins (13%), cell adhesion and motility (6%), and signal transduction (6%).
We were also able to detect 31 underexpressed genes in invasive carcinomas when compared with DCIS, but only when the stringency of the statistical comparison was dropped to within the 95% confidence interval (i.e. P <
AATATGCTTT ATP6V1E1 ATPase 529 11.6 0.0009
TTATGGATCT SPON2 Spondin 2, extracellular matrix protein 10417 11.3 0.0003 AAAATAAAGA APEX1 Nuclease, multifunctional DNA repair enzyme 328 11.3 0.0099
TGTGTGTTTG HIF0 H1 histone family 3005 11.2 0.0029
TATGTTTCAG PTPN12 Protein tyrosine phosphatase 5782 11.1 0.0003
ACCAAAGCCC MGC9651 Hypothetical protein 114932 10.6 0.0075
CAAGGATCTA NICE-3 NICE-3 protein 25912 10.5 0.0057
GACGTCTTAA PSMA4 Proteasome subunit, alpha type 5685 10.3 0.0038
CAGATAACAT TOMM20 Translocase 9804 10.1 0.0064
AACTCTTGAA EIF3S3 Eukaryotic translation initiation factor 3 8667 10.0 0.0047 TTCTTGGTGT TRPS1 Trichorhinophalangeal syndrome I 7227 9.9 0.0042
TGCCTTAGTA DNAJC1 DNAJ homolog 64215 9.8 0.0040
AGACAAGCTG SFRS5 Splicing factor 6430 9.4 0.0015
ACAAGAATTG SYPL Synaptophysin-like protein 6856 9.3 0.0027
[image:9.612.69.554.109.361.2]TACATCCGAA MTPN Myotrophin 136319 9.3 0.0013
Table 3 (Continued)
R508
0.05), reflecting a lower level of consistency in these gene expression changes when comparing DCIS with IDC (Fig. 4). Examples of these genes include: transmembrane 4 superfamily member 1 (TM4SF1) (-26.7-fold; P = 0.04), tumor necrosis factor receptor-associated factor 4 (TRAF4) (-10.7-fold; P = 0.04), PPAR binding protein (PPARBP) (-8.2-fold; P = 0.04), aldo-keto reductase fam-ily 1 (AKR1A1) (-6.7-fold; P = 0.03), hypothetical protein dJ465N24.2.1 (-6.4-fold; P = 0.028), microtubule-associ-ated protein 1 (MAP1LC3A) (-3.7-fold; P = 0.02) and retinoblastoma binding protein 6 (RBBP6) (-2.6-fold; P = 0.04).
The first of these transcripts, TM4SF1, was also the most dramatically downregulated gene in DCIS when compared with normal breast libraries (-442.6-fold; P = 0.0083). The transmembrane proteins TM4SF1, also known as the tet-raspanin superfamily, are implicated in diverse signal
trans-duction events that play a role in the regulation of cell development, cell proliferation, differentiation and motility [36]. The tetraspanins are associated with adhesion receptors of the integrin family and regulate integrin-dependent cell migration [36]. In the present study, the loss in gene expression of TM4SF1, from normal breast tissue to invasive carcinomas, appears to be a common event in the progression of breast carcinomas. In addition, down-regulated levels of the TRAF4 transcript could cooperate in the evolution from DCIS to invasive carcinomas. TRAF4 is a proapoptotic gene member of the TRAF family of adaptor proteins that mediate cellular signaling by binding to vari-ous members of the tumor necrosis family receptor super-family and interleukin-1/Toll-like receptor supersuper-family [37]. Interestingly, a recent study showed that overexpression of TRAF4 can induce apoptosis, playing a role in p53-medi-ated proapoptotic signaling in response to cellular stress [38].
Differentially expressed genes related with extracellular matrix remodeling and invasion processes
During their metastatic conversion, epithelial carcinoma cells acquire the ability to invade the surrounding tissues and later disseminate to secondary organs mostly via lymphatic vessels. The metastatic process is not just a function of acquisition of novel migratory and invasive prop-erties by the epithelial tumor cells; the surrounding stroma also plays a critical role in this process [2]. Dramatic changes take place in order to remodel the extracellular matrix environment in response to the infiltrating cancer cells (desmoplastic reaction) [39-41]. In this sense, we identified high expression levels of several transcripts that could be a reflection of the host stromal response, such as collagen 1α1, collagen 1α2, collagen 3α1, collagen 6α1, fibronectin I, fibrilli, microfibrillar-associated protein 2, and Spondin 2.
[image:10.612.57.295.89.438.2]It is known that the proteolytic degradation of the extracel-lular matrix is more than the simple removal of a physical barrier to invasion; such processes and the increased expression of the involved genes are known to also signifi-cantly influence mechanisms controlling cell proliferation [42]. Matrix metalloproteinases are zinc-dependent endopeptidases involved in matrix degradation and tissue remodeling [43]. These endopeptidases are capable of degrading both the extracellular matrix and basement mem-brane, physical barriers that play important roles in prevent-ing against expandprevent-ing growth and migration of cancer cells [44]. It is therefore widely accepted that overexpression of matrix metalloproteinases is associated with cancer-cell invasion and metastasis. A member of the matrix metallo-proteinase family (MMP-2) was highly expressed (29.1-fold; P = 0.0008) in IDC libraries in comparison with in situ carcinomas. MMP-2 has been shown overexpressed in var-ious human tumors, including breast cancer [45,46]. Figure 3
Classification in functional categories of affected transcripts
R509 Figure 4
Hierarchical clustering of downregulated genes in invasive ductal carcinoma (IDC) (P < 0.05)
R510
To no surprise and as observed in other studies, we also detected significant increases in SPARC (286-fold; P = 0.0003) and a new related gene SPARC-like1 (21.7-fold; P = 0.005) among the groups of genes upregulated in invasive lesions. The SPARC gene encodes for a secreted protein acid rich in cysteines also known as osteonectin [47]. This protein is involved in a variety of diverse biologi-cal processes including tissue remodeling, cell adhesion, proliferation, differentiation, matrix synthesis/turnover, ang-iogenesis and tumor cell migration and invasion [47]. Over-expression of the SPARC gene has been reported associated with melanoma and metastatic carcinomas of the breast, and increased SPARC expression has been observed in conjunction with increased c-Jun and Fra-1 expression in a panel of invasive breast cancer cell lines [48].
Human SPARC-like1, also known as mast9 or hevin, is a member of the SPARC protein family. Interestingly, previ-ous reports indicated downregulation of SPARC-like1 in prostate and colon carcinomas [49,50]. Contrary to these observations, we observed consistent high expression of this transcript across all IDC libraries. Functional assays suggest that SPARC-like1 may serve as an antagonist to cell adhesion, playing a key role in the inhibition of attach-ment, and may facilitate spreading of endothelial cells on fibronectin substrates [51].
Taken together, these expression profiles suggest that MMP-2, SPARC and SPARC-like1 are probably critical mediators of extracellular matrix remodeling and are all
important in facilitating breast cancer invasion and progression.
Other genes commonly expressed at high levels in invasive carcinomas and of much lower expression in DCIS and nor-mal breast tissues include lumican (LUM/LDC) (56.7-fold; P = 0.0011), versican (CSPG2) (18.2-fold; P = 0.0017), vimentin (VIM) (17.7-fold; P = 0.0014), decorin (DCN/ PG2) (13.9-fold; P = 0.0007) and adlican (DKFZp564I1922) (12-fold; P = 0.0086). Lumican and decorin are members of the small leucine-rich proteoglycan family of proteins [40]. Several studies have demonstrated that small leucine-rich proteoglycan proteins can modulate cellular behavior, including cell migration and proliferation during tumor growth. Furthermore, the high expression level of lumican was associated with high tumor grade and was expressed specifically in breast cancer tissues, but not in normal breast tissues, suggesting that lumican is differ-entially expressed during breast tumor progression [40,52]. These findings suggest that lumican may play an important role in breast cancer growth.
[image:12.612.59.555.96.317.2]Recent studies have suggested that expression of increased amounts of versican, a chondroitin sulphate pro-teoglycan, in neoplastic tissues may play a role in promot-ing tumor cell proliferation and migration [53]. Abnormal versican deposition has been observed in a number of tumor types, including breast cancer [54]. Furthermore, it has been suggested that the versican-rich extracellular matrices exert an anti-adhesive effect on cells, thus facilitat-ing tumor-cell migration and invasion [55].
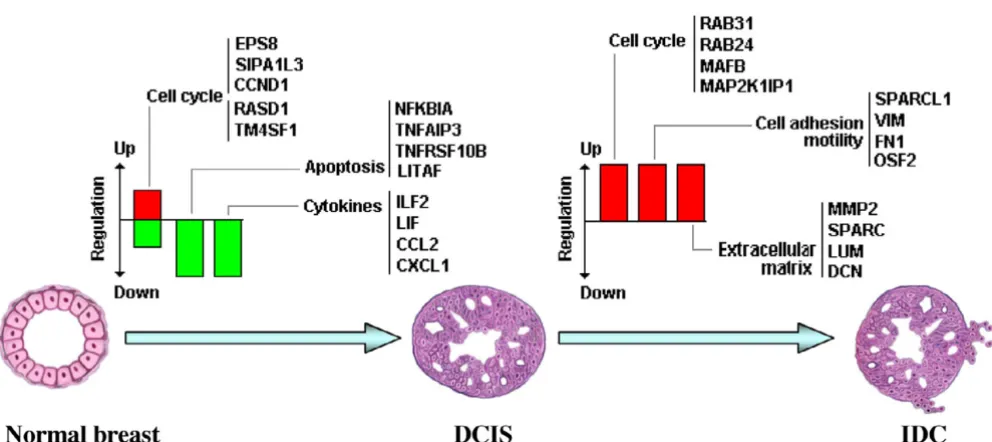
Figure 5
Schematic model portraying some of the most significant transcriptomic changes observed in breast cancer progression
R511 Vimentin is a type III intermediate filament normally
expressed in cells of mesenchymal origin [56]. However, numerous studies have now demonstrated that vimentin can also be expressed in epithelial cells involved in physio-logical or pathophysio-logical processes requiring epithelial cell migration [57]. Vimentin has indeed been described in migratory epithelial cells involved in embryological and org-anogenesis processes and tumor invasion [58]. Also, vimentin antisense transfection in vimentin-expressing breast cell lines was shown to reduce their in vitro invasive-ness or migration, strongly emphasizing a functional contri-bution of vimentin to epithelial cell invasion/migration [59].
Conclusions
Using comprehensive gene expression profiling by means of SAGE combined with a recently developed statistical approach, we identified the most consistent and statisti-cally significant changes occurring in breast cancer pro-gression detected by this methodology. A comparison of the genes identified in our DCIS and IDC analysis with pre-vious observations [11,12,14,41] revealed expected simi-larities. More importantly, several genes were identified in our analysis that were not previously reported or detected in other SAGE studies. This suggests that the comparative analysis we performed of normal breast tissue, DCIS and invasive carcinomas by means of the modified t test appears statistically rigorous and applicable to SAGE stud-ies in which multiple librarstud-ies are compared.
In the present study we observed that deregulation of genes involved in the control of cell proliferation, apoptosis and mammary gland development are frequently altered at the in situ stage (Fig. 5). Meanwhile, alterations in the expression of genes related to the cell cycle and extracellu-lar matrix remodeling (proteinases, collagenases, cysteine proteinases), and several transcripts related to cell adhe-sion and motility, were abundantly deregulated at the inva-sive carcinoma stage (Fig. 5). Additional analysis and validation of the identified genes will be required to deter-mine the clinical value, and to deterdeter-mine whether they may constitute novel targets for translational research.
Competing interests
None declared.Additional files
Acknowledgement
The authors gratefully acknowledge support from NIH-NCI Grant 1U19 CA84978.
References
1. Greenlee RT, Murray T, Bolden S, Wingo PA: Cancer statistics.
CA Cancer J Clin 2000, 50:7-33.
2. Berardo MD, Allred DC, O'Connell P: Breast cancer. In Principles of Molecular Medicine Edited by: Jameson JL. Totowa, NJ: Human Press; 1998:625-632.
3. Ponten J, Holmberg L, Trichopoulos D, Kallioniemi O, Kvale G, Wallgren A: Biology and natural history of breast cancer.Int J Cancer 1990, 5:5-21.
4. Charpentier A, Aldaz CM: The molecular basis of breast car-cinogenesis. In The Molecular Basis of Human Cancer Edited by: Coleman WB, Tsongalis GJ. Totowa, NJ: Human Press; 2002:347-363.
5. Troup S, Njue C, Kliewer EV, Parisien M, Roskelley C, Chakravarti S, Roughley PJ, Murphy LC, Watson PH: Reduced expression of the small leucine-rich proteoglycans, Lumican, and Decorin is associated with poor outcome in node-negative breast cancer.
Clin Cancer Res 2003, 9:207-214.
6. Velculescu VE, Zhang L, Vogelstein B, Kinzler KW: Serial analysis of gene expression.Science 1995, 270:484-487.
7. Zhang L, Zhou W, Velculescu VE, Kern SE, Hruban RH, Hamilton SR, Vogelstein B, Kinzler KW: Gene expression profiles in nor-mal and cancer cells.Science 1997, 276:1268-1272.
8. Baggerly KA, Deng Li, Morris JS, Aldaz CM: Differential expres-sion in Sage: accounting for normal between-library variation.
Bioinformatics 2003, 19:1477-1483.
9. Kal AJ, van Zonneveld AJ, Benes V, vand den Berg M, Koerkamp MG, Albermann K, Strack N, Ruijter JM, Richter A, Dujon B, Ansorge W, Tabak HF: Dynamics of gene expression revealed by comparison of serial analysis of gene expression transcript profiles form yeast grown on two different carbon sources.Mol Biol Cell 1999, 10:1859-1872.
10. Man MZ, Wang X, Wang Y: Power_Sage: comparing statistical test for SAGE experiments.Bioinformatics 2000, 16:953-959. 11. Nacht M, Ferguson AT, Zhang W, Petroziello JM, Cook BP, Gao
YH, Maguire S, Riley D, Coppola G, Landes GM, Madden SL, Sukumar S: Combining serial analysis of gene expression and array technologies to identify genes differentially expressed in breast cancer.Cancer Res 1999, 59:5464-5470.
The following Additional files are available online:
Additional File 1
Complete list of differentially expressed genes between normal breast epithelium and ductal carcinoma in situ (p < 0.05). See http://breast-cancer-research.com/ content/supplementary/bcr899-s1.xls
See http://www.biomedcentral.com/content/ supplementary/bcr899-S1.xls
Additional File 2
Complete list of differentially expressed genes between ductal carcinoma in situ and invasive ductal carcinoma (p < 0.05). See http://breast-cancer-research.com/ content/supplementary/bcr899-s2.xls
R512
12. Porter DA, Krop IE, Nasser S, Sgroi D, Kaelin CM, Marks JR, Rig-gins G, Polyak K: A SAGE (Serial Analysis of Gene Expression) view of breast tumor progression. Cancer Res 2001,
61:5697-5702.
13. Leerkes MR, Caballero OL, Mackay A, Torloni H, O'Hare MJ, Simp-son AJG, de Souza SJ: In silico comparison of the transcrip-tome derived from purified normal breast cells and breast tumor cell lines reveals candidate upregulated genes in breast tumor cells.Genomics 2002, 79:257-265.
14. Porter D, Lahti-Domenici J, Keshaviah A, Bae YK, Argani P, Marks J, Richarson A, Cooper A, Strausberg R, Riggins GJ, Schnitt S, Gabrielson E, Gelman R, Polyak K: Molecular markers in ductal carcinoma in situ of the breast. Mol Cancer Res 2003,
1:362-375.
15. Trougakos IP, Gonos ES: Clusterin/apolipoprotein J in human aging and cancer.Int J Biochem Cell Biol 2002, 34:1430-1448. 16. Zhang LY, Ying WT, Mao YS, He HZ, Liu Y, Wang HX, Liu F, Wang K, Zhang DC, Wang Y, Wu M, Qian XH: Loss of clusterin both in serum and tissue correlates with the tumorigenesis of esophageal squamous cell carcinoma via proteomics approaches.World J Gastroenterol 2003, 9:650-654.
17. Scaltriti M, Brausi M, Amorosi A, Caporali A, D'Arca D, Astancolle S, Corti A, Bettuzzi S: Clusterin (SGP-2, ApoJ) expression is downregulated in low- and high-grade human prostate cancer.
Int J Cancer 2004, 108:23-30.
18. Redondo M, Villar E, Torres-Munoz J, Tellez T, Morell M, Petito CK:
Overexpression of Clusterin in human breast carcinoma.Am J Pathol 2000, 157:393-399.
19. Zhang YF, Homer C, Edwards SJ, Hananeia L, Lasham A, Royds J, Sheard P, Braithwaite AW: Nuclear localization of Y-box factor YB1 requires wild-type p53.Oncogene 2003, 22:2782-2794. 20. Dhingra K, Sahin A, Emami K, Hortobagyi GN, Estrov Z:
Expres-sion of leukemia inhibitory factor and its receptor in breast cancer: a potential autocrine and paracrine growth regulatory mechanism.Breast Cancer Res Treat 1998, 48:165-174. 21. Liu J, Hadjokas N, Mosley B, Estrov Z, Spence MJ, Vestal RE:
Oncostatin M-specific receptor expression and function in reg-ulating cell proliferation of normal and malignant mammary epithelial cells.Cytokine 1998, 10:295-302.
22. Grant SL, Douglas AM, Goss GA, Begley CG: Oncostatin M and leukemia inhibitory factor regulate the growth of normal human breast epithelial cells. Growth Factors 2001,
19:153-162.
23. Tocchetti A, Confalonieri S, Scita G, Di Fiore PP, Betsholtz C: In silico analysis of EPS8 gene family: genomic organization, expression profile, and protein structure. Genomics 2003,
81:234-244.
24. Wilson PD, Geng L, Li X, Burrow CR: The PKD1 gene product, 'polycystin-1', is a tyrosine-phosphorylated protein that colo-calizes with a2b1-integrin in focal clusters in adherent renal epithelia.Lab Invest 1999, 79:1311-1323.
25. Boucher C, Sandford R: Autosomal dominant polycystic dis-ease (ADPKD, MIM 17 PKD1 and PKD2 genes, protein prod-ucts known as polycystin-1 and polycystin-2).Eur J Hum Genet 3900, 186:2309-2318.
26. Wada Y, Kubota H, Maeda M, Taniwaki M, Hattori M, Imamura S, Iwai K, Minato N: Mitogen-inducible SIPA1 is mapped to the conserved syntenic group of chromosome 19 in mouse and chromosome 11q13.3 centromeric to BCL1 in human.
Genomic 1997, 39:66-73.
27. May MJ, Ghosh MS: Rel/NF-kB and IkB proteins: an overview.
Cancer Biol 1997, 8:63-73.
28. Curran JE, Weinstein SR, Griffiths LR: Polymorphic variants of NFKB1 and its inhibitory protein NFKBIA, and their involve-ment in sporadic breast cancer. Cancer Lett 2002,
188:103-107.
29. Barkett M, Gilmore TD: Control of apoptosis by Rel/NF-kappaB transcription factors.Oncogene 1999, 18:6910-6924. 30. Silverman N, Maniatis T: NF-kappaB signaling pathways in
mammalian and insect innate immunity. Genes Dev 2001,
15:2321-2342.
31. Nakshatri H, Bhat-Nakshatri P, Martin DA, Goulet RJ Jr, Sledge GW Jr: Constitutive activation of NF-kB during progression of breast cancer to hormone-independent growth.Mol Cell Biol 1997, 17:3629-3639.
32. Kim EJ, Suliman A, Lam A, Srivastava RK: Failure of BCL-2 to block mitochondrial dysfunction during TRAIL-induced
apop-tosis. Tumor necrosis-related apoptosis-inducing ligand.Int J Oncol 2001, 18:187-194.
33. Singh TR, Shankar S, Chen X, Asim M, Srivastava RK: Synergistic interactions of chemotherapeutic drug and tumor necrosis factor related apoptosis-inducing ligand/Apo-2 ligand on apoptosis and on regression of breast carcinomas in vivo.
Cancer Res 2003, 63:5390-5400.
34. Myokai F, Takashiba S, Lebo R, Amar S: A novel lipopolysaccha-ride-induce transcription factor regulating tumor necrosis fac-tor alpha gene expression: molecular cloning, sequencing, characterization, and chromosomal assignment. Proc Natl Acad Sci USA 1999, 96:4518-4523.
35. Polyak K, Xia Y, Zweier JL, Kinzler KW, Vogelstein B: A model for p53-induced apoptosis.Nature 1997, 389:300-305.
36. Berditchevski F: Complex of tetraspanins with integrins: more than meets the eye.J Cell Science 2001, 114:4143-4151. 37. Chung JY, Park YC, Ye H, Wu H: All TRAFs are not created
equal: common and distinct molecular mechanisms of TRAF-mediated signal transduction.J Cell Sci 2002, 115:679-688. 38. Sax JK, El-Deiry WS: Identification and characterization of the
cytoplasmic protein TRAF4 as a p53-regulated proapoptotic gene.J Biol Chem 2003, 278:36435-36444.
39. Peyrol S, Raccurt M, Gerard F, Gleyzal C, Grimaud JA, Sommer P:
Lysyl oxidase gene expression in the stromal reaction to in situ and invasive ductal breast carcinoma.Am J Pathol 1997,
150:497-507.
40. Leygue E, Snell L, Dotzlaw H, Troup S, Hiller-Hitchcok T, Murphy LC, Roughley PJ, Watson PH: Lumican and decorin are differen-tially expressed in human breast carcinomas.J Pathol 2000,
192:313-320.
41. Iacobuzio-Donahue CA, Argani P, Hempen PM, Jones J, Kern SE:
The desmoplastic response to infiltrating breast carcinoma: gene expression at the site of primary invasion and implica-tions for comparisons between tumor types.Cancer Res 2002,
62:5351-5357.
42. Henriet P, Blavier L, Declerck YA: Tissue inhibitors of metallo-proteinases (TIMP) in invasion and proliferation.Acta Pathol Microbiol Immuno Scandinavica 1999, 107:111-119.
43. Egeblad M, Werb Z: New functions for the matrix metallopro-teinases in cancer progression. Nat Rev Cancer 2002,
2:161-174.
44. Stamenkovic I: Matrix metalloproteinases in tumor invasion and metastasis.Semin Cancer Biol 2000, 10:415-433.
45. Jones JL, Glynn P, Walker RA: Expression of 2 and MMP-9, their inhibitors, and the activator MT1-MMP in primary breast carcinomas.J Pathol 1999, 189:161-168.
46. Garbett EA, Reed MW, Brown NJ: Proteolysis in human breast and colorectal cancer.Br J Cancer 1999, 81:287-293. 47. Francki A, Bradshaw AD, Bassuk JA, Howe CC, Couser WG,
Sage EH: SPARC regulates the expression of collagen type I and transforming growth factor-beta 1 in mesangial cells.J Biol Chem 1999, 274:32145-32152.
48. Zajchowski DA, Bartholdi MF, Gong Y, Webster L, Liu HL, Mun-ishkin A, Beauheim C, Harvey S, Ethier SP, Johnson PH: Identifi-cation of gene expression profiles that predict the aggressive behavior of breast cancer cells. Cancer Res 2001,
61:5168-5178.
49. Nelson PS, Plymate SR, Wang K, True LD, Ware JL, Gan L, Liu AY, Hood L: Hevin, an antiadhesive extracellular matrix protein, is down-regulated in metastatic prostate adenocarcinoma. Can-cer Res 1998, 58:232-236.
50. Isler SG, Schenk S, Bendik I, Schraml P, Novotna H, Moch H, Sau-ter G, Ludwig CU: Genomic organization and chromosomal mapping of SPARC-like 1, a gene down regulated in cancers.
Int J Oncol 2001, 18:521-526.
51. Hambrock HO, Nitsche DP, Hansen U, Bruckner P, Paulsson M, Maurer P, Hartmann U: SC1/Hevin: an extracellular calcium-modulated protein that binds collagen I.J Biol Chem 2003,
278:11351-11358.
52. Leygue E, Snell L, Dotzlaw H, Hole K, Hiller-Hitchcock T, Roughley PJ, Watson PH, Murphy LC: Expression of lumican in human breast carcinoma.Cancer Res 1998, 58:1348-1352.
R513
54. Ricciardelli C, Brooks JH, Suwiwata S, Sakko AJ, Mayne K, Ray-mond WA, Seshadri R, LeBaron RG, Horsfall DJ: Regulation of stromal versican expression by breast cancer cells and impor-tance to relapse-free survival in patients with node-negative primary breast cancer.Clin Cancer Res 2002, 8:1054-1060. 55. Yamagata M, Suzuki S, Akiyama SK, Yamada KM, Kimata K:
Reg-ulation of cell-substrate adhesion by proteoglycans immobi-lized on extracellular substrate. J Biol Chem 1989,
264:8012-8018.
56. Steinert PM, Roop DR: Molecular and cellular biology of inter-mediate filaments.Annu Rev Biochem 1988, 57:593-625. 57. Gilles C, Polette M, Zahm JM, Tournier JM, Volders L, Foidart JM,
Birembaut P: Vimentin contributes to human mammary epithe-lial cell migration.J Cell Sci 1999, 112:4615-4625.
58. Gilles C, Polette M, Mestdagt M, Nawrocki-Raby B, Ruggeri P, Birembaut P, Foidart J: Transactivation of vimentin by B-catenin in human breast cancer cells.Cancer Res 2003, 63:2658-2664. 59. Hendrix MJ, Seftor EA, Seftor RE, Trevor KT: Experimental coex-pression of vimentin and keratin intermediate filaments in human breast cancer cells results in phenotypic interconver-sion and increased invasive behavior. Am J Pathol 1997,

![(3S,4S,5R) 4 Hydroxy 3 methyl 5 [(2S,3R) 3 methylpent 4 en 2 yl] 4,5 dihydrofuran 2(3H) one](data:image/gif;base64,R0lGODlhAQABAIAAAP///wAAACH5BAEAAAAALAAAAAABAAEAAAICRAEAOw==)