T E C H N I C A L N O T E
Open Access
Label-free peptide profiling of Orbitrap
™
full
mass spectra
Mark K Titulaer
1,2*, Dominique de Costa
3, Christoph Stingl
1, Lennard J Dekker
1, Peter AE Sillevis Smitt
1,
Theo M Luider
1*Abstract
Background:We developed a new version of the open source software package Peptrix that can yet compare large numbers of Orbitrap™LC-MS data. The peptide profiling results for Peptrix on MS1 spectra were compared with those obtained from a small selection of open source and commercial software packages: msInspect, Sieve™ and Progenesis™. The properties compared in these packages were speed, total number of detected masses, redundancy of masses, reproducibility in numbers and CV of intensity, overlap of masses, and differences in peptide peak intensities. Reproducibility measurements were taken for the different MS1 software applications by measuring in triplicate a complex peptide mixture of immunoglobulin on the Orbitrap™mass spectrometer. Values of peptide masses detected from the high intensity peaks of the MS1 spectra by peptide profiling were verified with values of the MS2 fragmented and sequenced masses that resulted in protein identifications with a significant score.
Findings:Peptrix finds about the same number of peptide features as the other packages, but peptide masses are in some cases approximately 5 to 10 times less redundant present in the peptide profile matrix. The Peptrix profile matrix displays the largest overlap when comparing the number of masses in a pair between two software applications. The overlap of peptide masses between software packages of low intensity peaks in the spectra is remarkably low with about 50% of the detected masses in the individual packages. Peptrix does not differ from the other packages in detecting 96% of the masses that relate to highly abundant sequenced proteins. MS1 peak intensities vary between the applications in a non linear way as they are not processed using the same method.
Conclusions:Peptrix is capable of peptide profiling using Orbitrap™files and finding differential expressed peptides in body fluid and tissue samples. The number of peptide masses detected in Orbitrap™files can be increased by using more MS1 peptide profiling applications, including Peptrix, since it appears from the
comparison of Peptrix with the other applications that all software packages have likely a high false negative rate of low intensity peptide peaks (missing peptides).
Background
High throughput Orbitrap™ (Thermo Fischer Scientific, Germany) mass spectrometry (MS) makes it possible to obtain full MS1-spectra and fragmentation-MS2 (MS/ MS) spectra of peptides for comparison and identifica-tion purposes. The technique can be applied to compare the differences in quantities of proteins in body fluid and tissue samples. The peptides from enzymatic
digested proteins are separated on an LC column. Dur-ing elution, dependDur-ing on sample complexity 1-100% of separated peptides detected in the spectra of the
MS1 scans can be MS2 triggered by the Xcalibur™
instrument software for MS2 fragmentation [1].
The Peptrix application can handle raw Orbitrap™ files as well as MALDI-TOF and MALDI-FT-ICR mass spectra [2-7]. Peptide profiling requires the following basic steps: 1) peak picking from the raw mass spectra; 2) time alignment of the extracted peak masses between different LC runs; 3) aggregation of masses and corre-sponding intensities of different sample runs on the Orbitrap™ in a peptide profile matrix; and 4) statistical * Correspondence: [email protected]; [email protected]
1Laboratory of Neuro-Oncology and Clinical and Cancer Proteomics,
Department of Neurology, Erasmus University Medical Center, Dr. Molewaterplein 50, P.O. Box 2040, 3000 CA Rotterdam, The Netherlands Full list of author information is available at the end of the article Titulaeret al.BMC Research Notes2011,4:21
http://www.biomedcentral.com/1756-0500/4/21
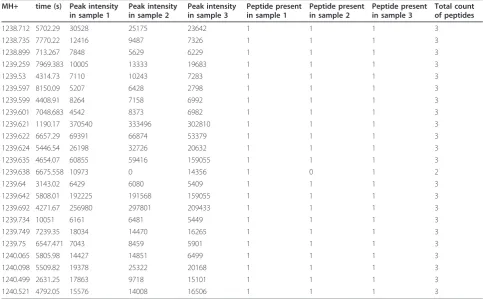
analysis to highlight masses differentially expressed between different groups. A peptide profile matrix, fre-quently called Peptide Array or PepArray, is created as an output file. Peptide peak intensities are presented in this matrix for all masses detected in every Orbitrap™ measurement. These MS1 masses can eventually be linked to protein identifiers using MS2 sequence infor-mation and available protein databases. Table 1 shows a fragment of such a peptide profile matrix. Replicate measurements from a tryptic digested IgG Fab sample are presented as numbers 1, 2 and 3 in the matrix col-umns, with the retention time and mass of a peptide in the matrix rows, e.g. peptide mass 1239.259 Da eluting at a retention time of 7969.383 s. The three replicate peak intensities measured for the mass 1239.259 Da are given in the matrix cells, e.g. the values 10005, 13333, 19683 in arbitrary units.
Peptrix is not completely new software, but an exten-sion of already published nameless software. The archi-tecture of Peptrix is described in [7]. The application consists of: 1) a Java™ graphical interface; 2) Mysql database for storage of meta-data; 3) ftp storage of raw data and processed files: and 4) an interface to R for sta-tistical analysis. The software has changed in many aspects with respect to the previously reported version. Firstly, the peptide profile matrix created from LC-MS
experiments contains an extra retention time dimension as peptides elute at different time points from the nano-LC column. Peak-picking algorithms over time are
implemented combining more Orbitrap™ scans. Time
alignment has to be implemented between different LC runs of the sample. Nano-spray ionization from LC-MS also generates multiple charged peptide ions and a dif-ferent de-isotoping algorithm was implemented than was required for single charged peptides in MALDI-TOF and MALDI-FTICR measurements. Instead of eliminating isotopes from the peak-lists, which is possi-ble in MALDI experiments, mono-isotopes have to be selected from the raw Orbitrap™spectra by peak-pick-ing algorithms based on expected isotopic intensity distributions.
Other software packages exist for comparing the raw Xcalibur™ MS1 data between samples, possibly con-verted into mzXML formatted files, e.g. msInspect, MZMine, OpenMS, VIPER, PEPPer, MSight [8-10]. These tools generate peptide profile matrices, in which spectral intensities and retention times of peptide masses from samples belonging to different groups are presented in various ways.
[image:2.595.55.539.431.730.2]Some of these software packages, such as SuperHirn and SpecArray, did at the time of analysis not run on the Windows Operating System (OS) but only on Linux
Table 1 A fragment of a peptide profile matrix or PepArray
MH+ time (s) Peak intensity in sample 1
Peak intensity in sample 2
Peak intensity in sample 3
Peptide present in sample 1
Peptide present in sample 2
Peptide present in sample 3
Total count of peptides
1238.712 5702.29 30528 25175 23642 1 1 1 3
1238.735 7770.22 12416 9487 7326 1 1 1 3
1238.899 713.267 7848 5629 6229 1 1 1 3
1239.259 7969.383 10005 13333 19683 1 1 1 3
1239.53 4314.73 7110 10243 7283 1 1 1 3
1239.597 8150.09 5207 6428 2798 1 1 1 3
1239.599 4408.91 8264 7158 6992 1 1 1 3
1239.601 7048.683 4542 8373 6982 1 1 1 3
1239.621 1190.17 370540 333496 302810 1 1 1 3
1239.622 6657.29 69391 66874 53379 1 1 1 3
1239.624 5446.54 26198 32726 20632 1 1 1 3
1239.635 4654.07 60855 59416 159055 1 1 1 3
1239.638 6675.558 10973 0 14356 1 0 1 2
1239.64 3143.02 6429 6080 5409 1 1 1 3
1239.642 5808.01 192225 191568 159055 1 1 1 3
1239.692 4271.67 256980 297801 209433 1 1 1 3
1239.734 10051 6161 6481 5449 1 1 1 3
1239.749 7239.35 18034 14470 16265 1 1 1 3
1239.75 6547.471 7043 8459 5901 1 1 1 3
1240.065 5805.98 14427 14851 6499 1 1 1 3
1240.098 5509.82 19378 25322 20168 1 1 1 3
1240.499 2631.25 17863 9718 15101 1 1 1 3
[9]. Other applications required customized data input formats or connection to pre-filled databases with equipment-dependent retention times for sequenced peptide masses. The Orbitrap™ files contains all the necessary MS1 and MS2 information (for time align-ment), and full analysis only requires an internet con-nection to a protein database interface, e.g. Mascot™, as implemented in Progenesis™. Some applications cannot handle the approximately 1.8 GB big mzXML files, pro-cessed by readw.exe version 4.2.1 from the raw files [11]. This can be due to the size of the files causing RAM related issues. Another reason might be that readw.exe generates not entirely correct structurized mzXML files. In some files mzXML closing tags are missing. Readw.exe could not process files larger than 2 GB on our hardware; Intel Xeon W3520 Quad-Core 2.67 GHz processor with 3.5 GB RAM.
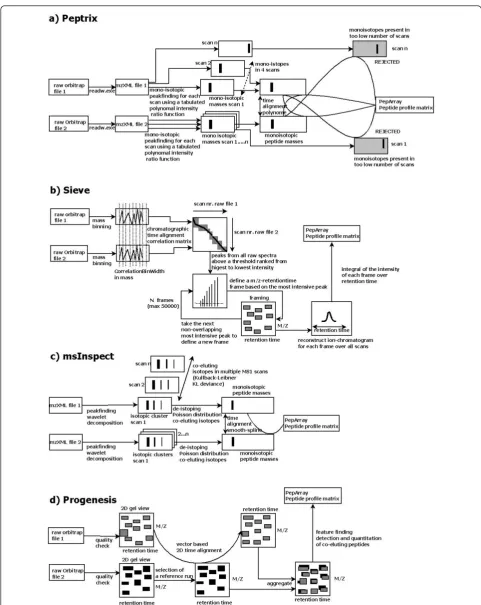
The result of peptide profiling by Peptrix on MS1 spectra were compared with that obtained from a small selection of open source and commercial Win-dows software packages, i.e. 1) commercial Sieve™[1]; 2) open source msInspect [12,13]; and 3) commercial Progenesis™[14]. The aspects compared were: 1) speed; 2) total number of detected masses in the profile matrix; 3) redundancy of masses; 4) reproducibility of number of masses and CV of intensity; 5) overlap of masses between the selected packages; and 6) differences of peptide peak intensities determined by the software packages. The (basic) workflow of activities for the soft-ware tools compared - Peptrix, Sieve™, msInspect, and Progenesis™- is shown in Figure 1.
To compare the four packages, we analyzed three technical replicates of tryptic digested immunoglobulin G (IgG) Fragment antigen binding (Fab) of human serum. We used Peptrix to compare the output of the triplicate measurements from the software packages. Unless important for interpretation of the results, we will not describe how they actually work in terms of algorithms, time alignment, peak selection by isotopic pattern recognition, using peak maxima, features or framing. For these matters, we refer you to the manu-facturer’s documentation, the comparison study in [9] or the (basic) workflow of activities for the tools com-pared - Peptrix, Sieve™, msInspect, and Progenesis™ depicted in Figure 1.
As a practical example of Peptide profiling by Peptrix, we present the analysis results of Orbitrap™ measure-ments of in total 40 micro-dissected tissue samples, 10 spectra of glioma blood vessels, 10 spectra of tissue surrounding the glioma vessels, 10 spectra of normal endothelial vessels, and 10 spectra of endothelial tissue surrounding the normal vessels, previously analyzed by FT-ICR MS [15].
Methods
The purification of IgG Fab in human serum sample and tryptic digestion of the isolated Fab for MS is described in additional material [Additional Files 1, 2, and 3]. The mass spectrometry measurements are described in Additional File 4.
MS1 Peptide profile matrices of the IgG Fab serum replicate samples were created from raw Orbitrap™files using Peptrix version 2.4.9, Sieve™ version 1.2, Progen-esis™ version 2.0 and msInspect (build 382, 2004-2009) after conversion into mzXML files. The software packages Peptrix and msInspect de-convolute charged masses in isotopic clusters to the mono-isotopic MH+ values. All peptide profile matrices were created with the software package default settings, such as exclusion of single charged masses.
Mass and retention time window
To prevent software packages recording too much redundant peptide masses and misfits through the use of a retention time window that is too narrow when the peptide profile matrix is being constructed, expected retention time differences of peptides were determined between two consecutive LC runs of replicates.
Based on the maximum expected retention time differ-ences observed in Additional File 5, we used a conservative time window of 5 min [16] (400 frames for msInspect) and mass window of 0.02 Da (10 ppm for Peptrix) for the soft-ware packages Peptrix, Sieve™ to produce the four MS1 peptide profile matrices for the three IgG Fab repli-cates for mainly double and triple charged peptides [Addi-tional Files 6, 7, 8, and 9]. A setting of 50,000 frames was used for Sieve™. Mass and retention time windows could not be set for Progenesis™.
The time window of 5 minutes is used in an addi-tional way in Peptrix. Peptrix has an algorithm that avoids redundancies of peptide masses. When a peptide mass is detected by Peptrix at a specific retention time it is recorded in the Peptide profile matrix. When the same eluting peptide mass is detected again at a later moment within the time window of the previous mea-surement it is not recorded twice in the Peptide profile matrix. The last measured retention time is used as a new reference point. This process is repeated as long as the mass is measured within the time window of the last measured retention time.
Time alignment in Peptrix was performed using a polynomial fit which follows a theoretical function based on LC-separation theory [17-22] [Additional File 10]. The initial difference in retention time of the bulk of peptide masses is about 1 min but gradually decreases with the retention time of the LC-run to almost 0 after 120 min. In the function, the difference in retention Titulaeret al.BMC Research Notes2011,4:21
http://www.biomedcentral.com/1756-0500/4/21
time (dtR) decreases with retention time (tR) due to a
difference in capacity factors (dka) between two runs.
dtR =dka*tm*exp⎡⎣−mb t
(
R −tm)
⎤⎦ (1) The retention time of the mobile phase (tm) wasesti-mated as approximately 2 min, and therefore (tR> tm).
The factor (m) has no dimension. The difference in retention time is also smaller with a larger slope of gra-dient Acetonitril (ACN) in time (b) with a factor 2 after 120 min [Additional File 5].
MS2 sequenced and identified masses
Values of peptide masses found in MS1 spectra by peptide profiling were verified using values of MS2 sequenced masses that resulted in protein identifications with a significant score and a Gene Identifier (GI), using the Mascot™ Daemon interface (Matrix Science, UK) [23]. MS2 triggered means that the Xcalibur™software selects the peak mass in the MS1 spectrum for MS2 fragmenta-tion and sequencing depending on inclusion settings. The MS2 fragmentation does not necessarily result in peptide identifications of proteins with a GI. The quality of the MS2 spectra may be too low to have a significant score from the search engine used. Also sequences of good qual-ity MS2 spectra are sometimes not found in thein-silico digested protein databases.
The Thermo Fischer Scientific extract_msn.exe [23] program embedded in Mascot™Daemon version 2.2.2 [23] interface extracts Mascot™ generic files (MGF) files. The resulting MGF files contain the precursor masses (m/z), their charge states (z), scan identifiers, and peak lists of all MS2 spectra. The MGF files were then sent to the Mascot™ server and the following set-tings were used for the NCBI human database: tryptic digestion considering 1 possible missed cleavage, vari-able modification oxidation of Methionine (M) (mass + 15.9994 Da), 10 ppm precursor and 0.6 Da fragment tolerance.
Comparison matrix
We used Peptrix to compare the matrices from the 4 software packages investigated together with the list of MS2 spectra triggered and MS2 sequenced masses where applicable. It is possible in Peptrix to create a profile matrix of mass-intensity peak-lists from MS experiments [6]. A total of 4 peak-lists containing masses and intensities (1 for each matrix), together with one list of MS2 triggered masses and one list of the MS2 fragmented masses where sequencing succeeded were extracted from the 4 software package peptide pro-files. An artificial reference list or grid of 20,275 masses, approximately equal to the number of features in the MS1 profile matrices, was constructed in a mass range
between 1,600 and 2,400 Da with fixed distances of 20 ppm between the grid masses. A somewhat greater tolerance than the maximum expected mass inaccuracy of 10 ppm was used to reduce the possibility of slightly different masses being measured in the profile matrices of two different software applications for the same pep-tide end in two bins.
Peak masses from the generated 6 peak lists: 4 extracted from the matrices produced by the four soft-ware packages; the list of MS2 triggered masses; and the list of MS2 triggered masses where fragmentation and sequencing succeeded were matched with the artificial reference list using Peptrix. A mass window setting of plus or minus 10 ppm was used. This forces all the masses between 1,600 and 2,400 Da from the peptide profile matrices to match with at least one of the 20,275 grid points of the reference list. The numbers of overlapping and non-overlapping masses from the soft-ware packages were calculated using this constructed comparison matrix (Table 2 and Additional File 11).
Results
Computation time
Table 3 displays the computation time for Peptrix and the 3 compared software packages. Progenesis™has the lowest computation time of 1 hour (with 24 MB RAM).
The software packages msInspect and Sieve™ need
somewhat more time with 2 hours, while Peptrix pro-cesses the data in a slightly longer period of 3.5 hours. This is due to: 1) storage of the peak list on an FTP ser-ver for eser-very MS1 scan; and 2) the extra comparison steps indicated by the grey boxes in Figure 1a when pre-paring the matrix. Peptide masses found in at least 4 MS1 scans (file size ~1MB) are also compared with mono-isotopic masses present in less than 4 MS1 scans (file size ~9 MB). These necessary extra comparison steps guarantee reproducibility of peak intensities in the three replicate measurements when working with peak lists.
Numbers and reproducibility of peptide masses in the peptide profile matrices
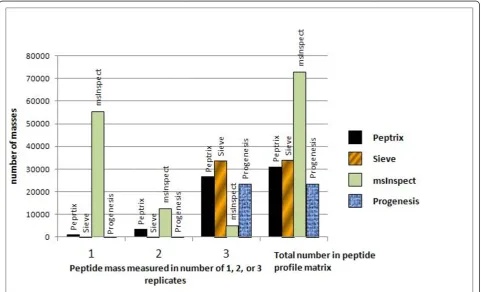
Figure 2 shows a histogram representing the number of peptide masses, recalculated to MH+ values, detected in 1, 2 or 3 technical replicate measurements of the IgG Fab at a specific retention time in MS1 peptide profile matrices produced by the four software packages. Ideally all masses should be measured with the same intensity in the 3 replicate measurements in the sample.
The peptide profile matrices produced by the software packages contain about 20,000 to 70,000 mass-retention time entities (Figure 2). The Peptrix profile matrix
con-tains a total number of 30,986 MH+ masses mainly
detected in double or triple charged peak clusters in the Titulaeret al.BMC Research Notes2011,4:21
http://www.biomedcentral.com/1756-0500/4/21
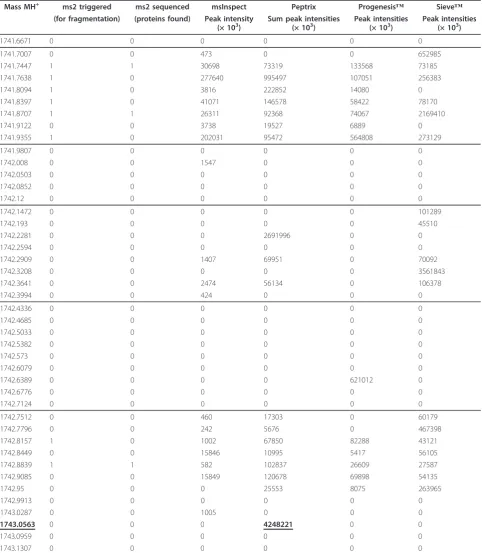
Table 2 A fragment of the comparison matrix
Mass MH+ ms2 triggered ms2 sequenced msInspect Peptrix Progenesis™ Sieve™ (for fragmentation) (proteins found) Peak intensity
(× 103)
Sum peak intensities (× 103)
Peak intensities (× 103)
Peak intensities (× 103)
1741.6671 0 0 0 0 0 0
1741.7007 0 0 473 0 0 652985
1741.7447 1 1 30698 73319 133568 73185
1741.7638 1 0 277640 995497 107051 256383
1741.8094 1 0 3816 222852 14080 0
1741.8397 1 0 41071 146578 58422 78170
1741.8707 1 1 26311 92368 74067 2169410
1741.9122 0 0 3738 19527 6889 0
1741.9355 1 0 202031 95472 564808 273129
1741.9807 0 0 0 0 0 0
1742.008 0 0 1547 0 0 0
1742.0503 0 0 0 0 0 0
1742.0852 0 0 0 0 0 0
1742.12 0 0 0 0 0 0
1742.1472 0 0 0 0 0 101289
1742.193 0 0 0 0 0 45510
1742.2281 0 0 0 2691996 0 0
1742.2594 0 0 0 0 0 0
1742.2909 0 0 1407 69951 0 70092
1742.3208 0 0 0 0 0 3561843
1742.3641 0 0 2474 56134 0 106378
1742.3994 0 0 424 0 0 0
1742.4336 0 0 0 0 0 0
1742.4685 0 0 0 0 0 0
1742.5033 0 0 0 0 0 0
1742.5382 0 0 0 0 0 0
1742.573 0 0 0 0 0 0
1742.6079 0 0 0 0 0 0
1742.6389 0 0 0 0 621012 0
1742.6776 0 0 0 0 0 0
1742.7124 0 0 0 0 0 0
1742.7512 0 0 460 17303 0 60179
1742.7796 0 0 242 5676 0 467398
1742.8157 1 0 1002 67850 82288 43121
1742.8449 0 0 15846 10995 5417 56105
1742.8839 1 1 582 102837 26609 27587
1742.9085 0 0 15849 120678 69898 54135
1742.95 0 0 0 25553 8075 263965
1742.9913 0 0 0 0 0 0
1743.0287 0 0 1005 0 0 0
1743.0563 0 0 0 4248221 0 0
1743.0959 0 0 0 0 0 0
1743.1307 0 0 0 0 0 0
A total of 4 peak-lists containing masses and intensities (1 for each matrix), together with one list of MS2 triggered masses and one list of the MS2 fragmented masses where sequencing succeeded were matched plus or minus 10 ppm with an artificial reference list or grid of masses with fixed distances of 20 ppm. The comparison matrix contains unoccupied space of MH+
mass values, roughly separated by the lines. The triple charged peptide mass 581.69 Da, which when recalculated to the MH+
spectra [Additional File 6]. 86% of all masses are mea-sured in all three replicates.
Sieve™displays a larger total number of 33,967 peptide masses in the profile matrix detected in 50,000 frames with charge states > 0, of which about 21,000 masses have charge states 2 or 3 [Additional File 7]. The peptide profile matrix produced by Sieve™contains peak masses that are nearly present in all 3 replicates for all charge states.
[image:7.595.57.544.100.162.2]The peptide profile matrix produced by msInspect displays the largest number of masses, i.e. 72,895 masses (Figure 2). The most important reason for the large number of masses and the relative lower overlap in msInspect is that it includes peptide masses that are only present in a few Orbitrap™MS1 scans. The other software packages use more scans, e.g. Peptrix requires
a peptide mass in at least 4 consecutive MS1 scans. In msInspect, most masses occur in one replicate, i.e. 76% of the total number. This is due to the fact that msIn-spect creates the peptide profile matrix in a sequence-dependent way. It matches a mass in the third replicate if it is already measured in the first and second replicate [Additional File 8]. Therefore, masses that occur only in the second, third or both measurements are not included in the peptide profile matrix.
[image:7.595.58.540.398.690.2]Progenesis™ measures a low total number of 23,654 masses, of which 19,039 have charge states 2 or 3. Like for Sieve™, nearly all masses measured in all 3 replicates for all charge states (Figure 2). However, this matrix contains redundant peptide masses deviating less than 10 ppm from each other measured at consecutive retention times [Additional File 9].
Table 3 Analysis times of the software packages investigated
Peptrix Sieve™ msInspect Progenesis™
Processor Intel Xeon W3520
Quad-Core 2.67 GHz
Intel Xeon X5472 Quad Core 3 GHz
Intel Xeon 5160 Dual Core 3 GHz
Intel Xeon E5430 Quad Core 2.66 GHz
RAM (Giga Byte, GB) 3.5 3 2 24
Analysis Time (hours) 3.5 2 2 1
Figure 2Histogram representing the number of MS1 peptide masses detected in 1, 2, or 3 technical replicate measurements and the total number of peptide masses in 4 different MS1 software packages. Ideally all masses should be measured in the 3 replicate
measurements of the sample, since the spectra originate from the same sample. Titulaeret al.BMC Research Notes2011,4:21
http://www.biomedcentral.com/1756-0500/4/21
Repeated measurement of a single peptide mass in the peptide profile matrices
For practical reasons the retention time was not consid-ered using the comparison matrix in Table 2 for the four MS1 software packages. Undesired misfits would occur when comparing the matrices using time windows. The four software packages show problems with peak tailing of high abundant peaks. Although the intensities in the peak tail are just fractions (≤0.1%) of the apex intensities, they still can be detected minutes after the peak, and in extreme cases smear until the end of the run. Such an example is shown for MH+peptide mass 1502.756993 Da of Ig kappa chain C region (Table 4) with the sequence DSTYSLSSTLTLSK in the supplemental information, which eluted from approximately 85 to 180 minutes. The peptide mass was measured 28 times in the Progenesis™ peptide profile matrix [Additional File 9], about 27 times in the Sieve™profile matrix [Additional File 7], 8 times in msInspect [Additional File 8], and only 1 time in the Pep-trix profile maPep-trix [Additional File 6].
Another extreme example is the peptide
VYA-CEVTHQGLSSPVTK with mass MH+1818.9042 Da of Ig
kappa chain C region (Table 4). This peptide eluted between approximately 50 and 130 minutes and the mass was measured 19 times in the Progenesis™peptide profile matrix [Additional File 9], 10 times in the Sieve™profile matrix [Additional File 7], about 18 times in msInspect [Additional File 8], and 3 times in the Peptrix profile matrix [Additional File 6].
Overlap of peptide masses between the MS1 peptide profile matrices
A number of 1,578 Peptrix peptide masses between 1,600 and 2,400 Da differ more than 20 ppm from each other [Additional File 6]. This number represents 27% of the grid points in the comparison matrix. In reality, 38% (> 27%) of the total number of grid points match with a Peptrix single peptide [Additional File 11]. This means that some Peptrix masses within 20 ppm split-up and match with two grid-points. Therefore, the non-matching peptide masses measured between the packages are really significant for 100 * 27/38≈70%. The other grid points match with more than one mass in the Peptrix peptide profile matrix. Percentages: 36%, 16%, 7%, 2% and 1% of the 5,777 grid points are measured for combinations with 2, 3, 4, 5 and 6 masses of the Peptrix peptide profile matrix respectively. This means that overlap between packages is likely to be overestimated using the comparison matrix grid, not taking the retention time into account.
Figure 3 shows the pair-wise overlap between two packages in descending overlap order, using the com-parison matrix. The average number of 5,618 masses in the comparison matrix for each package is about four times lower than the 20,275 reference points between
1,600 and 2,400 Da, since the grid in the comparison matrix contains unoccupied space of MH+mass values (see Table 2 and Additional File 11). The overlap between each time two packages is relatively low with 1/3 of the number of matches with the grid of two soft-ware packages together. Most overlap was determined between Peptrix and msInspect, and the least overlap was between Sieve™and Progenesis™.
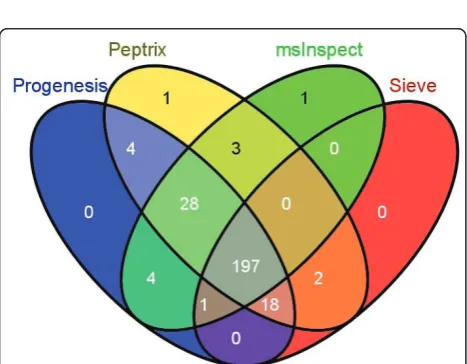
The numbers of matched masses between more than 2 software packages are presented in the 4-way Venn diagram in Figure 4. The number of non-overlapping masses from the software packages is relatively large for Peptrix, Sieve™ and msInspect, i.e. 1,302 for Peptrix, 1,920 for Sieve™and 2,791 for msInspect, while 160 is measured for Progenesis™. The number of non-match-ing MH+ peptide masses in Figure 4 increases with the size of the peptide profile matrices (Figure 2). Only a small number of masses (1,802) overlap between all soft-ware packages. This number represents approximately 32% of the average total number of 5,618 possible matches with the grid for each software package. If the number of masses present in three applications reflects real masses, the same number represents the number of missing masses, since these masses should be detected by the four software packages. In total 1,561 distinct missing masses MH+ are measured between 1,600 and 2,400 Da; 759+124+258 + 420 (Figure 4). The ratio
between detected and not-detected MH+ masses for
each software application, irrespective of their accuracy, can be estimated at 1,561:1,802≈1:1.
Overlap of MS2 triggered and sequenced masses
A sub-selection from the comparison matrix in Table 2 [Additional File 11] was taken for MS2 triggered masses where sequencing succeeded and proteins were identi-fied, using the MGF files from the 3 technical replicates [Additional Files 12, 13, and 14]. Figure 5 shows the pair-wise overlap of MS2 triggered, sequenced, and identified masses between two software packages in des-cending order of overlap. The most overlap (96%) is measured between Peptrix and Progenesis™, with the least overlap (78%) between Sieve™and msInspect. We find just 260 MS2 precursors identified in a 3 h gradi-ent between 1,600 and 2,400 Da. One major reason for this relatively low number is that we are working with an IgG Fab fragment sample yielding a lower number of identifications, presumably because quite a proportion of the peptides have unknown sequences not present in the protein database, which means they are MS2 triggered and sequenced, but protein identification succeeded.
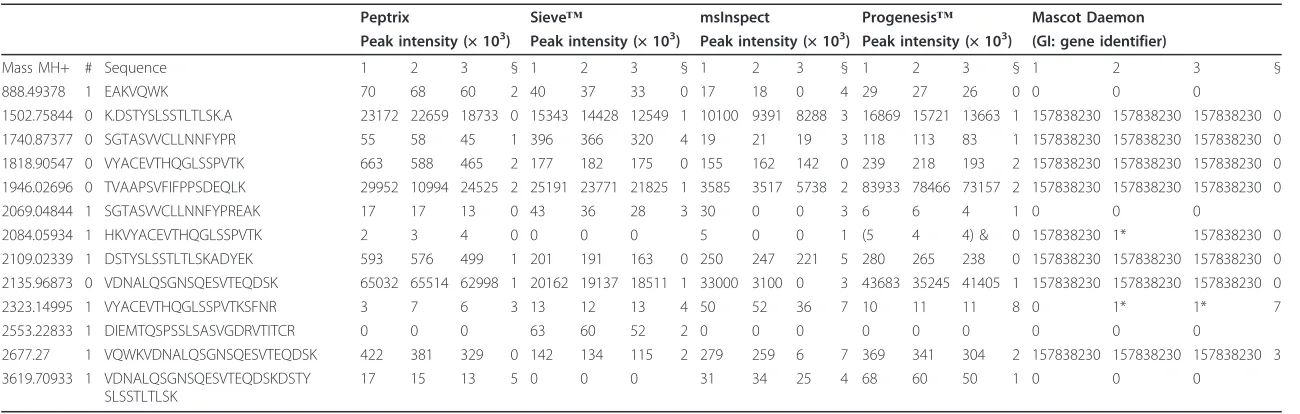
Table 4 Peptide masses of in-silico digested Ig kappa chain C region, GI 157838230, either found in the software packages Peptrix, Sieve™, msInspect, Progenesis™and the Mascot™Daemon
Peptrix Sieve™ msInspect Progenesis™ Mascot Daemon Peak intensity (× 103) Peak intensity (× 103) Peak intensity (× 103) Peak intensity (× 103) (GI: gene identifier)
Mass MH+ # Sequence 1 2 3 § 1 2 3 § 1 2 3 § 1 2 3 § 1 2 3 §
888.49378 1 EAKVQWK 70 68 60 2 40 37 33 0 17 18 0 4 29 27 26 0 0 0 0
1502.75844 0 K.DSTYSLSSTLTLSK.A 23172 22659 18733 0 15343 14428 12549 1 10100 9391 8288 3 16869 15721 13663 1 157838230 157838230 157838230 0 1740.87377 0 SGTASVVCLLNNFYPR 55 58 45 1 396 366 320 4 19 21 19 3 118 113 83 1 157838230 157838230 157838230 0 1818.90547 0 VYACEVTHQGLSSPVTK 663 588 465 2 177 182 175 0 155 162 142 0 239 218 193 2 157838230 157838230 157838230 0 1946.02696 0 TVAAPSVFIFPPSDEQLK 29952 10994 24525 2 25191 23771 21825 1 3585 3517 5738 2 83933 78466 73157 2 157838230 157838230 157838230 0
2069.04844 1 SGTASVVCLLNNFYPREAK 17 17 13 0 43 36 28 3 30 0 0 3 6 6 4 1 0 0 0
2084.05934 1 HKVYACEVTHQGLSSPVTK 2 3 4 0 0 0 0 5 0 0 1 (5 4 4) & 0 157838230 1* 157838230 0 2109.02339 1 DSTYSLSSTLTLSKADYEK 593 576 499 1 201 191 163 0 250 247 221 5 280 265 238 0 157838230 157838230 157838230 0 2135.96873 0 VDNALQSGNSQESVTEQDSK 65032 65514 62998 1 20162 19137 18511 1 33000 3100 0 3 43683 35245 41405 1 157838230 157838230 157838230 0
2323.14995 1 VYACEVTHQGLSSPVTKSFNR 3 7 6 3 13 12 13 4 50 52 36 7 10 11 11 8 0 1* 1* 7
2553.22833 1 DIEMTQSPSSLSASVGDRVTITCR 0 0 0 63 60 52 2 0 0 0 0 0 0 0 0 0
2677.27 1 VQWKVDNALQSGNSQESVTEQDSK 422 381 329 0 142 134 115 2 279 259 6 7 369 341 304 2 157838230 157838230 157838230 3 3619.70933 1 VDNALQSGNSQESVTEQDSKDSTY
SLSSTLTLSK
17 15 13 5 0 0 0 31 34 25 4 68 60 50 1 0 0 0
# missed cleavage, § mass accuracy in ppm, * MS triggered but no protein matches, & charge 4+ (charge 4+ not included in Peptrix). The spectral intensities of the triplicate measurements of each peptide mass are presented in the columns, except for Mascot™Daemon. The corresponding GI numbers of the identified proteins by Mascot™Daemon are presented in the Mascot™Daemon columns.
Titulaer
et
al
.
BMC
Research
Notes
2011,
4
:21
http://ww
w.biomedcen
tral.com/1756
-0500/4/21
Page
9
of
diagram. When comparing identified MS2 precursors from MS2 spectra with a Mascot™score > 25, the over-lap between all software packages is relatively high with approximately 76% (197/260) of the total number of sequenced and identified masses.
[image:10.595.57.291.87.269.2]An example of a non-overlapping peptide mass
Figure 7 shows an example of an MS1 spectrum for the raw Orbitrap™file containing a low intensity peak at a triple charged mass 581.69 Da, which when recalculated to the MH+ value of 1743.0515 Da is only detected by Peptrix (Table 2, Additional Files 6 and 11), and absent in the peak lists for the other software packages [Addi-tional Files 7, 8, and 9]. The peak at mass 581.69 Da is in an overlapping cluster of triple charged peptide iso-topes. The intensity of the peak is low so the peak is not selected for MS2 sequencing. The isolation width of the mass spectrometer is wide enough to be selected with a more abundant peak close to it, but the intensity of the fragment ions are probably too low to be detected in the resultant MS2 spectrum. The double charged mass for this peptide, 872.03 Da, is present in the spec-trum. However, this mass is in a complex overlapping cluster and the charge of this mass cannot be deter-mined. The double charged mass is therefore absent from the peak lists for all packages.
[image:10.595.57.292.454.622.2]Differences in peak intensities
Table 4 shows peptide masses MH+ for the in-silico digested highly abundant, most frequently sequenced protein Ig kappa chain C region, GI 157838230, found in any of the investigated software packages. The corre-sponding GI protein number is presented in the Mas-cot™ Daemon columns of Table 4. It appears that the non-sequenced peptide mass 2553.22833 Da is found exclusively by Sieve™, and is absent from the matrices of the other packages. Conversely, the low intensity MS1 masses 888.49378 and 2069.04844 are found by all software applications in one or more replicates, but are never triggered for MS2.
The peak intensities do not vary much between differ-ent replicate measuremdiffer-ents in one application, but vary greatly between the investigated applications as show in Table 4. An exception to this is msInspect. Low intensity peaks are not always detected in triplicate by msInspect as was already visible in the histogram in Figure 2, e.g. for mass 2069.04844 Da, which has only one intensity of 30 arbitrary units measured in replicate number 1.
On average, the peak intensity increases in the order: msInspect, Sieve™, Peptrix, Progenesis™. This ranking is not consistent over all peptide masses, however. For example, the high intensity of mass 1502.75844 Da ranks in the order: msInspect, Sieve™, Progenesis™, Peptrix; and the lower intensity of the mass 1740.87377 Da ranks in the order: msInspect, Peptrix, Progenesis™, Sieve™. For the lower peak intensities, with presumably low signal to noise ratios Sieve™measures a relative high intensity, while for the relative high peak intensities with presum-ably high signal to noise ratios Progenesis™and Peptrix measure relative high peak intensities.
Figure 3 A pair-wise comparison of overlapping peptide masses, each time between the peptide profile matrices of two MS1 software packages. A comparison matrix was constructed by Peptrix using an artificial grid of 20275 masses between 1600 and 2400 Da with distances of 20 ppm between the masses. Peak masses from two peptide profile matrices for the software packages Peptrix, Sieve™, Progenesis™and msInspect were matched with this grid in the comparison matrix, using a mass window with 10 ppm in two directions and a total distance of 20 ppm.
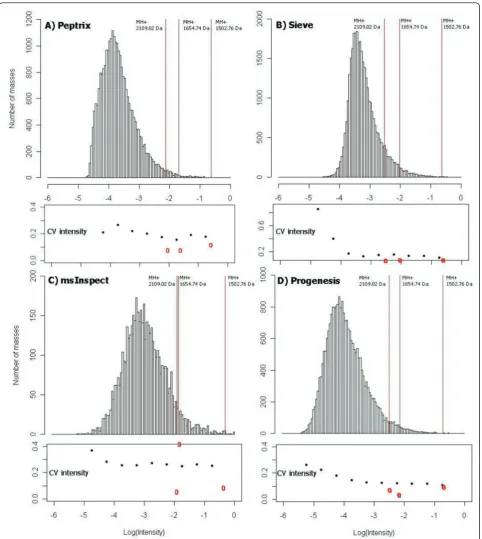
It is interesting that the relative intensity of features is not preserved amongst the software packages. Figure 8 shows the distribution of intensity, 10log(I/Imax), of
tri-plicate measured peptide masses in the peptide profile matrices of each software package, A) Peptrix, B) Sieve™, C) msInspect, and D) Progenesis™, respec-tively. The value10log(I/Imax) is 0 for the peptide mass
with the highest intensity I = Imaxin the peptide profile
matrix. The heights of the bars in the histogram repre-sent the number of lower intensity masses with10log(I/ Imax) < 0. The vertical red lines mark the relative
intensities, 10log(I/Imax), of 3 peptide masses MH+,
2109.02 and 1502.76 Da of Ig kappa chain C region (Table 4), and a mass MH+ 1654.74 Da of Ig lambda-1 chain C regions. The intensity distributions of the four software packages align on the logarithm of relative intensities of the 3 peptide masses approximately at -0.5, -1.9, and -2.2. The maximum in the distribution for each software package represents the number of features just above the signal to noise cut-off. Sieve™ displays a relative high intensity 10log(I/Imax) of the peak
maxi-mum between -3 and -4 in Figure 8A. This agrees with the fact that Sieve™ processes relative high intensity values of low intensity features in Table 4. Peptrix dis-plays the maximum at 10log(I/Imax) just above -4, and
[image:11.595.57.291.438.620.2]Progenesis™just below -4. The intensity distribution of msInspect displays the maximum at a relative high intensity, due to the relative high intensity of triplicate measured features, 6% of the total measured number of features (Figure 2).
Figure 8 shows the CV’s of triplicate measured peak intensities as a function of the relative intensity,10log(I/ Imax), of A) Peptrix, B) Sieve™, C) msInspect, and D)
Progenesis™, respectively. The CV’s slightly increase with lower intensity of the peptide peak intensities and more strongly at the signal to noise threshold of peak detection; 10log(I/Imax) < -4. The average CV’s of
tripli-cate measured peak intensities were: Peptrix 25%; Sieve™15%; msInspect 26%; and Progenesis™17%.
We calculated the experimental CV of intensity from hand picked triplicate charged mono-isotopic peaks (703.67 Da) and double charged mono-isotopic peaks (1055,01 Da) of mass MH+ 2109,02 in the spectra of 11 scans. The peptide mass MH+ 2109,02 of Ig kappa chain C region, GI 157838230 eluted after 98.4 minutes from the LC column in a time window of 11 scans (1 minute) with 10log(I/Imax)≈ -2.2. The experimental
CV of intensity of the triplicate charged peak was 10% and 14% of the double charged peak with a 4x lower intensity. A CV of 10% was calculated from the intensi-ties of triplicate charged and double charged mono-iso-topic peaks together. The CV’s were not different calculated from the integral of intensity in time or tak-ing the intensity at the peak maximum in time. The
Figure 5 A pair-wise comparison of peptide masses overlapping with identified protein GI’s, each time between the peptide profile matrices from two MS1 software packages. All masses are sequenced and identified, including the non-overlapping masses in the individual packages. A comparison matrix was constructed by Peptrix using an artificial grid of 20275 masses between 1600 and 2400 Da with distances of 20 ppm between the masses. Peak masses from two peptide profile matrices identified with protein GI’s for the software packages Peptrix, Sieve™, Progenesis™and msInspect were matched with the comparison matrix grid, using a mass window with 10 ppm in two directions and a total distance of 20 ppm.
Figure 6A 4-way Venn diagram representing the numbers of peptide masses identified with protein GI’s in each matrix for Peptrix, Sieve™, Progenesis™and msInspect, which match between 1, 2, 3, or 4 software packages. A comparison matrix was constructed by Peptrix using an artificial grid of 20275 masses between 1600 and 2400 Da and distances of 20 ppm between the masses. Peak masses identified with protein GI’s from the individual peptide profile matrices for the software packages were matched with the comparison matrix grid, using a mass window with 10 ppm in two directions and a total distance of 20 ppm. Titulaeret al.BMC Research Notes2011,4:21 http://www.biomedcentral.com/1756-0500/4/21
average CV’s of triplicate measured peak intensities of
mass MH+ 2109.02 were; Peptrix 11%; Sieve™ 11%;
msInspect 7%; and Progenesis™10% (red circles in Fig-ure 8). The CV’s agree with the experimental value of 10%.
The CV’s of intensity of two other Peptide masses MH + 1654.74 Da and 1502.76 Da were 9 and 12% for Pep-trix, 5 and 10% for Sieve™, 45 and 10% for msInspect, and 5 and 11% for Progenesis™(red circles in Figure 8). The CV’s agree with the experimental value of 10%. The average CV’s of the software packages are larger. The larger average CV for Peptrix can be ascribed to match-ing errors of intensities between the peak lists. An example of such an error is the intensity 10994 in the list of replicate intensities 29952, 10994, and 24525 for mass MH+ 1946.02696 in Table 4. The relative high CV
of 45% for mass MH+ 1654.74 Da for msInspect in
Figure 8C can also be ascribed to a wrongly matched intensity.
Discussion and Conclusions
Peak picking from individual spectra before generation of the profile matrix as implemented in Peptrix has the advantage of parallel processing and scalability to a large number of spectra and distributed computer power. Peptrix, Sieve™, and msInspect run on average compu-ter systems. Comparison of spectral intensities over all samples at once requires a lot of RAM for Progenesis™, which may be a disadvantage with an increasing size of datasets. We determined the reproducibility of the
measurements by triplicate LC runs for one sample. We are aware that the number of samples used (3 replicates) does not really reflect an experimental setup for regular proteomics studies, but allows in-depth analysis how these software packages perform technically. The biolo-gical replicates used usually far exceed the numbers pre-sented. Therefore we present as a practical example of Peptide profiling by Peptrix, the analysis results of Orbi-trap™ measurements of in total 40 micro-dissected tis-sue samples in Figure 9. Peptrix can analyze the 40 Orbitrap™ raw files of the micro-dissected tissue samples, each of approximately 500 MB in 53 hours, 1 hour and 20 minutes for each file, using a 2.67 GHz Intel Xeon W3520 Quad-Core processor and 3.5 GB of RAM, a relatively low Java memory heap size (XMX) with settings of 1024 Mega Byte (MB).
In particular, the software packages that compare the spectral patterns over all samples directly, such as Pro-genesis™ and Sieve™, produce very reproducible peak lists with a low CV of intensity as was demonstrated in the histogram of the triplicate measurements for the IgG Fab. A single replicate measurement of a sample in large sample datasets should be sufficient in peptide profiling studies.
When matrices are prepared from peak lists, it is important to also store the masses of rejected peaks into
[image:12.595.60.540.85.283.2]“noise”lists (grey boxes in Figure 1a) to improve repro-ducibility of the measurements (Figure 2), since low intensity peaks can either just fit or not fit the selection criteria. These additional noise-lists can be used when
Figure 8The distribution of intensity,10log(I/Imax), and CV’s of triplicate measured peak intensities of peptide masses in the peptide profile matrices. The value10log(I/Imax) is 0 for the peptide mass with the highest intensity I = Imaxin the peptide profile matrix. The heights of the bars in the histogram represent the number of lower intensity masses with10log(I/Imax) < 0 of each software package, A) Peptrix, B) Sieve™, C) msInspect, and D) Progenesis™, respectively. The vertical red lines mark the relative intensities,10log(I/Imax), of 3 peptide masses MH+, 2109.02 and 1502.76 Da of Ig kappa chain C region (Table 4), and a mass MH+1654.74 Da of Ig lambda-1 chain C regions. The intensity distributions of the four software packages align on the logarithm of relative intensities of the 3 peptide masses, approximately at -0.5, -1.9, and -2.2. The maximum in the distribution for each software package represents the number of features just above the signal to noise cut-off. The CV’s slightly increase with lower intensity of the peptide peak intensities and more strongly at the signal to noise threshold of peak detection,10log(I/I
max) < -4. Titulaeret al.BMC Research Notes2011,4:21
http://www.biomedcentral.com/1756-0500/4/21
preparing the peptide profile matrix. First, a peak mass in the list from one sample is matched with the peak mass in the list from another sample. If this mass is not present in the peak list from the other sample, it is searched for in the noise-list from the other sample. An FT-ICR MS example of such an approach was presented in our previous paper [6], and we have extended this approach for LC-MS.
High intensity peptide mass peaks in the MS1 spectra result most frequently in better MS2 fragmentation spectra and lead to more identified proteins after searching for peptide sequences in the protein databases. As expected, the peak picking of the high intensity peaks is more effective since the overlap between the software packages for these sequenced mass lists is higher as been demonstrated in Figures 5 and 6 than for all peptide masses as been demonstrated in Figures 3 and 4. The peptide masses in Figures 3 and 4 include low abundant peptide masses digested from low abun-dant proteins. It shows that all packages are capable of detecting peptides of high abundant proteins in a reli-able way, but that they differ in detection of low con-centration peptides. The average overlap for low abundant peptides is 1/2/(1/2+1/2+1/2)≈32% (Figure 3) as approximately 1/2 of the peaks are not found. Peak finding might be especially difficult for low intensity overlapping isotopic clusters in the mass spectra.
MS2 sequencing and protein identification requires accuracy of the mono-isotopic mass. The applications that perform isotopic pattern recognition, such as Peptrix, msInspect, and Progenesis™, show the largest overlap in Figure 5. The software application msIn-spect has the largest number of non-overlapping masses. In comparing numbers of peptide features detected alone (Figure 2), one could conclude that Sieve™ works the best, followed by Peptrix and Pro-genesis™. Sieve™ does not perform isotopic pattern recognition. This has the disadvantage that isotopes of a peptide mass can be wrongly assigned as the mono-isotopic mass. This may explain why Sieve™measures a relative high intensity for the lower peak intensities, with presumably low signal to noise ratios (Table 4). Some features in the Sieve™ profile matrix [Addi-tional File 7] also display non integer values for the charge state, because the real MH+ value is for one reason ore another difficult to calculate (for example overlapping peaks). Sieve™ presumably combines dif-ferent peptides with difdif-ferent charge states in a single frame (Figure 1b).
False Discovery Rates (FDRs) could be calculated, by comparing the peptide masses in the profile matrices with those from hand-picked peaks in a single MS1 scan, for
example scanning 9919 at a retention time of 113.48 min-utes. However, in this single scan, hundreds and perhaps even thousands of low intensity peptide features can be detected, making a manual FDR calculation impossible. This indicates that the software packages have likely a high false negative rate (missing peptides).
When comparing the peak lists forin-silico digested peptide masses from IgG Fab, it appears that all soft-ware packages are capable of extracting almost 100% of the peptide masses, however, with different intensities, and by contrast for msInspect not always in a reproduci-ble way in replicates. Apparently, peak intensities are established by the MS1 software packages investigated in a different way. Peptrix determines the highest inten-sity of a peptide MH+ mono-isotope mass in a LC elu-tion profile. The intensities of double and triple charged peptides are combined. Sieve™ takes the integral of intensity under the elution curve of a frame (Figure 1b). The software package msInspect determines the highest intensity of an isotopic mass in an isotopic cluster as a function of LC time. This is not necessarily the mono-isotope. Progenesis™ calculates the integral of intensity in two dimensions, in direction of mass and retention time in a 2-D gel view (Figure 1).
Availability and requirements
The Peptrix java application is freely available and runs on Microsoft Windows 2000 OS or higher. It requires: Readw.exe version 4.2.1, R (R-2.5.1-win32.exe or higher) [24]; Quick ‘n Easy FTP Server 3.1 Lite or higher [25]; MySQL 5.0.45 (mysql-5.0.45-win32.zip) or higher data-base [26]; Java Runtime Environment (JRE) 6 Update 2 or higher (jre-6u2-windows-i586-p.exe) [27]; edtftpj-1.5.5 or higher (edtftpj.jar) [28]; Eclipse IDE for Java Developers - Windows [29]; mysql-connector-java-5.0.7-bin.jar or higher. The source code of Peptrix 2.4.9 is available as a zip file [Additional File 15], as well as the database script [Additional File 16], with detailed instal-lation and running instructions [Additional File 17]. The raw Orbitrap™ files conversion to mzXML formatted files was tested with Readw.exe version 4.2.1 [11] [Addi-tional File 18]. Because the Readw.exe program depends on Windows-only vendor libraries from Thermo, the code for Orbitrap™ data handling will only work under Windows with Thermo Fischer Scientifics’ Xcalibur™ software installed. If the Readw.exe program doesn’t work properly, download zlib1.dll from Additional File 19. Put zlib1.dll in the c:\windows\system32\directory, and enter “regsvr32 c:\windows\system32\zlib1.dll” in the Windows command prompt (MSDOS box). The lat-est version 2.5.0 of Peptrix is available as a zip file [Additional File 20].
Titulaeret al.BMC Research Notes2011,4:21 http://www.biomedcentral.com/1756-0500/4/21
Additional material
Additional file 1: Sample preparation.
Additional file 2: Immobilized Papain instructions.
Additional file 3: MicroLink™™protein coupling kit instructions.
Additional file 4: LC separation and Orbitrap™™mass spectrometry measurements.
Additional file 5: Scatter plot of differences in retention time of potential mass pairs obtained by Peptrix deviating no more than 10 ppm in consecutive LC-runs of replicates of digested IgG Fab. The difference in retention time is plotted as a function of the retention time in the first run. The initial difference in retention time of the bulk of peptide masses is about 1 min but gradually decreases with the retention time of the LC-run to almost 0 after 120 min, shown by the black polynomial fit. The black points represent retention time differences over two runs of 5 identified peptide masses of the protein Ig kappa chain C region, GI 157838230, i.e. 1502.75844, 1946.02696, 2109.02339, 2135.96873, and 2677.27 Da, varying between 0 and 0.2% of the retention time.
Additional file 6: The Peptrix MS1 peptide profile matrix.
Additional file 7: The Sieve™™MS1 peptide profile matrix.
Additional file 8: The msInspect MS1 peptide profile matrix.
Additional file 9: The Progenesis™™MS1 peptide profile matrix.
Additional file 10: A theoretical model for retention time differences.
Additional file 11: A comparison matrix with a grid of 20275 masses between 1600 and 2400 Da with distances of 20 ppm between the masses. Peak masses from the peptide profile matrices for the software packages Peptrix, Sieve™™, msInspect, Progenesis™™and Mascot™™Daemon are matched with the grid, using a mass window with 10 ppm in two directions, and a total distance of 20 ppm.
Additional file 12: The Mascot™™Daemon MS2 export of replicate sample 1.
Additional file 13: The Mascot™™Daemon MS2 export of replicate sample 2.
Additional file 14: The Mascot™™Daemon MS2 export of replicate sample 3.
Additional file 15: Java source code of Peptrix version 2.4.9.
Additional file 16: Create table script for the MySQL™™database.
Additional file 17:Installation instructions.
Additional file 18:The Readw.exe version 4.2.1 (raw to mzXML) converter.
Additional file 19:The zlib1.dll library.
Additional file 20:The latest version 2.5.0 of Peptrix.
List of abbreviations
ACN: Acetonitrile; CSF: Cerebro Spinal Fluid; CV: coefficient of variation; Fab: Fragment antigen binding (of immunoglobulin); FDR: False Discovery Rate; GB: Giga Byte; GI: Gene Identifier; IgG: immunoglobulin G; LC: Liquid Chromatography; MALDI: Matrix Assisted Laser Deionization; MB: Mega Byte; MGF: Mascot™Generic Files; MH+: protonated (peptide) mass; MS: Mass Spectrometry; MS1: Full Mass Spectrum; MS2: Fragmentation spectrum (MS/ MS) (of a peptide mass); m/z: mass over charge; mzXML: mass over charge eXtensible Markup Language; NCBI: National Center for Biotechnology Information; OS: Operating System; ppm: parts per million (10-6); TOF: Time Of Flight; FT-ICR: Fourier Transform Ion Cyclotron Resonance; RAM: Random Access Memory; XMX: maximum memory heap size (of the Java executable); z: charge state
Author details
1Laboratory of Neuro-Oncology and Clinical and Cancer Proteomics,
Department of Neurology, Erasmus University Medical Center, Dr.
Molewaterplein 50, P.O. Box 2040, 3000 CA Rotterdam, The Netherlands. 2Academic Medical Center, University of Amsterdam, Meibergdreef 9, P.O.
Box 22660, 1100 DD Amsterdam, The Netherlands.3Department of Pulmonology, Erasmus University Medical Center, Dr. Molewaterplein 50, P.O. Box 2040, 3000 CA Rotterdam, The Netherlands.
Authors’contributions
MKT performed bioinformatics research, designed and programmed Peptrix. DDC performed data analysis. CS and LJD performed the mass spectrometry measurements. All authors read and agreed with the manuscript.
Competing interests
The authors declare that they have no competing interests.
Received: 25 September 2010 Accepted: 27 January 2011 Published: 27 January 2011
References
1. [http://www.thermo.com].
2. Alves RD, Eijken M, Swagemakers S, Chiba H, Titulaer MK, Burgers PC, Luider TM, van Leeuwen JP:Proteomic analysis of human osteoblastic cells: relevant proteins and functional categories for differentiation.
Journal of proteome research9(9):4688-4700.
3. Dekker LJ, Burgers PC, Charif H, van Rijswijk AL, Titulaer MK, Jenster G, Bischoff R, Bangma CH, Luider TM:Differential expression of protease activity in serum samples of prostate carcinoma patients with metastases.Proteomics10(12):2348-2358.
4. Stoop MP, Singh V, Dekker LJ, Titulaer MK, Stingl C, Burgers PC, Sillevis Smitt PA, Hintzen RQ, Luider TM:Proteomics comparison of cerebrospinal fluid of relapsing remitting and primary progressive multiple sclerosis.
PLoS One5(8):e12442.
5. Carvalho-Oliveira IM, Charro N, Aarbiou J, Buijs-Offerman RM, Wilke M, Schettgen T, Kraus T, Titulaer MK, Burgers P, Luider TM,et al:Proteomic analysis of naphthalene-induced airway epithelial injury and repair in a cystic fibrosis mouse model.Journal of proteome research2009,8(7):3606-3616.
6. Titulaer MK, Mustafa DA, Siccama I, Konijnenburg M, Burgers PC, Andeweg AC, Smitt PA, Kros JM, Luider TM:A software application for comparing large numbers of high resolution MALDI-FTICR MS spectra demonstrated by searching candidate biomarkers for glioma blood vessel formation.BMC bioinformatics2008,9:133.
7. Titulaer MK, Siccama I, Dekker LJ, van Rijswijk AL, Heeren RM, Sillevis Smitt PA, Luider TM:A database application for pre-processing, storage and comparison of mass spectra derived from patients and controls.
BMC bioinformatics2006,7:403.
8. Lange E, Tautenhahn R, Neumann S, Gropl C:Critical assessment of alignment procedures for LC-MS proteomics and metabolomics measurements.BMC bioinformatics2008,9:375.
9. Mueller LN, Brusniak MY, Mani DR, Aebersold R:An assessment of software solutions for the analysis of mass spectrometry based quantitative proteomics data.Journal of proteome research2008,7(1):51-61. 10. [http://omics.pnl.gov/software/].
11. [http://sourceforge.net/projects/sashimi/files/]. 12. [http://proteomics.fhcrc.org/].
13. Bellew M, Coram M, Fitzgibbon M, Igra M, Randolph T, Wang P, May D, Eng J, Fang R, Lin C,et al:A suite of algorithms for the comprehensive analysis of complex protein mixtures using high-resolution LC-MS.
Bioinformatics (Oxford, England)2006,22(15):1902-1909.
14. [http://www.nonlinear.com].
15. Mustafa DA, Burgers PC, Dekker LJ, Charif H, Titulaer MK, Smitt PA, Luider TM, Kros JM:Identification of glioma neovascularization-related proteins by using MALDI-FTMS and nano-LC fractionation to microdissected tumor vessels.Mol Cell Proteomics2007,6(7):1147-1157. 16. Mueller LN, Rinner O, Schmidt A, Letarte S, Bodenmiller B, Brusniak MY,
Vitek O, Aebersold R, Muller M:SuperHirn - a novel tool for high resolution LC-MS-based peptide/protein profiling.Proteomics2007, 7(19):3470-3480.
17. Jandera P, Churácek J:Gradient Elution in Liquid Chromatography.
Journal of chromatography1974,91:207-221.
19. Pecsok RL, Shields LD, Cairns T, McWilliam IG:Modern methods of chemical analysis.New York: Wiley;, 2 1976.
20. Schoenmakers PJ, Billiet HAH, Tijssen R, De Galan L:Gradient selection in reversed- phase liquid chromatography.Journal of chromatography1978, 149:519-537.
21. Shinoda K, Tomita M, Ishihama Y:Aligning LC peaks by converting gradient retention times to retention index of peptides in proteomic experiments.Bioinformatics (Oxford, England)2008,24(14):1590-1595. 22. Yoshida T:Prediction of peptide retention times in normal-phase liquid
chromatography.Journal of chromatographyA1998,811:61-67. 23. [http://www.matrixscience.com].
24. [http://www.r-project.org].
25. [http://www.pablosoftwaresolutions.com]. 26. [http://www.mysql.com].
27. [http://java.sun.com]. 28. [http://www.enterprisedt.com]. 29. [http://www.eclipse.org].
doi:10.1186/1756-0500-4-21
Cite this article as:Titulaeret al.:Label-free peptide profiling of Orbitrap™™full mass spectra.BMC Research Notes20114:21.
Submit your next manuscript to BioMed Central and take full advantage of:
• Convenient online submission
• Thorough peer review
• No space constraints or color figure charges
• Immediate publication on acceptance
• Inclusion in PubMed, CAS, Scopus and Google Scholar
• Research which is freely available for redistribution
Submit your manuscript at www.biomedcentral.com/submit
Titulaeret al.BMC Research Notes2011,4:21 http://www.biomedcentral.com/1756-0500/4/21
![Figure 7 shows an example of an MS1 spectrum for theraw OrbitrapPeptrix (Table 2, Additional Files 6 and 11), and absentin the peak lists for the other software packages [Addi-tional Files 7, 8, and 9]](https://thumb-us.123doks.com/thumbv2/123dok_us/8259682.277549/10.595.57.291.87.269/figure-example-spectrum-orbitrappeptrix-additional-absentin-software-packages.webp)