T E C H N I C A L N O T E
Open Access
Microarray
Я
US: a user-friendly graphical
interface to Bioconductor tools that enables
accurate microarray data analysis and expedites
comprehensive functional analysis of microarray
results
Yilin Dai
1†, Ling Guo
1†, Meng Li
2and Yi-Bu Chen
2*Abstract
Background:Microarray data analysis presents a significant challenge to researchers who are unable to use the powerful Bioconductor and its numerous tools due to their lack of knowledge of R language. Among the few existing software programs that offer a graphic user interface to Bioconductor packages, none have implemented a comprehensive strategy to address the accuracy and reliability issue of microarray data analysis due to the well known probe design problems associated with many widely used microarray chips. There is also a lack of tools that would expedite the functional analysis of microarray results.
Findings:We present MicroarrayЯUS, an R-based graphical user interface that implements over a dozen popular Bioconductor packages to offer researchers a streamlined workflow for routine differential microarray expression data analysis without the need to learn R language. In order to enable a more accurate analysis and interpretation of microarray data, we incorporated the latest custom probe re-definition and re-annotation for Affymetrix and Illumina chips. A versatile microarray results output utility tool was also implemented for easy and fast generation of input files for over 20 of the most widely used functional analysis software programs.
Conclusion:Coupled with a well-designed user interface, MicroarrayЯUS leverages cutting edge Bioconductor packages for researchers with no knowledge in R language. It also enables a more reliable and accurate microarray data analysis and expedites downstream functional analysis of microarray results.
Keywords:Microarray data analysis, Gene expression, Probe reannotation
Findings Background
Microarray technology has been widely used for global gene expression profiling. Based on the major public microarray data repositories such as NCBI GEO (http:// www.ncbi.nlm.nih.gov/geo/) and ArrayExpress (http:// www.ebi.ac.uk/arrayexpress/), the overwhelming majority of microarray studies were performed on Affymetrix Gen-eChips and Illumina BeadArrays, with human, mouse and
rat being the most common model organisms. Finding differentially expressed genes (DEG) under various experi-mental conditions is the primary goal of these studies.
With hundreds of published packages, the R-based stat-istical platform Bioconductor [1] is a major solution for microarray data analysis. However, the command-line driven Bioconductor and its packages may prove to be in-convenient to use for experienced users dealing with multiple-step analysis, and virtually inaccessible for users with no solid knowledge about R. Graphical user inter-faces (GUI) for Bioconductor packages have been devel-oped to enable biology researchers to use cutting-edge algorithms without the need of learning R, notably,
* Correspondence:[email protected] †Equal contributors
2
Bioinformatics Service Program, Norris Medical Library, University of Southern California, 2003 Zonal Ave, Los Angeles, CA 91007, USA Full list of author information is available at the end of the article
affylmGUI for Affymetrix data analysis [2] and oneChan-nelGUI for both Affymetrix and Illumina data analysis [3]. Web-based software such as WebArray [4] and CARMA-web [5] were also developed to offer GUI to Bioconductor packages. Many of these software have been actively expanded since their initial releases, but as more and more functionalities are added, they are increasingly cum-bersome to learn and use, especially for those who are mostly interested in differential expression analysis.
A shortfall common to all these software is that they generally do not systematically address the probe design problems associated with many microarray chips. The Affymetrix 3’IVT GeneChips have been the most popular platform for global gene expression analysis in the past decade. They consist of probe sets containing 11–20 pairs of 25mer probe targeting a gene or transcript. While designed with the most complete information available at the time, the tremendous progress in genome sequencing and annotation in recent years has rendered an increasing number of existing probe sets outdated. Several studies [6-8] indicated that a substantial percentage (30-70%) of Affymetrix probe sets contain at least one probe that is ei-ther non-unique, no-target, mis-targeted, or overlapping with known SNPs in the central region. Besides adding noise, these problematic probes also affect the accuracy of expression value estimation [9,10 and references therein]. Furthermore, these studies have also shown that the anno-tations of a significant portion of the probe sets are either outdated or incorrect based on the latest genomic know-ledge. The updated Affymetrix probe set annotation not only benefits our understanding of microarray results, but also improves the cross-platform reproducibility of micro-array experiments [11,12]. While the chip design philoso-phy is different from Affymetrix’s GeneChips, Illumina’s BeadArrays have similar problems in terms of problematic probes and outdated probe annotations [13,14].
Implementation
Written in R, Microarray Я US was a cleanly designed GUI specifically for users who have no knowledge in R. It provides a streamlined workflow for analyzing expres-sion microarray data (Figure 1). The program console consists of a top menu bar, as well as a Work Flow Log and a Task Status to allow users to easily perform and track the status of their data analysis (Figure 2). For in-formation on all the Bioconductor packages implemen-ted in this software as well as their publications, refer to Additional file 1. List of the implemented Bioconductor packages.
Results and discussion
Microarray Я US was developed to not only provide a simple and streamlined workflow to researchers who are mainly interested in a fast differential gene expression
analysis, but also to improve the accuracy and reliability of the analysis, as well as expedite downstream func-tional analysis of the microarray results. In addition to many carefully planned design characteristics aimed at enhancing its usability, Microarray Я US provides the following unique features:
Support custom chip description files (CDF) for major 3’IVT affymetrix GeneChips and probe re-annotation for major affymetrix GeneChips and illumina BeadArrays To enable researchers to take advantage of the latest re-search on probe set re-definition and re-annotation, we implemented the custom CDF and probe set re-annotation by Dai et al. (2005) and by Risueno et al.
(2010) for Affymetrix GeneChips and probe
re-annotation by Du et al. (2008) and Barbosa-Morais et al. (2009) for Illumina BeadArrays. To mitigate the undesir-able consequences that arose from the aforementioned microarray probe design problems, Dai et al. (2005) and Risueno et al. (2010) used the latest genome/transcrip-tome sequences to perform strict probe re-alignment and mapping and discarded 30-60% of the original Affymetrix probes that were problematic. The remaining probes were re-defined into new probe sets (in the form of custom CDF) and re-annotated with the latest gen-omic annotation. An independent evaluation of Dai et al.’s study concluded that the updated probe set defi-nitions resulted in significant improvement of both precision and accuracy of expression level analysis [15]. For Illumina arrays, Du et al. (2008) eliminated up to 30% of original probes without a unique and perfect match to a single Entrez gene by mapping probe sequences against the latest corresponding RefSeq sequences and re-annotated the remaining probes with the latest genomic annotations. Barbosa-Morais et al. (2009) also re-defined the probes against the latest gen-ome and transcriptgen-ome but used less strict rules for excluding uninformative probes.
To our knowledge, MicroarrayЯ US is the only micro-array software that implements multiple custom CDF (Affymetrix) and probe set/probe re-annotation (Affymetrix and Illumina) for a more reliable gene expression analysis.
Quick generation of input files for comprehensive functional analysis of microarray results
of multiple tools, as they differ in underlying statistical methods, annotation contents and analytical capabilities [16,17]. Different tools usually require different types/for-mat of input files, and manually converting microarray results into these files is a very laborious task. To expedite
comprehensive functional analysis, we implemented a results output utility tool that can instantly generate input files for some 20 of the most widely used commercial and open access functional analysis software (see Additional file 2. List of the supported functional analysis software).
Create Project
Import Download Public Data
Import Your Own Data
Preprocess and Annotation
Differential Expression Analysis
Limma SAM Rank Product
Time Course Data Analysis Power
Analysis
Heatmap
Venn Diagram Generate
Gene List
Output for Functional Profile Analysis
Select CDF for Affymetrix Data
Select Annotation Database for Illumina Data
Quality Control
[image:3.595.58.539.91.300.2]Data Exploring and Visualization
Figure 1Typical MicroarrayЯUS workflow.MicroarrayЯUS provides a streamlined workflow for a typical differential gene expression analysis task.
[image:3.595.54.538.415.695.2]To our knowledge, MicroarrayЯUS is the only microarray software that provides such time-saving functionality.
MicroarrayЯUS key functionalities
Data import
MicroarrayЯUS supports major 3’IVT Affymetrix Gen-eChips and Illumina BeadArrays for human, mouse and rat (see Additional file 3. List of the supported micro-array data types). In addition to user data, public data from GEO and ArrayExpress can be directly downloaded within the software via the implementation of GEOqu-ery,GEOmetadb, andArrayExpress.
Custom CDF and probe re-annotation selections
For Affymetrix GeneChips, users are given choices of the original manufacturer and custom CDF [6, 7, Brai-narray version 13], along with the corresponding probe set annotations. For Illumina BeadArrays, original manu-facturer annotation and two custom re-annotation [13,14] are available.
Data preprocessing
For Affymetrix data, Microarray Я US offers several commonly used algorithms as implemented in RMA, gcRMA, MAS5 and dChip packages. An advanced option is also provided to allow users to select methods for background correction, PM correction, normalization, and probe set summarization. For Illumina data, the software accepts preprocessed data
output from GenomeStudio and supports fully
customizable preprocessing with lumi package for
non-preprocessed data.
Quality control and exploratory analysis
For Affymetrix data, Microarray Я US implemented
ArrayQualityMetricsandQCreport. For Illumina data, the quality control method implemented in thelumipackage is supported.
For exploratory data analysis, MicroarrayЯUS supports both Principle Component Analysis and hierarchical clus-tering analysis via the implementation ofmade4andstats packages.
Differential expression analysis
Four widely used statistical packages are implemented, in-cluding Linear Model for Microarray Data (limma, with advanced options for multiple fixed and random factors), Significance Analysis of Microarrays (SAM, both paired and unpaired), Rank Product Test (RankProd), and maSigPro(time course data).
Power analysis
Power analysis on sample size and detection efficiency for p value or fold changes are supported in Microarray
ЯUS via the implementation ofssizepackage.
Results output
[image:4.595.57.538.481.696.2]With easy to follow dialog windows, users can out-put a full table of statistical results or DEG lists. Visualizations of DEG lists with heatmap or Venn
diagrams are also available via the implementation of gplots and limma packages.
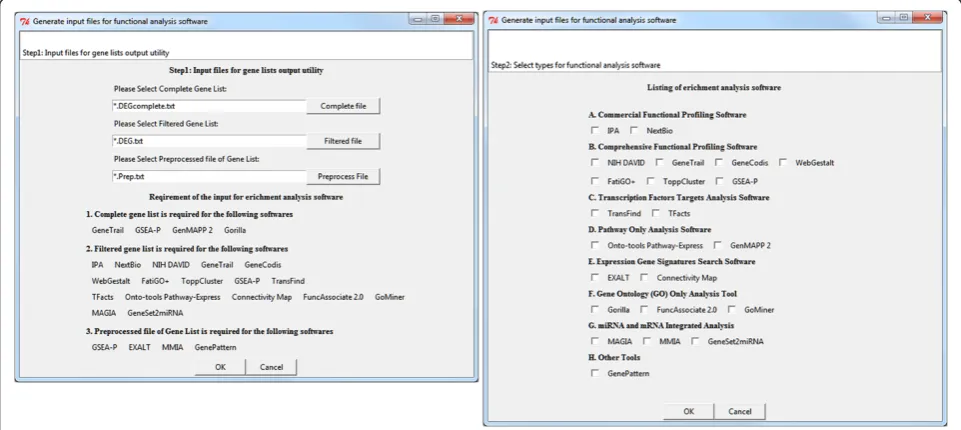
The Gene List Output Utility can be used to in-stantly convert microarray results into input files for
over 20 functional analysis software (Figure 3.
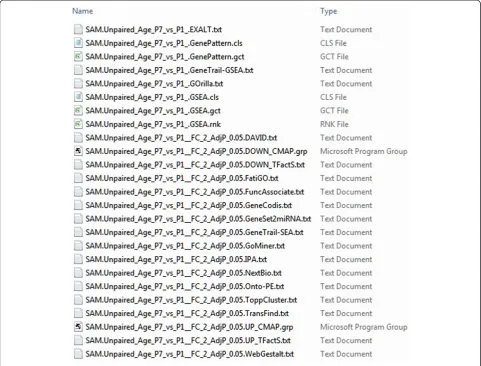
Screenshot of the dialog windows for generating in-put files for functional analysis tools). It can also be used for microarray results generated from third-party microarray software with minimal reformatting. A carefully-thought default file naming schema was implemented to allow users to easily locate output
files for each selected functional analysis tool
(Figure 4. Examples of output results files for down-stream functional analysis).
Conclusion
A GUI to over a dozen widely used Bioconductor packages with enhanced usability, Microarray Я US
provides a streamlined workflow for routine differential gene expression analysis based on Affymetrix and Illumina chips for users with no knowledge in R language. With its unique implementation of several up-to-date Affymetrix custom CDF and probe set re-annotations for both Affy-metrix and Illumina platforms, this tool facilitates a more accurate and precise microarray data analysis. The versa-tile results output utility tool enables a fast and easy gen-eration of input files for over 20 of the most popular functional analysis software programs.
Availability and requirements
MicroarrayЯ US is available for Windows (both 32 and 64 bit), Mac OS, and Linux/Unix under the Open GPL license at http://norris.usc.libguides.com/MicroarrayRUS (free registration required).
[image:5.595.57.539.90.456.2]Periodic update of the custom CDF will be made when the major revisions become available.
Additional files
Additional file 1:List of the implemented Bioconductor packages.
Complete list of the implemented Bioconductor packages with brief descriptions and references.
Additional file 2:List of the supported functional analysis software.
Description: Complete list of the supported functional analysis software for the Gene List Output Utility Tool. Access information, methods, input file requirements, supported organisms, matching MicroarrayЯUS output file, and other details are listed for each supported software.
Additional file 3:List of the supported microarray data types.
Complete list of the supported microarray chips.
Abbreviations
DEG: Differentially expressed genes; GUI: Graphical user interfaces; CDF: Chip description files.
Competing interests
The authors declare that they have no competing interests.
Authors’contribution
YC conceived the project, advised on software design and drafted the manuscript. YD and LG performed the designing, coding, and debugging. ML and LG prepared user documentation. ML carried out software testing, web publishing and manuscript preparation. All authors participated in manuscript revisions and have read and approved the final manuscript.
Acknowledgements
This work was partially supported by an internship grant from the Norris Medical Library, University of Southern California to Yilin Dai and Ling Guo. We thank Mr. Bill Clintworth for his strong support of this project as well as editorial assistance with the manuscript preparation.
Author details
1
Department of Mathematical Sciences, Michigan Technological University, 1400 Townsend Drive, Houghton MI 49934, USA.2Bioinformatics Service
Program, Norris Medical Library, University of Southern California, 2003 Zonal Ave, Los Angeles, CA 91007, USA.
Received: 6 February 2012 Accepted: 18 April 2012 Published: 8 June 2012
References
1. Gentleman RC, Carey VJ, Bates DM, Bolstad B, Dettling M, Dudoit S, Ellis B, Gautier L, Ge Y, Gentry J,et al:Bioconductor: open software development for computational biology and bioinformatics.Genome biology2004,5: R80.
2. Wettenhall JM, Simpson KM, Satterley K, Smyth GK:affylmGUI: a graphical user interface for linear modeling of single channel microarray data.
Bioinformatics2006,22:897–899.
3. Sanges R, Cordero F, Calogero RA:oneChannelGUI: a graphical interface to Bioconductor tools, designed for life scientists who are not familiar with R language.Bioinformatics2007,23:3406–3408.
4. Xia X, McClelland M, Wang Y:WebArray: an online platform for microarray data analysis.BMC Bioinformatics2005,6:306.
5. Rainer J, Sanchez-Cabo F, Stocker G, Sturn A, Trajanoski Z:CARMAweb: comprehensive R- and bioconductor-based web service for microarray data analysis.Nucleic Acids Res2006,34:W498–W503.
6. Risueno A, Fontanillo C, Dinger ME:De Las Rivas J: GATExplorer: genomic and transcriptomic explorer; mapping expression probes to gene loci, transcripts, exons and ncRNAs.BMC Bioinformatics2010,11:221. 7. Dai M, Wang P, Boyd AD, Kostov G, Athey B, Jones EG, Bunney WE, Myers
RM, Speed TP, Akil H,et al:Evolving gene/transcript definitions significantly alter the interpretation of GeneChip data.Nucleic Acids Res
2005,33:e175.
8. Ballester B, Johnson N, Proctor G, Flicek P:Consistent annotation of gene expression arrays.BMC Genomics2010,11:294.
9. Gautier L, Cope L, Bolstad BM, Irizarry RA:affy–analysis of Affymetrix GeneChip data at the probe level.Bioinformatics2004,20:307–315.
10. Nurtdinov RN, Vasiliev MO, Ershova AS, Lossev IS, Karyagina AS:
PLANdbAffy: probe-level annotation database for Affymetrix expression microarrays.Nucleic Acids Res2010,38:D726–D730.
11. Carter SL, Eklund AC, Mecham BH, Kohane IS, Szallasi Z:Redefinition of Affymetrix probe sets by sequence overlap with cDNA microarray probes reduces cross-platform inconsistencies in cancer-associated gene expression measurements.BMC Bioinformatics2005,6:107.
12. Elo LL, Lahti L, Skottman H, Kylaniemi M, Lahesmaa R, Aittokallio T: Integrating probe-level expression changes across generations of Affymetrix arrays.Nucleic Acids Res2005,33:e193.
13. Barbosa-Morais NL, Dunning MJ, Samarajiwa SA, Darot JF, Ritchie ME, Lynch AG, Tavare S:A re-annotation pipeline for Illumina BeadArrays: improving the interpretation of gene expression data.Nucleic Acids Research2010, 38:e17.
14. Du P, Kibbe WA, Lin SM:lumi: a pipeline for processing Illumina microarray.Bioinformatics2008,24:1547–1548.
15. Sandberg R, Larsson O:Improved precision and accuracy for microarrays using updated probe set definitions.BMC Bioinformatics2007,8:48. 16. Huang DW, Sherman BT, Lempicki RA:Bioinformatics enrichment tools:
paths toward the comprehensive functional analysis of large gene lists.
Nucleic Acids Research2009,37:1–13.
17. Nam D, Kim SY:Gene-set approach for expression pattern analysis.Brief Bioinform2008,9:189–197.
doi:10.1186/1756-0500-5-282
Cite this article as:Daiet al.:MicroarrayЯUS: a user-friendly graphical interface to Bioconductor tools that enables accurate microarray data analysis and expedites comprehensive functional analysis of microarray results.BMC Research Notes20125:282.
Submit your next manuscript to BioMed Central and take full advantage of:
• Convenient online submission
• Thorough peer review
• No space constraints or color figure charges
• Immediate publication on acceptance
• Inclusion in PubMed, CAS, Scopus and Google Scholar
• Research which is freely available for redistribution