R E S E A R C H A R T I C L E
Open Access
A review of data needed to parameterize a
dynamic model of measles in developing
countries
Emily K Szusz
1, Louis P Garrison
2, Chris T Bauch
1*Abstract
Background:Dynamic models of infection transmission can project future disease burden within a population. Few dynamic measles models have been developed for low-income countries, where measles disease burden is highest. Our objective was to review the literature on measles epidemiology in low-income countries, with a particular focus on data that are needed to parameterize dynamic models.
Methods:We included age-stratified case reporting and seroprevalence studies with fair to good sample sizes for mostly urban African and Indian populations. We emphasized studies conducted before widespread immunization. We summarized age-stratified attack rates and seroprevalence profiles across these populations. Using the study data, we fitted a“representative”seroprevalence profile for African and Indian settings. We also used a catalytic model to estimate the age-dependent force of infection for individual African and Indian studies where seroprevalence was surveyed. We used these data to quantify the effects of population density on the basic reproductive numberR0.
Results:The peak attack rate usually occurred at age 1 year in Africa, and 1 to 2 years in India, which is earlier than in developed countries before mass vaccination. Approximately 60% of children were seropositive for measles antibody by age 2 in Africa and India, according to the representative seroprevalence profiles. A statistically significant decline in the force of infection with age was found in 4 of 6 Indian seroprevalence studies, but not in 2 African studies. This implies that the classic threshold result describing the critical proportion immune (pc) required to eradicate an infectious disease,pc= 1-1/R0, may overestimate the required proportion immune to eradicate measles in some developing country populations. A possible, though not statistically significant, positive relation between population density andR0for various Indian and African populations was also found. These populations also showed a similar pattern of waning of maternal antibodies. Attack rates in rural Indian populations show little dependence on vaccine coverage or population density compared to urban Indian populations. EstimatedR0values varied widely across populations which has further implications for measles elimination. Conclusions:It is possible to develop a broadly informative dynamic model of measles transmission in low-income country settings based on existing literature, though it may be difficult to develop a model that is closely tailored to any given country. Greater efforts to collect data specific to low-income countries would aid in control efforts by allowing highly population-specific models to be developed.
* Correspondence: [email protected]
1Department of Mathematics and Statistics, University of Guelph, Guelph,
Canada
Background
Measles is a highly contagious disease, spreading espe-cially rapidly in populations that are dense and/or exhi-bit low immunity [1]. The main natural carrier for measles is humans (though it is possible for some pri-mates to acquire infection) [2], and there are no known long-term reservoirs for the virus [3]. Hence, an effec-tive method of prevention is prophylactic vaccination. Measles can be prevented by a relatively inexpensive and effective vaccine, and yet measles remains one of the leading causes of death in children [4]. Measles caused an estimated 242,000 deaths globally in 2006, 95% of them occurring in countries with high-level pov-erty and poor health infrastructure [5]. The severity of measles can range from mild symptoms to severe tion, but it is usually the complications following infec-tion that lead to death or disability [3,5]. Though vitamin A supplementation does not seem to have any impact on incidence, duration, or prevalence of infec-tious diseases [6], it has been shown numerous times to reduce the severity and thus mortality in infectious dis-eases–including measles and its complications–because of its necessary role in the immune system [2]. Conver-sely, there have been differing views as to whether or not improving the overall nutritional status of children would reduce the risk of mortality. Review papers by Aaby [7,8] and Singh et al ([9]) found little or no rela-tion between malnutrirela-tion and measles related deaths in Africa or India, respectively. However, though Aaby mentions vitamin A as a possible factor in measles related deaths, he says other causes of severe complica-tions may dominate over vitamin A deficiency [7]. Singh et al also recognized the significance of vitamin A but none of the papers included in their review explicitly took vitamin A supplementation into account.
A live attenuated measles vaccine has existed since the mid 1960s [3]. However, strong and coordinated global action to significantly reduce measles mortality did not occur until the launch of the Measles Initiative in 2001. Since then, measles deaths have been reduced by 68% worldwide and 91% in Africa [10]. Much of this reduc-tion has been achieved through Supplementary Immuni-zation Activities (SIAs), which are large-scale campaigns aimed at vaccinating all children under a certain age. In other cases, routine immunization (RI) is being improved either by increasing the coverage of the first dose of measles vaccine, or by introducing a second dose in countries where first-dose coverage is already relatively strong [11]. However, while coverage has reached high levels in many countries, it remains low and relatively stagnant in others. Moreover, the optimal timing of SIAs and the optimal criterion for introducing the second dose of routine vaccination are not known
because this depends partly on eventual measles inci-dence and measles disease burden under the various alternative vaccination strategies being considered. Hence, modelling exercises intended to project optimal vaccination“second opportunity”strategies in this set-ting may prove valuable.
Although future measles incidence and disease burden cannot be known precisely, they can be projected by use of a dynamic model. Dynamic models (e.g., age-struc-tured compartmental models) incorporate transmission mechanisms and thus can describe how incidence evolves due to changes in factors such as demography and vaccine coverage [12]. Dynamic models allow us to analyse the epidemiology of a disease within a popula-tion and experiment with various vaccinapopula-tion strategies
“in silico“ to determine which one would be optimal from a given perspective (e.g. public health, cost-effectiveness).
Ideally, dynamic models are parameterized with data that are specific to the study population. However, measles epidemiology can vary across populations, which in turn provide implications for how vaccination programmes should be designed [13]. In the 1960s, Morley et al recognized and documented important dif-ferences between the epidemiology of measles in devel-oping countries compared to measles in the UK and North America, since at least the 1920s [14]. Suggested reasons for this have included differences in living con-ditions, nutrition, demography (birth rate), and social/ cultural behavioural differences [14]. Because of this, models intended for developed countries are not neces-sarily applicable for developing countries [13]. For example, models developed by Babad et al [15] and Cvjetanovic et al [16] both assume the epidemiology of measles in England and Wales, with a mean age of infection in children of approximately 5 years. This has been thought to reflect the fact that children were rela-tively isolated from other children until the start of school. In contrast, developing countries have a much lower age at infection, as described by McLean et al [14], and specific social and cultural factors that may explain this have been identified [17], such as larger family sizes and greater mixing from a younger age.
epidemiology in low-income countries and compute a
“representative” age-stratified seroprevalence profile. We also use the data to quantify the effects of population density on transmissibility measures such as the basic reproductive number R0. Finally, we use a catalytic
model to compute age-dependent force of infection for individual populations where seroprevalence studies were available.
Methods
Age-stratified attack rates (i.e. the percent of individuals infected in each age group in a given outbreak or over a longer period of time) and seroprevalence are needed to determine susceptibility levels and transmission rates within a population. These measures can vary between rural and urban populations as well as between coun-tries, and over time in a given population. Ideally, one has sufficient data to allow analysis of each population individually; in practice, however, data availability can be limited for any given population [18]. Here, we summar-ize available data for a number of low-income countries to investigate whether there are any general trends that apply in most or all low-income countries.
The basic reproduction numberR0–the average
num-ber of secondary infections produced by an infected per-son in a totally susceptible population–is an important epidemiological measure that defines a threshold for whether an infectious disease can invade a population. When R0 is above 1, each infectious person can infect
more than one person in a totally susceptible popula-tion, and hence it is possible for the infectious disease to invade [19]. Conversely whenR0 is below 1, an
infec-tious disease cannot invade a totally susceptible popula-tion. R0 also plays a role in indicating how easily an
endemic infectious disease can be controlled and/or era-dicated [19].R0 is dependent on population density and
this dependence varies between countries [20]. In this paper, we attempt to determine this dependence for Africa and India.
In the following paragraphs, we describe (1) inclusion/ exclusion criteria for the literature we used in our analy-sis, (2) methods for extracting and summarizing age-stratified attack rates for Africa and India, (3) methods for extracting and summarizing age-stratified seropreva-lence for Africa and India, and (4) methods for comput-ing the dependence ofR0on population size.
Inclusion/Exclusion criteria
To identify relevant literature sources with useful data, Web of Science, Google Scholar, and PubMed were searched using terms including: “case report”, “case study”, “surveillance”, “epidemiology”, “ seroepidemiol-ogy”, “antibody”, “seroprevalence”, and variations on each term combined with the terms:“measles”,“Africa”
or“India”, and sometimes specific country names within Central or Eastern Africa such as“Nigeria”,“Niger”, and
“Uganda”. The reference section in each paper was checked and any papers that had referenced them were also researched. We focussed on identifying papers dated before the era of widespread vaccination in Africa and India, i.e., from the 1970s and early 1980s. This is because vaccination influences infection transmission in the population and hence can affect seroprevalence and attack rates [19]. (However, we note that methods do exist for adjusting for such effects). We included several more recent papers as well to analyze the changes in epidemiology as a result of vaccination.
Each source was classified into one of three types: (1) epidemic case reporting, (2) endemic case reporting, and (3) seroprevalence. Epidemic case reporting papers gen-erally describe the percent infected by age during a spe-cific measles outbreak. Conversely, endemic case reporting papers describe reported cases over a longer period of time, during and outside of outbreaks. Case report studies can suffer from under- or over-reporting due to misdiagnosis, unreported cases, or subclinical infection. Seroprevalence studies do not suffer from under/over-reporting subclinical infection, or misdiagno-sis and hence can prove very useful when trying to determine what proportion of the population remains susceptible. On the other hand, seroprevalence surveys do not always reflect long-term average conditions in a given population. For instance, a seroprevalence profile obtained just before an epidemic outbreak will differ from one obtained just after an outbreak, and this can influence estimates of the mean age at infection and the force of infection. This is especially a problem for smal-ler, isolated populations with long epidemic inter-vals. Moreover, seroprevalence studies cannot distinguish between immunity due to natural infection and immunity due to vaccination. We included seropre-valence publications that used a representative, ran-domly chosen sample set with a relatively large number of children in each age category being tested. We included case report publications that relied on national surveillance systems or representative community-based surveys.
only those with access to health care. Hence, these pub-lications were also excluded.
A common occurrence among Indian case report stu-dies was that the authors would report the number of cases in an age group but not give a breakdown by age of the surveyed population, making it impossible to cal-culate the attack rates (eg. [30-32]). In other publica-tions, children were surveyed regarding the age when they had measles infection, but it was unclear when the population per age group was tabulated, again making attack rates impossible to calculate (eg. [33-35]).
Reporting and construction of age-stratified attack rate and seroprevalence profiles
We summarized the age-stratified attack rates from most included studies through several figures. The attack rates were either taken directly from the study, when available for each year of age, or found by calcu-lating them from component data reported in the study. If the reported age group spanned more than one year, then the attack rate reported for the whole age group was also assumed to represent the attack rate for each individual year of age in that age group.
Similarly, from the seroprevalence studies, the percent of children seropositive for measles antibody was taken directly from the data, when available for each year of age. If the reported percent seropositive in an age group spanned more than one year, then the seropositive value was assumed to represent the percent seropositive of the midpoint age of the age group only.
To fit a “representative” seroprevalence profile, we first constructed an average profile from the surveys reviewed as follows. If only one of the reviewed studies reported seroprevalence at a given age, then that was used as the seroprevalence of the average profile at that age. If more than one reviewed study reported seropre-valence at a given age, then the average seropreseropre-valence of those studies–weighted by their sample size–was used as the seroprevalence of the average profile at that age according to the equation:
S s nij
Ni
i ij
j
(1)whereSiis the average seroprevalence in age classi,sij
is the seroprevalence in age class i from studyj, nij is
the number of samples in age classi of studyj, andNi
=Σjnij. Finally, if no reviewed study reported seropreva-lence at a given age, then the seroprevaseropreva-lence of the aver-age profile was not given for that aver-age. Below aver-age 1, averaged seroprevalence data points were sought for 3, 6, and 9 months (or as close to that as possible), and it was assumed that all newborns had maternal immunity.
Above and including age 1, averaged seroprevalence data points were sought for each year, although they were not always available, especially for some older ages where no included studies reported samples from that age.
This average seroprevalence profile was then fitted to the following equation to generate a“representative” or
“typical”age-stratified seroprevalence profile:
S a k
k
k a k a k a
( ) exp exp exp
1 1
2
2 2 1 2 1 3 (2)
whereS(a) is the percent seropositive in age a, andk1, k2 and k3 are constants. The last term exp(-k3a) in
Equation (2) describes an exponentially declining curve that captures the decline in seroprevalence attributable to maternal immunity in the first year of life. The rest of Equation (2) describes a curve that captures seropre-valence attributable to infection, wherek1 andk2control
how quickly seroprevalence increases with age and how high seroprevalence can become in the oldest age groups. For realistic values ofk1 andk2, one obtains an
S-shaped seroprevalence profile with an inflection point at young ages, that approaches 100% seroprevalence asymptotically. By dropping the maternal immunity term in Equation (2) one can also define the seropreva-lence attributable to infection as:
S a S a k a k
k
k a k a
inf( ) ( )exp( ) exp exp
3 1 1 2 2
22
1 1
. (3)
These equations were adapted from the approach described in Ref [36] and references therein. The values of k1, k2 andk3 that yielded the smallest ordinary least
squares error between S(a) and the average seropreva-lence profile were deemed optimal and used to con-struct the representative seroprevalence profile. The squared error at each age was weighted according to how many adjacent ages (+/- 1 year) had known average seroprevalence data points, to mitigate over-sampling of age ranges for which there were many available average seroprevalence values. Because Equation (2) accounts for decay of maternal antibodies, we can fit it to sero-prevalence data for all age categories, including those below 1 year of age. Although Equation (1) adjusts for variable sample sizes across studies within a given age class, we do not adjust for variable sample sizes across age classes when fitting Equation (2). We note that this introduces the potential for wayward estimates of prevalence to influence the best-fit representative sero-prevalence profile.
reports. Plots were also constructed from included stu-dies for age-stratified seroprevalence surveys for India and Africa. The representative seroprevalence profile from Equation (2) was included on the same plot.
Estimation of force of infection
To estimate the force of infection from the average ser-oprevalence profiles for Africa and India, we formulated several functions for an age-dependent force of infec-tion, modelled the seroprevalence profiles resulting from those functional forms, and fitted the resulting seropre-valence model to the average seropreseropre-valence profiles for India and Africa. A catalytic modelling approach adjust-ing for the presence of maternal antibodies allows us to relate the force of infectionl(a) at ageato seropreva-lence via:
( )
( ) ( )
a
S a d
da S a e k a
1 1
3 (4)
where k3is the maternal immunity component
emer-ging from Equation (2). Equation (4) can be discretized with respect to age, giving:
j k j
S j
S j S j
a k e
1
1 1
1
3 3
(5)
whereΔa is a (very small) age increment fromj-1 toj,
Sjis seroprevalence at agej, andljis the force of
infec-tion at agej. Equation (5) can be solved forSjyielding Sj Sj1a
j1Sj1 k e3 k j3
. (6)From Equation (6), the seroprevalence arising from any assumed force of infection can be derived. The four functional forms for the force of infection that were tested were:
( )a k1
constant
(7)( ) /
/
a k k a a k
a k
1 2 2
2
1 1
0 1 linear (8)
( )a k e1 k a2
exponential
(9)( ) inf ( )
( )
a k ae S a
S a k a
1 2
1
1 unimodal (10)
whereS(a) andSinf(a) in Equation (10) are taken from
Equations (2) and (3) according to the seroprevalence model of Ref [36].
Values ofk1,k2(where applicable), andk3were tested
with fine resolution across broad ranges and the sum-of-squares error between the seroprevalence computed from Equation (6) and the average seroprevalence pro-files for India and Africa was computed. The criterion for best fitting parameters was the minimization of sum-of-squares error. The model parsimony of the linear and exponential forms relative to the constant forms were analyzed via an F-test in order to test the hypothesis that the force of infection declines with age. A declining force of infection with age would indicate that the eradication equationpc= 1-1/R0overestimates the required
propor-tion immune for eradicapropor-tion in those populapropor-tions [19]. The F-ratio is the ratio of the increase in the sum-of-squares error (of the simpler model relative to the more complex model) to the increase in the degrees of freedom (of the more complex model relative to the simpler model). An F-ratio greater than 1 indicates that the more complex model may be parsimonious.
This method of computing the force of infection was repeated for each individual age-stratified seroprevalence profile from the included Indian and African studies, with the exceptions of Refs [37] and [38] in African populations, due to lack of data points below 1 year of age in those surveys. Hence, we computed force of infection for 6 studies in Indian populations and 2 stu-dies in African populations, for the exponential and con-stant functional forms.
Estimation ofR0and relation to population size
Studies have shown that R0 increases with increasing
population density, particularly via:
R0 KNc (6a)
where N is the total population, Kis a scaling con-stant, and 0 ≤ c≤ 1 is a constant that determines the impact of population density onR0 [20].
The relation betweenR0and population size was
deter-mined in both African and Indian populations using case reporting and seroprevalence data. In Africa, we esti-matedR0values for large cities or rural areas in 8
differ-ent countries, whereas in India,R0values were estimated
for 11 different urban or rural regions. In one African study, theR0value was estimated by averaging over a
sta-tistical description ofR0values reported directly by the
authors and so no further calculation was necessary. For all others, theR0value was estimated using the formula:
R G
A D
0 (7a)
within the population, andDis the average duration of maternal antibodies [14].D= 3.3 months was estimated from a study by Hartter et al [39]. G was estimated from demographic data made available in the study or, if not available in the study, from other various sources.
The mean age at infectionAwas calculated in two dif-ferent ways depending on what data were available in the study. Both methods assume that the populations have experienced no previous history of vaccination, which of course is only approximately true in most cases. Therefore, the following methods estimate the mean age at infection in a partially vaccinated popula-tion,A’. If the force of infection (l) was known through a pre-existing estimate,A’was estimated via [19]:
A’1/ . (8a)
Iflwas not given, thenA’was estimated via:
A
ri ai i
ri i
(9a)
whereriis the attack rate at ageai. We note that it is possible to underestimateA’using this formula if attack rates at higher ages are not given [14,18]. Each age was taken at the midpoint of the year (i.e. ai = 0.5 yr, 1.5
yrs, 2.5 yrs, etc). For case report studies, attack rates were determined as before. For seroprevalence studies, the attack rate at ageaiabove one year of age was
esti-mated as:
Sinf,i1Sinf,i (10a) whereSinf,iis the proportion seropositive at ageai. The
values ofSinf, iwere the best-fit values of Equation (3) to
the data from each individual study, above the age of 1. Since vaccination can increase the mean age at infec-tion, the values of A’ computed from a population where vaccination is occurring must be adjusted before Equation (7) can be applied. To adjust for vaccination, we used the following relation between the mean age at infectionA’with vaccination coverage and the mean age at infectionAwithout vaccination:
A A(1 p) (11a)
where pis the percent of the study population with vaccine derived immunity [19]. To find p, we first sought vaccination coverage data reported specifically for the populations studied. If this was not given,pwas found using the total vaccination coverage by country [40] for the study year and the number of years previous equal to the number of age groups sampled (if possible)
and averaged. We assumed a vaccine efficacy of 85% [41]. Thus pis just the product of the average vaccine coverage and vaccine efficacy. The resulting values ofA were used in Equation (7).
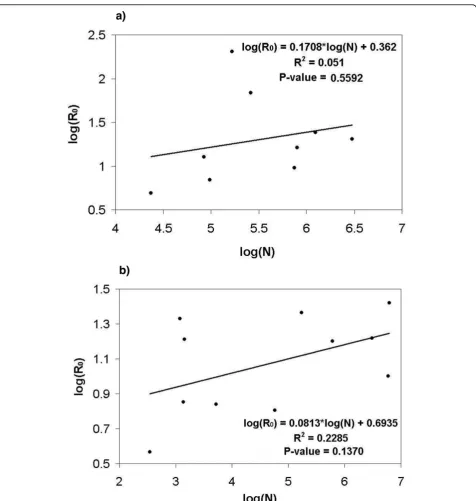
Thus, with estimated values ofR0for each population
sampled, and with the corresponding population sizeN, we fitted a linear regression to Equation (6), rescaled on a ln-ln plot, and used ordinary least squares criterion to obtain the best-fit values forcand K.
Results
Tables summarizing the studies that were included in the analysis are given in Additional Files 1, 2, 3 and 4. The first two files describe all included case reporting studies for Africa and India respectively, and the second two files describe all included seroprevalence studies for Africa and India respectively. For each country, the tables describe the population studied, the year of study, type of study, study objectives, major conclusions, and limitations. In the following paragraphs we describe the studies. The review of these studies is broken down by region (Indian versus African populations) and study type (case reporting versus seroprevalence). In the latter part of the Results we present the analysis of the depen-dence ofR0on population size.
Case report analysis: Africa
The age-stratified attack rates for African populations are summarized in Figure 1a (epidemic case reports) and 1b (endemic case reports). The age of peak attack rates is 1 year in almost all studies where sufficiently fine age stratification allows this observation to be made. As already noted, this is a much younger age than observed in the“developed”world before the advent of mass vac-cination in the middle 20thcentury [14,18].
The variation in epidemic patterns between and within countries can be due to a variety of factors including geographical location, crowding effects, availability of health care, and changing birth rates which would change the rate of recruitment of susceptible individuals [45]. And even though vaccine coverage may seem quite high (73% in Niamey, 1990), there may be a high vac-cine failure rate due to poor maintenance of the cold chain or because vaccinations were given to children already immune, or were given at the incorrect age [46].
Four endemic case reporting publications were also reviewed, three within an urban setting [46-48] and one in a rural setting [49]. In both the rural and urban set-tings, the highest attack rate was seen within the 6-11 month age group except in one study which reported the highest attack rate in children 9-23 months [47]. The papers by Guyer et al [46] and Heymann et al [47] combined describe the epidemiology of measles over a period of ten years within the city of Yaoundé, Camer-oon. Yaoundé experienced a continuous decline in
[image:7.595.57.542.90.434.2]attack rates in all age groups from 1972 to 1979, even though surveillance was increased in 1974 and then again in 1977. There was a large decrease in attack rates in the younger age groups, but also a smaller decrease in older age groups, suggesting a possible herd immu-nity effect. Heymann et al report constant vaccination coverage of roughly 40% over most of this time; consis-tent vaccine coverage may have led to the decline in attack rate. The discrepancy between the two papers for attack rates in 1975 could be due to how the authors estimated the population per age group. Taylor et al [48] reported on Kinshasa, Zaire (now known as the Democratic Republic of the Congo) several years after Heymann et al published their paper. The cumulative percent infected calculated from their data showed a slightly higher percentage in children less than 1 year but lower in all age groups above that. Though Kinshasa had a much higher population than Yaoundé, they had a continual increase in vaccination coverage from 1977 to 1983 which probably allowed for a decrease in attack
rate to those comparable to Yaoundé. However, Taylor et al explain that there was non-uniform vaccination throughout the city, which left pockets of susceptible individuals, allowing for continuing transmission despite overall high vaccine coverage. Furthermore, children under 9 months may have served as a reservoir for measles transmission because most were too young to be efficaciously vaccinated but had a high incidence rate. Although vaccinating at a younger age may suggest itself as a strategy to combat this, the vaccine is signifi-cantly less efficacious below 9 months of age due to interference from maternal antibodies, and vaccinating to sufficient levels in older age groups can provide herd immunity that protects younger age groups [43].
Case report analysis: India
Figure 1c (epidemic) and 1d (endemic) summarize the age-stratified attack rates for various Indian populations. From the studies that are stratified by year, the highest attack rate lies roughly between 1 and 2 years of age, which is slightly higher than that noted in the African populations but still lower than in developed countries in the mid-twentieth century. Furthermore, the most recent studies in each figure show that the peak attack rates have shifted to the older age groups. This may reflect changing demographics, social circumstances, or improving vaccine coverage.
Three endemic papers were analyzed for India. Garai et al [50] and Jain et al [51] both conducted commu-nity-based surveys in rural areas over a period of three years. Of the two, Jain et al indicated a distinctive lower cumulative % infected at every age up to age 14 yrs. Many factors could have influenced this, such as geo-graphic location or timing of epidemics, but because both studies spanned three years a more likely cause is a higher vaccination coverage seen in the population studied by Jain et al. Though vaccination coverage was not mentioned in either paper, we know that mass rou-tine immunization did not start until the mid 1980s so it is quite possible that Garai et al studied an almost vaccine free population while Jain et al were able to study a population with at least some vaccination. Bhas-karam et al [52] showed a higher cumulative % infected despite being conducted in between the previous two studies. However, their study was conducted in an urban slum and so crowding effects may have caused an increase in the number of children infected. Also, the study was conducted over a period of one year, so it is possible that it was an epidemic year.
We were able to find six outbreak papers for India [53-58], all within a rural setting with minimal or no vaccination at all, except Gupta et al [58]. There does not seem to be variation in the attack rates across vary-ing vaccination coverage levels or population sizes. This
is also seen in the paper by Narain et al [56] who sur-veyed 13 unvaccinated villages, where both large and small villages experienced high attack rates. Isolated populations can experience only intermittent but large outbreaks of measles that may be more difficult to pre-dict [59], so the apparent lack of clear dependence on vaccine coverage or population sizes may reflect lesser predictability of measles outbreaks in rural populations. In all papers except Gupta et al, the highest attack rate during the outbreak was in children below the age of 4 years. Gupta et al was the only paper to have an increas-ing percent infected by age group, the lowest beincreas-ing in children 0-4 years and the highest being in children 10-14 years.
Though Chand et al [60] was not included in the table, we felt it necessary to discuss as it does give over-all attack rates for children under 14 years of age and for the entire population of a representative village over a period of thirteen years. Before 1980, epidemics occurred every 2 years at varying levels of intensity, but after 1980, the inter-epidemic period lengthened to 3 years. This transition from outbreaks every 2 years to outbreaks every 3 years may reflect the introduction of vaccination [61]. It can also be seen that during the last 3 years of the study, the fluctuations in incidence rates becomes less dramatic. The authors suggest that these changes in the outbreak patterns of the disease were a result of the Measles Vaccination Programme.
Seroprevalence analysis: Africa
We identified five studies that give a reasonable to excellent age breakdown of seroprevalence in African populations; however we only included the three oldest in Figure 2a since they were likely to have limited vacci-nation coverage and thus reflect exposure to natural infection rather than immunization [62-64]. These three were thus used to estimate an average seroprevalence profile. The average seroprevalence profile computed from these studies indicates that about 60% of children exhibited seropositivity for measles antibody by the age of 2. Figure 2b shows the age-dependent force of infec-tion as computed from the representative seroprevalence profile in Figure 2a, using Equation (5).
show a high seropositivity by age 5 comparable to that reported by Enqusellassie et al [37]. This could be due to sampling location or the fact that their sample size was smaller than all the others. Unfortunately, vaccine coverage was not available in most studies, so we could not compare vaccine coverage to seroprevalence more systematically. All of these studies were in urban popu-lations, except for a district-wide survey in Busoga dis-trict, Uganda, which included rural populations [38]. As noted in the Methods section, seroprevalence profiles can be less representative of average conditions in cases where measles epidemiology is characterized by inter-mittent outbreaks, as might occur for some isolated rural populations.
Seroprevalence analysis: India
We identified 6 seroprevalence studies in Indian popula-tions [65-70], all conducted in an urban setting and
published in the 1970s or early 1980s (Figure 2c). Sero-prevalence increases less quickly with age than in the African studies, as seen in the modelled average seropre-valence curves. This suggests that the force of infection is higher at younger ages in African populations. How-ever, the lowest seroprevalence occurs at the age of 8 months in both India and Africa, demonstrating similar waning patterns of maternal antibodies. Because all these studies were in urban populations, the lack of representativeness of the seroprevalence profile that can be caused by intermittent outbreaks in small, isolated populations should not be an issue here (see Methods). Figure 2d shows the age-dependent force of infection as computed from the representative seroprevalence profile in Figure 2c, using Equation (5).
[image:9.595.57.541.89.441.2]Seroprevalence data do not usually distinguish between immunity from infection and immunity from vaccination but since mass routine vaccination did not
Figure 2Seroprevalence and force of infection by age. a) Representative seroprevalence profile for Africa. The parameters for the best-fit average seroprevalence profile arek1= 0.56,k2= 0.46 andk3= 2.64. b) Force of infection in Africa, computed from representative
start until the mid 1980s [40], the papers we have give us a good picture of how prevalent measles would be without vaccination, at least within an urban setting during those decades.
In almost all of the studies in Indian populations, roughly 80% of children are seropositive by age 6 years. The exception is Sehgal et al. [69], which incidentally had the highest sample size. In most papers, seropreva-lence could either increase or decrease from one age to the next. This could be evidence of a cohort effect [71,72], but is more likely a sample size effect. Interest-ingly, Sehgal et al was the only paper not to exhibit this effect, again perhaps because of its large sample size. Khare et al [70] report a lower seroprevalence in chil-dren under 9 months but a higher seroprevalence above 9 months, compared to other studies. This study is rela-tively recent and thus its higher seroprevalence at younger ages could reflect the initial effects of vaccina-tion. Vaccination also shifts incidence to older children due to herd immunity, which protects younger children from acquiring measles infection. From the seropreva-lence profile, we see that below the age of 8 months, the majority of the seroprevalence will be from maternal antibodies that continually decline. The rise again in ser-oprevalence after 8 months is then due to the acquisi-tion of measles infecacquisi-tion, or vaccinaacquisi-tion.
Estimation of force of infection
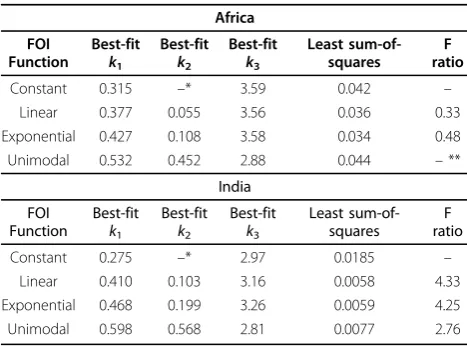
Table 1 gives the best-fitting parameter values for the four force of infection functions fitted to the average seroprevalence profiles for Africa and India. Also shown are the results of the F-test for comparing the exponen-tial and linear force of infection functions to the con-stant force of infection function. The minimum
sum-of-squares error is smaller under the exponential and linear functions (wherein the force of infection declines with age at best-fit parameters for both functions) than the constant function. Also, the F-ratios are larger than 1 for the linear and exponential functions for the Indian seroprevalence profile, implying that the linear and exponential functions with declining force of infection with age are more parsimonious (explain the data bet-ter) than the constant function where force of infection does not decline with age. These results imply that the force of infection may decline with age in Indian popu-lations of this time period. F-ratios for the African sero-prevalence profile are smaller than 1, hence there is not strong evidence for a declining force of infection in the surveyed African populations of that time. The best-fit-ting force of infection functions for both African and Indian seroprevalence profiles appear in Figure 2b, d.
Table 2 gives the results of the F-test for the 8 indivi-dual seroprevalence surveys, for comparing the expo-nential function to the constant function only. The F-ratio is greater than 1 in 5 of the 6 Indian seropreva-lence surveys, but the F-ratio is less than 1 in both of the 2 African seroprevalence surveys. This again sug-gests that the force of infection declines with age in these Indian populations at the time of the survey.
The unimodal force of infection predicts an increase in the force of infection with age, followed by a decrease. We note that the eradication equationpc=
1-1/R0 overestimates the critical proportion of immune
[image:10.595.56.290.531.704.2]only if the force of infection declines beyond the mean age at infection. For the exponential and linear functions which decline monotonically with age, this condition is automatically satisfied. However, for the unimodal func-tion, it is only satisfied if the mean age at infection exceeds the age of peak force of infection. At the best-fit parameter values for the unimodal function for the 6 Indian and 2 African seroprevalence surveys of Table 2, this condition is always satisfied (results not shown).
Table 1 Fit of seroprevalence data to seroprevalence model under different force of infection (FOI) functions
Africa
FOI Function
Best-fit k1
Best-fit k2
Best-fit k3
Least sum-of-squares
F ratio
Constant 0.315 –* 3.59 0.042 –
Linear 0.377 0.055 3.56 0.036 0.33
Exponential 0.427 0.108 3.58 0.034 0.48
Unimodal 0.532 0.452 2.88 0.044 –**
India
FOI Function
Best-fit k1
Best-fit k2
Best-fit k3
Least sum-of-squares
F ratio
Constant 0.275 –* 2.97 0.0185 –
Linear 0.410 0.103 3.16 0.0058 4.33
Exponential 0.468 0.199 3.26 0.0059 4.25
Unimodal 0.598 0.568 2.81 0.0077 2.76
*No k2parameter in function.
[image:10.595.306.539.618.730.2]** An F ratio was not computed because least sum-of-squares was greater than the constant case.
Table 2 F test results from individual seroprevalence studies for exponential versus constant force of infection function
Study City F ratio
Mehta et al 1972 [65] Bombay, India 0
John and Jesudoss 1973 [66] Vellore, India 2.44
Broor et al 1976 [67] Chandigarh, India 3.86
Bhau et al 1979 [68] Pondicherry, India 2.62
Sehgal et al 1983 [69] Delhi/Alwar, India 0
Khare et al 1987 [70] Delhi, India 1.25
Stanfield and Bracken 1971 [62] Kampala, Uganda 0.46
R0estimates: Africa
The following populations in Africa were used to deter-mine the relationship betweenR0 and population size:
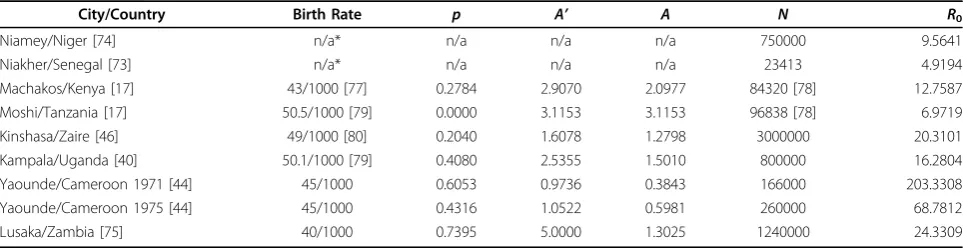
Niakher (Senegal, 1983-2001) [73], Niamey (Niger, 2003-2004) [74], Machakos (Kenya, 1984) [17], Moshi (Tanzania, 1984) [17], Kinshasa (Zaire, 1983) [48], Kam-pala (Uganda, 1990) [42], Yaoundé (Cameroon, 1971, 1975) [46], and Lusaka (Zambia, 1996-1999) [75].
Data required to calculateR0are summarized in Table 3
and a log-log plot ofR0 versusNis given in Figure 3a
whose slope is the constantcin Equation (6). The first two studies were the only two to provideR0estimates in
the publication or estimates of the mean age at infection. TheR0= 9.6 value for Niamey was found by averaging
over allR0values reported for various districts of the city.
For Niakher, Broutin et al reported a mean age at infection (with no vaccination coverage) of 4.6 years and a per capita birth rate of 47/1000 giving anR0value of 4.9. (The
authors also estimatedR0but did not adjust for maternal
immunity).
Equation (8) was used to find A’in Machakos, Moshi and Lusaka, and Equation (9) was used for the rest of the studies. Seroprevalence studies were not included due to the relatively few studies with sufficiently good age stratification to allow computation of A. The study by Enquselassie et al [37] was also not included because their data incorporated a high proportion of vaccinated individuals in all age groups. The recommended age for vaccination is 9 months and so vaccinated populations have a very high seropositivity rate from a very young age which would misrepresent the actual seroprevalence due to natural infection. Birth rates were reported in the studies for Yaoundé and Lusaka, but for the most part, birth rates were found from various other sources. Vac-cination coverage for each study population was reported in all papers except Taylor et al and Scott et al. For those two studies, estimates from the World Health Organization (WHO) website were used to cal-culate p. R0 values were calculated and reported in
Table 3. The unusually high value of R0 for Yaoundé,
Cameroon, 1971, may reflect the fact that only cases below the age of 3 were reported (though these consti-tuted 90% of all cases, according to the authors). The best fit value of a linear regression to a plot of log(R0)
versus log(N) yieldedc= 0.1708, theR2 value was 0.051, and the P < 0.6. This P-value suggests that it is more likely that there is no relation between population and
R0; however, we sampled over many different African
countries so it is possible that this relation would be stronger within individual countries.
R0estimates: India
We estimatedR0values for 11 different regions in India:
Sathuvachari village (Tamil Nadu, 1969) [53], Ramgarh village (Rajasthan, 1986-1988) [51], Hyderbad city (Andhra Pradesh, 1982-1983) [52], Hooghly District (West Bengal, 1976-1978) [50], 13 villages of Tehri Garhwal (Uttar Pradesh, 1986) [56], Dumehar village (Himachal Pradesh, 2004) [58], Barbadi (Maharashtra, 1982) [54], Bombay (Maharashtra, 1972) [65], Vellore (Tamil Nadu, 1973) [66], Pondicherry (Puducherry, 1979) [68], and Delhi (1984-1985) [70].
The key values needed to determine R0 values are
summarized in Table 4 and Figure 3b gives the log-log plot of R0 versus N. For every study population,
Equa-tion (9) was used to determine the mean age at infecEqua-tion with vaccination. Equation (11) was then applied to find
[image:11.595.57.539.598.722.2]A. The first 7 studies were case report studies and so the mean age at infection was calculated directly from the attack rates. The last 4 were seroprevalence studies so Equation (3) was used first to fit the data to ensure non-negative attack rates. Birth rates were obtained through correspondence with a member of the Popula-tion Reference Bureau. The birth rates were given by state and so it was assumed these birth rates accurately represented the birth rates for each village or city stu-died. The duration of immunity due to maternal antibo-dies was assumed to be the same as that in Africa. This was justified earlier in the analysis of seroprevalence in India where it was noted that both India and Africa
Table 3 Summary of key values needed to determineR0values for Africa
City/Country Birth Rate p A’ A N R0
Niamey/Niger [74] n/a* n/a n/a n/a 750000 9.5641
Niakher/Senegal [73] n/a* n/a n/a n/a 23413 4.9194
Machakos/Kenya [17] 43/1000 [77] 0.2784 2.9070 2.0977 84320 [78] 12.7587
Moshi/Tanzania [17] 50.5/1000 [79] 0.0000 3.1153 3.1153 96838 [78] 6.9719
Kinshasa/Zaire [46] 49/1000 [80] 0.2040 1.6078 1.2798 3000000 20.3101
Kampala/Uganda [40] 50.1/1000 [79] 0.4080 2.5355 1.5010 800000 16.2804
Yaounde/Cameroon 1971 [44] 45/1000 0.6053 0.9736 0.3843 166000 203.3308
Yaounde/Cameroon 1975 [44] 45/1000 0.4316 1.0522 0.5981 260000 68.7812
Lusaka/Zambia [75] 40/1000 0.7395 5.0000 1.3025 1240000 24.3309
have similar waning patterns of maternal antibodies. Only 3 out of the 11 studies reported vaccination cover-age. For all others it was either assumed that there was no vaccination coverage due to the timing of the study or it was specifically stated in the paper. Populations were either given in the study or found from websites as close to the time of the study as possible. The resulting best-fit value ofcwas 0.0813, theR2value was 0.2285, and the P
< 0.14. This P-value is lower than that for Africa, suggest-ing that it is likely that the relationship betweenR0and
population is stronger within a country [20], despite the heterogeneity in conditions across Indian states.
Discussion
[image:12.595.61.538.85.587.2]Although the quality of data for low-income countries varies widely, as do epidemiological patterns, several
Figure 3Plot of log(R0) versus log(N) to determine the value ofc. a) Linear regression for Africa. R
2
broad trends emerge from this literature review and analysis. Firstly, this review confirms previous findings that the mean age of infection and age of peak attack rate, are significantly lower in African and Indian popu-lations than was common in Western countries before the advent of mass vaccination [14,18]. This kind of information can be used to parameterize dynamic mod-els for low-income countries, and suggests that some interesting differences may emerge between model pro-jections for Western countries and those for low income countries.
A classical result of epidemiological theory is that the critical proportion immune required to eradicate an infectious disease equals 1 - 1/R0. For populations where
the force of infection declines with age, this is an over-estimate of the critical threshold required to eradicate a disease, because it assumes homogeneous mixing across ages [19]. Intuitively, this effect occurs because vaccina-tion increases the mean age at infecvaccina-tion, so if the force of infection decreases with age, the impact of vaccina-tion is multiplied as vaccinavaccina-tion pushes infecvaccina-tion events to older ages where the force of infection is lower [19]. The results of Tables 1 and 2 suggest that the eradica-tion equaeradica-tionpc= 1-1/R0 may overestimate the
propor-tion of individuals that need to be vaccinated in order to eradicate measles in at least some populations low-income countries. This issue may not be important for models of measles in developed Western populations, where the force of infection climbs, peaks between ages 5 and 15, and then declines, making it difficult to know
a priorithe direction of bias introduced by using the equation pc = 1 - 1/R0. However, we also note that
other aspects of real populations, such as spatial and social heterogeneity, could conceivably make measles eradication more difficult than suggested by either age-structured or homogeneous compartmental models.
As vaccination decreases transmission and thereby increases the mean age at infection, transmission dynamics in older age classes can become an important factor in determining the effectiveness of immunization programmes. Because of this, reliable data on seropreva-lence in older age classes is needed to accurately esti-mate force of infection in these classes. However, obtaining such reliable data can be difficult because the vast majority of individuals are infected at a young age, which introduces sample size issues for inferring force of infection at older ages. In these cases, quality of the data becomes more important. However some assays may have poor sensitivity which could lead to undermating seroprevalence. If the force of infection is esti-mated using insufficient or poor quality data in older age classes, and is used to parameterize the age-specific transmission rates of an age-structured compartmental model [19], there is a significant possibility of erroneous predictions.
This literature review producedR0 estimates that vary
widely across various populations, from 4 to 26. Although the data upon which these estimates are based are generally limited in quality, estimates from other populations for which better data are available also indi-cate significant variability inR0 estimates for measles
[19], and so this outcome is not unexpected.
The attack rates in African populations studied peak at age 1 for both rural and urban areas, although studies from later years when vaccination coverage is higher tend to indicate later peaks. According to the average seroprevalence profile estimated with a model from populations with little or no vaccination, roughly 60% of children are seropositive by age 2.
[image:13.595.57.546.99.247.2]In the Indian populations studied, the attack rates peak between 1 and 2 years, which is somewhat higher than for African populations studied. Newer studies also
Table 4 Summary of key values needed to determineR0values for India
City/Region Birth Rate p A’ A N R0
Sathuvachari [51] 31.4* 0.2010 2.2401 1.7898 1200 21.4339
Ramgarh [49] 36.2 0.0468 4.4506 4.2426 5258 6.9243
Hyderbad [50] 30.8 0 2.2401 2.2401 3,043,896 [78] 16.5221
Hooghly District [48] 35.2** 0 4.7190 4.7190 57267 6.3927
Tehri Garhwal [54] 37.5 0 7.4924 7.4924 349 3.6948
Dumehar village [56] 19.2 0.2870 10.6615 7.6017 1360 7.1087
Barbadi [52] 29.8 0 2.3353 2.3353 1434 16.2875
Bombay [65] 32.2 0 3.3733 3.3733 5,970,575 [81] 10.0237
Vellore [66] 30.0 0 1.7155 1.7155 171157 [78] 23.1407
Pondicherry [68] 29.0 0 2.4465 2.4465 604,471 [78] 15.8800
Delhi [70] 31.0 0 1.5001 1.5001 6,220,406 [78] 26.3316
*birth rate was listed for 1971, study was done in 1969 **value was extrapolated from graph of birth rate vs. year
indicate a shift in high attack rates to older children. The average seroprevalence profile calculated for India also shows that roughly 55% of children are seropositive by age 2, which is slightly lower than for the average African seroprevalence. Hence, both case reporting and seroprevalence surveys suggest a lower force of infection in most Indian populations than in most African popu-lations of the time.
A distinct difference in epidemiological patterns between rural and urban areas also emerged in this review. The studies in rural areas are more highly vari-able in terms of attack rates, often with no obvious dependence on population size or vaccination coverage. This is consistent with the projections of dynamic measles transmission models that exhibit highly variable, apparently unpredictable outbreaks in small isolated populations, but relatively more regular patterns in dense urban populations [59].
Though case report studies are relatively easy to carry out and can give a general picture of the epidemiology of measles, they also exhibit several general weaknesses. For instance, Munube et al [38] point out that many people believe measles can be acquired more than once in a lifetime. This belief stems mainly from the fact that young children are more prone to diseases with similar symptoms to measles, resulting in misdiagnosis in stu-dies relying upon self report. (This can also mean that children are likely to go unvaccinated because it appears that natural infection cannot cause permanent immu-nity). This concern has also been discussed in a paper by DeFrancisco et al who conducted a study in rural Bangladesh [76]. They explain that over-reporting is quite common because parents or guardians misdiag-nose their child’s disease. Conversely, the Indian studies we reviewed usually exhibited better reliability of case reports: Mehta et al [65] and Khare et al [70] both show a strong correlation between positive history of measles and seropositivity of measles antibody; however, Khare et al also note that roughly half of those with a negative history of measles are also seropositive. They speculate that this is likely due to subclinical infection as well as misdiagnosis but they also did not rule out the possibi-lity of lingering maternal antibody effects in young chil-dren. Thus, seroprevalence studies are a very useful tool when developing a model of measles transmission since misdiagnosis and subclinical infection are not proble-matic. However, seroprevalence studies are generally not longitudinal, and only give a snapshot of seroprevalence at a given point in time.
A problem in many of the case report papers for both Africa and India was that cases were only reported in very young children in the older papers. In more recent papers, a fine age breakdown was not provided: this may reflect sample size issues, as measles tends to be more
rare in more recent times, and case numbers tend to be smaller in rural populations (as was the case in many Indian studies). This caused difficulty in trying to dis-cern any patterns or trends. Attack rates in older chil-dren are needed to accurately parameterize the force of infection in older children and thus more accurately describe herd immunity effects. Thus there is a need for studies that sample a larger population and at larger and finer age ranges.
For African populations, patterns in seroprevalence were difficult to determine due to the lack of available seroprevalence studies done in Africa. A caveat that appeared several times in the seroprevalence studies for both Africa and India was that not enough children were sampled in one or more age groups, giving an inaccurate view of seroprevalence within an age group. Another problem encountered in some African papers was that the percent seropositive would be given in an age group that spanned more than one age and so it was necessary to assume that the percent seropositive applied to the midpoint of the age range. This limited the number of samples that could be used to calculate the average seroprevalence in an age group. Finally, there was variation among the tests for antibody as to what level was considered positive for protective levels of antibody. Some studies reported the number of indi-viduals exhibiting protective levels of antibody whereas others reported the number of individuals exhibiting any antibody; this clearly influences how exposure to the infection is inferred from reported percent seropositive at a given threshold.
Though the calculations for R0 for both India and
Africa yielded values for the overcrowding exponent c that are similar to values found in population centres in England and Wales [20], their R2 values and P-values suggest that the observed relation is not statistically sig-nificant. The large scatter observed in the plots may reflect unknown vaccination status in many children, limited data, lack of seroprevalence studies in Africa, and greater heterogeneity in populations included in the regression as compared to the relative homogeneity of populations across England and Wales.
Conclusions
countries, and there is a need for more accurate epide-miological data in low-income countries. We were not able to show a statistically significant relationship between population density and the basic reproductive ratioR0, however, this may reflect other heterogeneities
due to the broad sampling of populations used in the analysis. Finally, estimation of force of infection func-tions from age-stratified seroprevalence data suggest that the force of infection may decline monotonically with age in those populations, meaning that the eradica-tion equaeradica-tionpc= 1-1/R0 may overestimate the required
proportion of immune individuals for measles to be era-dicated in those populations.
Additional file 1: Reviewed case report studies for various countries in Africa. This file contains a table that summarizes all included case report studies for Africa.
Click here for file
[ http://www.biomedcentral.com/content/supplementary/1756-0500-3-75-S1.DOC ]
Additional file 2: Reviewed case report studies for various rural and urban areas in India. This file contains a table that summarizes all included case report studies for India.
Click here for file
[ http://www.biomedcentral.com/content/supplementary/1756-0500-3-75-S2.DOC ]
Additional file 3: Reviewed seroprevalence studies for various African cities. This file contains a table that summarizes all included seroprevalence studies for Africa.
Click here for file
[ http://www.biomedcentral.com/content/supplementary/1756-0500-3-75-S3.DOC ]
Additional file 4: Reviewed seroprevalence papers for various rural areas in India. This file contains a table that summarizes all included seroprevalence studies for India.
Click here for file
[ http://www.biomedcentral.com/content/supplementary/1756-0500-3-75-S4.DOC ]
Acknowledgements
The authors are grateful to reviewers James Nokes and Raffaele Vardavas for constructive comments, to Carl Haub and Conrad Taeuber for
correspondence, and to our program officer Girindre Beeharry and colleagues at the Bill & Melinda Gates foundation for support and feedback. This research was supported by the Bill & Melinda Gates Foundation and the University of Washington.
Author details
1Department of Mathematics and Statistics, University of Guelph, Guelph,
Canada.2Department of Pharmacy, University of Washington, Seattle, Washington, USA.
Authors’contributions
EKS wrote the manuscript, conducted the literature review, and conducted part of the data analysis. LPG contributed to the study design and revised the manuscript. CTB conceived of and designed the study, conducted part of the data analysis, and revised the manuscript. All authors have read and approved the final manuscript.
Authors’informations
EKS was an undergraduate research assistant at the time of writing. The manuscript co-authors are developing a model of measles transmission and vaccination in low-income countries.
Competing interests
The authors declare that they have no competing interests.
Received: 9 February 2010 Accepted: 16 March 2010 Published: 16 March 2010
References
1. Clements CJ, Strassburg M, Cutts FT, Torel C:The epidemiology of measles.World Health Stat Q1992,45:285-291.
2. Semba RD:Vitamin A and immunity to viral, bacterial and protozoan infections.P Nutr Soc1999,58:719-727.
3. Markowitz LE, Orenstein WA:Measles Vaccines.Pediatr Clin N Am1990,
37:603-625.
4. Strebel P, Cochi S, Grabowsky M, Bilous J, Hersh BS, Okowo-Bele JM, Hoekstra E, Wright P, Katz S:The Unfinished Measles Immunization Agenda.J Infect Dis2003,187:S1-S7.
5. World Health Organization:Measles, Fact sheet No. 286.http://www.who. int/mediacentre/factsheets/fs286/en/.
6. Beaton GH, Martorell R, L’Abbé KA, Edmonston B, McCabe G, Ross AC, Harvey B:Effectiveness of Vitamin A Supplementation in the Control of Young Child Morbidity and Mortality in Developing Countries.http:// www.unsystem.org/scn/archives/scnnews09/ch4.htm., Accession date 26 August 2008.
7. Aaby P:Malnutrition and Overcrowding/Intensive Exposure in Severe Measles Infection: Review of Community Studies.Rev Infect Dis1988,
10:478-491.
8. Aaby P:Determinants of measles mortality: host or transmission factors?
Medical VirologyNew York: Plenum Pressde la Maza LM, Peterson EM 1991,
10:83-116.
9. Singh J, Sharma RS, Verghese T:Measles Mortality in India: A Review of Community Based Studies.J Comm Dis1994,26:203-214.
10. Measles Initiative:The Solution.http://www.measlesinitiative.org, Accession date 26 August 2008.
11. Global Alliance for Vaccines and Immunization:Investment Case for Measles Mortality Reduction (II): Update for GAVI Board.15th GAVI Board Meeting: 28-29 April 2005; Geneva, Switzerlandhttp://www.gavialliance.org/ resources/15brd_MICupdate.pdf, Accession date 26 August 2008. 12. Hethcote HW:The Mathematics of Infectious Diseases.SIAM Rev2000,
42:599-653.
13. Nokes DJ, McLean AR, Anderson RM, Grabowsky M:Measles immunization strategies for countries with high transmission rates: interim guidelines predicted using a mathematical model.Int J Epidemiol1990,19:704-710. 14. McLean AR, Anderson RM:Measles in developing countries Part I:
Epidemiological parameters and patterns.Epidem Inf1988,100:111-133. 15. Babad HR, Nokes DJ, Gay NJ, Miller E, Morgan-Capner P, Anderson RM:
Predicting the impact of measles vaccination in England and Wales: model validation and analysis of policy options.Epidemiol Infect1995,
114:319-344.
16. Cvjetanovic B, Grab B, Dixon H:Epidemiological models of poliomyelitis and measles and their application in the planning of immunization programmes.Bull World Health Organ1982,60:405-422.
17. Remme J, Mandara MP, Leeuwenburg J:The Force of Measles Infection in East Africa.Int J Epidemiol1984,13:332-339.
18. McLean AR, Anderson RM:Measles in developing countries Part II: The predicted impact of mass vaccination.Epidem Inf1988,100:419-442. 19. Anderson RM, May RM:Infectious Diseases of HumansNew York: Oxford
University Press Inc 1991.
20. Anderson RM, May RM:Population Biology of Infectious DiseasesNew York: Springer 1982.
21. Dabis F, Sow A, Waldman RJ, Bikakouri P, Senga J, Madzou G, Jones TS:The Epidemiology of Measles in a Partially Vaccinated Population in an African City: Implications for Immunization Programs.Am J Epidemiol
1988,127:171-178.
22. Tayil SE, El-Shazly MK, El-Amrawy SM, Ghouneim FM, Abou Khatwa SA, Masoud GM:Sero-epidemiological study of measles after 15 years of compulsory vaccination in Alexandria, Egypt.Eastern Mediterranean Health Journal1998,4:437-447.
23. Williams PJ, Hull HF:Status of Measles in the Gambia, 1981.Rev Infect Dis
1983,5:391-394.
25. Nigatu W, Nokes DJ, Cohen BJ, Brown DWG, Vyse AJ:Pre- and post-vaccine measles antibody status in infants using serum and oral-fluid testing: an evaluation of routine immunization in Addis Ababa, Ethiopia.
Ethiop J Health Dev2003,17:148-155.
26. Eghafona NO, Ahmad AA, Odama LE, Onuora C, Gosham LT, Emejuaiwe SO, Woghiren EI:The levels of measles antibodies in Nigerian children aged 0-12 months and its relationship with maternal parity.Epidem Inf1987,
99:547-550.
27. Opaleye OO, Adewumi MO, Donbraye E, Bakarey AS, Odaibo GN, Olaleye OD:
Prevalence of Measles Neutralizing Antibody in Children Under 15 Years in Southwestern Nigeria.Afr J Clin Exper Microbiol2005,6:60-63. 28. Oyefolu AO, Omilabu SA, Durosinmi AT, Ajose AO, Akinyemi KO, Koko AO:
Levels of Measles HI-antibody In Unvaccinated Children In Lagos Island Local Government Area Of Lagos State, Nigeria.Journal of the Nigerian Infection Control Association1999,2:31-34.
29. Tapia MD, Sow SO, Medina-Moreno S, Lim Y, Pasetti MF, Kotloff K, Levine MM:A Serosurvey to Identify the Window of Vulnerability to Wild-Type Measles Among Infants in Rural Mali.Am J Trop Med Hyg2005,
73:26-31.
30. Siddiqi N, Ghosh S, Berry AM:The Natural History of Measles in a Low-income Urban Community in South Delhi.Indian Pediatr1974,11:557-562. 31. Bhardwaj AK, Swami HM, Gupta BP, Saha SM, Ahluwalia SK, Vaidya NK:
Sero-epidemiological Survey of Measles in a Tribal District of Himachal Pradesh.J Com Dis1988,20:316-320.
32. Sinha DP:Measles and Malnutrition in a West Bengal Village.Trop Geogr Med1977,29:125-134.
33. Shah U, Banerji KL, Nanavati AND, Mehta NA:A test survey of measles in a rural community in India.Bull World Health Organ1972,42:130-138. 34. Phaneendra Rao RS, Kumari J, Krishna Rao TS, Narasimham VL:Measles in a
Rural Community.J Com Dis1988,20:131-135.
35. Kandpal SD, Negi KS, Khan Z, Malik A:Measles Antibody Status Amongst Nine Months Five Years Unvaccinated Children.Indian J Prev Soc Med
2003,34:8-16.
36. Amaku M, Coutinho FAB, Azevedo RS, Burattini MN, Lopez LF, Massad E:
Vaccination against rubella: Analysis of the temporal evolution of the age-dependent force of infection and the effects of different contact patterns.Phys Rev E Stat Nonlin Soft Matter Phys2003,67:1-11.
37. Enquselassie F, Ayele W, Dejene A, Messele T, Abebe A, Cutts FT, Nokes DJ:
Seroepidemiology of measles in Addis Ababa, Ethiopia: implications for control through vaccination.Epidemiol Infect2003,130:507-519. 38. Munube GMR:Measles sero-immunity in rural non-vaccinated children of
Busoga District, Uganda.East Afr Med J1979,56:335-338.
39. Hartter HK, Oyedele OI, Dietz K, Kreis S, Hoffman JP, Muller CP:Placental transfer and decay of maternally acquired antimeasles antibodies in Nigerian children.Pediatr Infect Dis J2000,19:635-641.
40. World Health Organization:WHO-UNICEF estimates of MCV coverage.
http://www.who.int/immunization_monitoring/en/globalsummary/ timeseries/tswucoveragemcv.htm, Accession date 26 August 2008. 41. Samb B, Aaby P, Whittle H, Seck AWC, Simondon F:Protective efficacy of
high-titre measles vaccines administered from the age of five months: a community study in rural Senegal.T Roy Soc Trop Med H1993,
87:697-701.
42. Weeks RM, Barenzi JFZ, Wayira JRM:A low-cost, community-based measles outbreak investigation with follow-up action.Bull World Health Organ1992,70:317-321.
43. Malfait P, Jataou IM, Jollet MC, Margot A, De Benoist AC, Moren A:Measles epidemic in the urban community of Niamey: transmission patterns, vaccine efficacy and immunization strategies, Niger, 1990 to 1991.
Pediatr Infect Dis J1994,13:38-45.
44. Grais RF, Dubray C, Gerstl S, Guthmann JP, Djibo A, Nargaye KD, Doker J, Alberti KP, Cochet A, Ihekweazu C, Nathan N, Payne L, Porten K, Sauvageot D, Schimmer B, Fermon F, Burny ME, Hersh BS, Guerin PJ:
Unacceptably High Mortality Related to Measles Epidemics in Niger, Nigeria, and Chad.PLoS Med2007,4:0122-0129.
45. Aaby P, Coovadia H:Severe measles: a reappraisal of the role of nutrition, overcrowding and virus dose.Med Hypotheses1985,18:93-112. 46. Guyer B, McBean AM:The Epidemiology and Control of Measles in
Yaoundé, Cameroun, 1968-1975.Int J Epidemiol1981,10:263-269. 47. Heymann DL, Mayben GK, Murphy KR, Guyer B, Foster SO:Measles control
in Yaoundé: justification of a one dose, nine month minimum age vaccination policy in tropical Africa.Lancet1983,2:1470-1472.
48. Taylor WR, Ruti-Kalisa , MaDisu M, Weinman JM:Measles control efforts in urban Africa complicated by high incidence of measles in the first year of life.Am J Epidemiol1988,127:788-794.
49. Dollimore N, Cutts F, Binka FN, Ross DA, Morris SS, Smith PG:Measles Incidence, Case Fatality, and Delayed Mortality in Children with or without Vitamin A Supplementation in Rural Ghana.Am J Epidemiol1997,
146:646-654.
50. Garai R, Chakraborty AK:Measles in a rural community.Indian J Public Health1980,24:150-153.
51. Jain DC, Meena HS, Yadav BS, Meena KC, Khare S, Datta KK: Sero-Epidemiology of Measles - A Three Years Prospective Study in a Rural Population of Rajasthan.J Com Dis1990,22:165-172.
52. Bhaskaram P, Radhakrishna KV, Madhusudan J:Seroepidemiological study to determine age for measles vaccination.Indian J Med Res1986,
83:480-486.
53. Pereira SM, Benjamin V:Measles in a South Indian community.Trop Geogr Med1972,24:124-129.
54. Jajoo UN, Chhabra S, Gupta OP, Jain AP:Measles epidemic in a rural community near Sevagram (Vidarbha).Indian J Public Health1984,
28:204-207.
55. Sharma RS, Kaushic VK, Johri SP, Ray SN:An Epidemiological Investigation of Measles Outbreak in Alwar - Rajasthan.J Com Dis1984,16:299-303. 56. Narain JP, Khare S, Rana SRS, Banerjee KB:Epidemic Measles in an Isolated
Unvaccinated Population, India.Int J Epidemiol1989,18:952-958. 57. Risbud AR, Prasad SR, Mehendale SM, Mawar N, Shaikh N, Umrani UB,
Bedekar SS, Banerjee K:Measles outbreak in a tribal population of Thane District, Maharashtra.Indian Pediatr1994,31:543-551.
58. Gupta BP, Sharma S:Measles Outbreak in a Rural Area Near Shimla.
Indian J Com Med2006,31:106-108.
59. Grenfell BT, Bjornstad ON, Kappey J:Travelling waves and spatial hierarchies in measles epidemics.Nature2001,414:716-723.
60. Chand P, Rai RN, Chawla U, Tripathi KC, Datta KK:Epidemiology of Measles - A Thirteen Years Prospective Study in a Village.J Com Dis1989,
21:190-199.
61. Bauch CT, Earn DJD:Transients and attractors in epidemics.Proceedings: Biological Sciences2003,270:1573-1578.
62. Tolfvenstam T, Enbom M, Ghebrekidan H, Rudén U, Linde A, Grandien M, Wahren B:Seroprevalence of viral childhood infections in Eritrea.J Clin Virol2006,16:49-54.
63. Stanfield JP, Bracken PM:Measles vaccination: studies in methods and cost reduction in developing countries.Trans R Soc Trop Med Hyg1971,
65:620-628.
64. Ogunmekan DA, Bracken P, Marshall WC:A seroepidemiological study of measles infection in normal and handicapped persons in Lagos, Nigeria.
J Trop Med Hyg1981,84:175-178.
65. Mehta NA, Nanavati AND, Jhala HI, Sant MV:Seroepidemiology Of Measles In Bombay.Indian J Med Res1972,60:661-669.
66. John TJ, Jesudoss ES:A Survey of Measles Antibody in Children.Indian Pediatr1973,10:65-66.
67. Broor S, Pal SR, Banerjee AK, Chitkara NL, Choudhury S: Sero-epidemiological Study of Measles Virus Infection in and around Chandigarh.Indian J Med Res1976,64:1740-1746.
68. Bhau LNR, Madhavan HN, Agarwal SC:Serological survey of measles virus infection in children in Pondicherry area.Indian J Med Res1979,
69:634-638.
69. Sehgal S, Sharma RS, Mehta PK, Sebastian M, Arora RR: Sero-epidemiological Survey of Measles.J Com Dis1983,15:1-7. 70. Khare S, Dutta A, Kumari S, Basu RN:Seroepidemiology of measles in
Delhi: implications for age of vaccination.Indian J Pediatr1987,
54:711-715.
71. Rao ASRS, Chen MH, Pham BZ, Tricco AC, Gilca V, Duval B, Krahn MD, Bauch CT:Cohort effects in dynamic models and their impact on vaccination programmes: an example from Hepatitis A.BMC Infectious Diseases2006,6:174.
72. Jacobsen KH, Koopman JS:The effects of socioeconomic development on worldwide Hepatitis A virus seroprevalence patterns.Int J Epidemiol2005,
34:600-609.
73. Broutin H, Mantilla-Beniers NB, Simondon F, Aaby P, Grenfell BT, Guégan JF, Rohani P:Epidemiological impact of vaccination on the dynamics of two childhood diseases in rural Senegal.Microbes Infect