R E S E A R C H A R T I C L E
Open Access
Effects of the proportion of high-risk
patients and control strategies on the
prevalence of methicillin-resistant
Staphylococcus aureus
in an intensive care
unit
Farida Chamchod
1*and Prasit Palittapongarnpim
2Abstract
Background: The presence of nosocomial pathogens in many intensive care units poses a threat to patients and public health worldwide. Methicillin-resistantStaphylococcus aureus(MRSA) is an important pathogen endemic in many hospital settings. Patients who are colonized with MRSA may develop an infection that can complicate their prior illness.
Methods: A mathematical model to describe transmission dynamics of MRSA among high-risk and low-risk patients in an intensive care unit (ICU) via hands of health care workers is developed. We aim to explore the effects of the proportion of high-risk patients, the admission proportions of colonized and infected patients, the probability of developing an MRSA infection, and control strategies on MRSA prevalence among patients.
Results: The increasing proportion of colonized and infected patients at admission, along with the higher proportion of high-risk patients in an ICU, may significantly increase MRSA prevalence. In addition, the prevalence becomes higher if patients in the high-risk group are more likely to develop an MRSA infection. Our results also suggest that additional infection prevention and control measures targeting high-risk patients may considerably help reduce MRSA prevalence as compared to those targeting low-risk patients.
Conclusions: The proportion of high-risk patients and the proportion of colonized and infected patients in the high-risk group at admission may play an important role on MRSA prevalence. Control strategies targeting high-risk patients may help reduce MRSA prevalence.
Keywords: MRSA transmission, Infection prevention and control, Targeted control strategies, Sensitivity analysis
Background
Nosocomial infections continue to be a major burden globally causing morbidity and mortality in patients, and increasing additional costs to patients and healthcare providers [1, 2]. Those infections are caused by many types of microorganisms including gram-positive bacte-ria likeStaphylococcus aureus(S. aureus) [1,3]. Generally,
*Correspondence:[email protected]
1Department of Mathematics, Faculty of Science, Mahidol University, Bangkok,
Thailand
Full list of author information is available at the end of the article
Staphylococcus aureus can cause wound infections in patients but it can be life-threatening if it spreads to the lungs, the bloodstream, and other organs. Approximately, 10% to 40% of normal people carryS. aureus, including both methicillin-sensitive and resistantS. aureus(MSSA and MRSA), in their interior nares [4]. Although only 1% to 2% of them carry MRSA, it accounts for more than 60% of hospital-onsetS. aureusinfections [5,6]. MRSA is known to have developed resistance to several widely used antibiotics; resistance to newer antimicrobial agents such as linezolid, vancomycin, teicoplanin, and daptomycin has also been reported [7]. Although rates of infection with
MRSA have slowly declined in recent years, the disease risk still remains substantial and it is even more threaten-ing when only limited numbers of antimicrobial agents are currently in develoment [8,9].
In a hospital setting, one of the most common places of MRSA colonization and infection is an intensive care unit (ICU) [10–12]. It serves as a reservoir for dissem-ination of colonized and infected patients in the hos-pital [13]. Approximately, 20% of infected patients will die from invasive MRSA infections in ICUs; therefore, it is very important to be able to identify the risk fac-tors for colonization and active infection [14]. Risk factors for MRSA colonization and infection have been inves-tigated in numerous studies[14–18]. MRSA colonization itself is the most important risk factor for active infec-tion [19]. Patients with certain comorbidities such as diabetes mellitus and chronic pulmonary disease have been reported to be at risk of MRSA infections [17,20]. Preceding studies suggest that advanced age and patient demographics such as residence of a nursing home are also associated with MRSA colonization and infection [21,22]. Other factors include prolonged hospitalization, exposure to invasive equipment or procedures, the pres-ence of colonized or infected patients in the same area at the same time, previous hospitalization, and exposure to antibiotics [20,23].
Infection prevention and control is a fundamental key to prevent and reduce MRSA transmission in health care settings. Usually, control measures that have been imple-mented in hospitals vary widely and have demonstrated various degrees of success [24,25]. Basic control recom-mendations often include hand hygiene practice, proper cleaning and disinfection of equipment and environment, implementation of a monitoring program, and contact precautions for MRSA colonized and infected patients [26, 27]. Note that the latter recommendation requires that colonized patients being placed in single or pri-vate rooms [27]. If rooms are not available, cohorting of patients is acceptable. In addition, if there are oppor-tunities for improvement, hospitals may consider adopt-ing other prevention approaches such as active surveil-lance for MRSA colonization and infection, implementing MRSA decolonization therapy, or implementing univer-sal gowns and gloves [26,27]. Although several preceding studies promote universal approaches, the merits of them are debated as some recommendations such as contact precautions or screening can be resource-intensive and costly [27,28]. Consequently, alternative approaches such as enhanced hand-hygiene compliance and more targeted control strategies such as the use of decolonization ther-apy with high-risk patients and targeted screening are sometimes implemented [28,29].
Mathematical modeling is one of the important tools to investigate the spread of MRSA among patients in many
studies [30, 31, 33–36]. It can be used to understand the role influenced by different factors and the impact of implemented interventions. To our knowledge, in the deterministic framework, none of previous models have differentiated patients according to their risk of develop-ing an MRSA infection, the probability of havdevelop-ing unsuc-cessful treatment, and the probability of patients staying longer in an ICU. In this study, a mathematical model that patients are categorized into high-risk or low-risk groups was developed to investigate the impact of high-risk patients and control strategies on MRSA prevalence.
Methods
Model formulation
Within an ICU, patients are divided into two groups: high-risk and low-high-risk. In this work, high-high-risk patients are those who are more likely to be colonized with MRSA, have higher risks of developing an MRSA infection, stay in a facility longer, and are more likely to die from the infec-tion. Low-risk patients are those who are not high-risk patients. Each group consists of three mutually exclusive classes: uncolonized(Ui), colonized(Ci), and infected(Ii), fori = H,L. Note that the subscriptidescribes a group that patients belong to, either the high-risk group (H) or the low-risk group (L). Hence, the total number of patients in the ICU (Np) is
i=H,LUi +Ci + Ii. For simplicity, it is assumed that there are no transitions between two groups of patients. HCWs are categorized into two classes: uncontaminated(H)and transiently contaminated(HC). The total number of HCWs (Nh) is given by H + HC. To describe state movements of patients and HCWs in the compartmental model, the following assumptions are made.
Admissions.Patients are admitted to the ICU at a total rate ofwith the proportionθ of being in the high-risk group. In the high-risk group, the proportionsλCH and λIH of patients are colonized and infected at admission, respectively. Moreover, for the low-risk group, the propor-tionsλCLandλILof patients are colonized and infected at admission. It is assumed that the total number of patients in the ICU remains constant so that the number of new admissions is equal to the number of patient discharges and deaths.
infected patients in the high-risk group (νL ≥ νH). After treatment, infected patients either die from an MRSA infection with the probabilitydi fori = H,Lor become colonized patients again with the probability 1−di. Due to the shorter length of stay (LOS) of patients in the ICU as compared to the length of natural clearance of bacteria, we assume that there are no movements of patients from the colonized and infected compartments to the uncolonized compartment. This assumption is similar to one made in other previous studies [37,38].
MRSA transmission.Hands of HCWs are important vehicles for MRSA transmission from one patient to another. Here, transmission of MRSA from contaminated hands of HCWs to uncolonized patients in each group occurs at a rate of Nβ
pHcUi, fori = H,L, where β is a
transmission coefficient from a contaminated HCW to uncolonized patients. Such a term is based on an assump-tion that the probability of successful colonizaassump-tion and the average contact number between HCWs and patients are not different between high-risk and low-risk patients. Hands of uncontaminated HCWs can become contami-nated with MRSA after contacting colonized or infected patients at a rate of αC
Np(CH + CL)H +
αI
Np(IH + IL)H
where αC and αI represent transmission coefficients of MRSA from colonized and infected patients to an uncon-taminated HCW respectively, with αI > αC. In those terms, the probability of successful contamination in a HCW is assumed to be different during HCWs contacting colonized and infected patients.
Infection prevention and control. Standard control measures such as effective hand-washing are taken into account via the average time that HCWs stay contami-nated(1/η)and the probabilities of successful coloniza-tion and contaminacoloniza-tion (q,qC, and qI). If hand hygiene compliance is high (or equivalently 1/η,q,qC, and qI are small), MRSA is unlikely to be transmitted among patients. Two parameters that particularly reflect addi-tional and targeted measures to control the spread of MRSA among patients include a reduction term for infected patients(1−κ, 0 ≤ κ ≤ 1)and another reduc-tion term for high-risk patients (1−σ, 0 ≤ σ ≤ 1). If those targeted measures towards high-risk patients com-pletely help prevent MRSA transmission, we have σ = 1. Similarly, if those targeted measures towards infected patients entirely prevent transmission of MRSA, then we have κ = 1. All the transmission terms after incor-porating additional and targeted control factors become (1−σ)Nβ
pHCUH,(1−σ)
αC
NpCHH, and(1−κ)
αI
Np((1−σ)IH+
IL)H.
From the aforementioned assumptions, a model for describing transmission dynamics of MRSA among high-risk and low-high-risk patients via hands of HCWs is described by
dUH
dt = (1−λCH−λIH)θ−(1−σ)NβpHCUH−γHUH,
dCH
dt = λCHθ+(1−dH)νHIH+(1−σ)NβpHCUH−γHCH,
dIH
dt = λIHθ+pHγHCH−νHIH, dUL
dt = (1−λCL−λIL)(1−θ)−NβpHCUL−γLUL,
dCL
dt = λCL(1−θ)+(1−dL)νLIL+NβpHCUL−γLCL,
dIL
dt = λIL(1−θ)+pLγLCL−νLIL, dH
dt = ηHC−αCNp((1−σ)CH+CL)H−(1−κ) αI
Np((1−σ)IH+IL)H,
dHC
dt = αCNp((1−σ)CH+CL)H+(1−κ) αI
Np((1−σ)IH+IL)H−ηHC, (1)
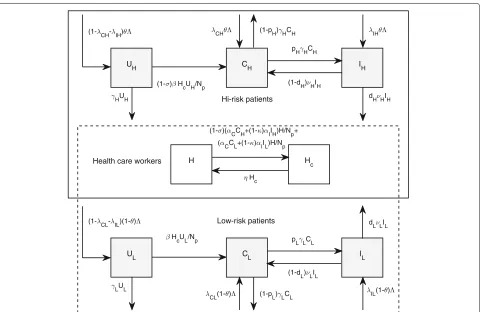
with=(γHUH+(1−pH)γHCH+dHνHIH)+(γLUL+ (1 − pL)γLCL + dLνLIL). A flow diagram for describ-ing the compartmental model is illustrated in Fig.1and parameter descriptions are summarized in Table1.
The basic reproduction number
For a special case, when there are no admissions of col-onized and infected patients in both groups in the ICU, λCH = λIH = λCL = λIL = 0, there is an MRSA-free steady state of (1) and it is given by
E0 = (UH0,CH0,IH0,UL0,CL0,IL0,H0,HC0)
= θγLNp
[(1−θ)γH+θγL], 0, 0,
(1−θ)γHNp
[(1−θ)γH+θγL], 0, 0,Nh, 0
.
Then, the basic reproduction number can be calculated by the next-generation matrix. Two matrices, F and V, can be obtained from the Jacobian matrices at the MRSA-free steady state E0 of the F-matrix describing new infections and the V-matrix describing compartmental movements [48]:
F= ⎡ ⎢ ⎢ ⎢ ⎢ ⎣
0 0 (1−σ)βN p U
0
H 0 0
0 0 NβpU0
L 0 0
(1−σ)αC
Np H
0 αC
NpH
0 0 (1−κ)(1−σ)αI
Np H
0 (1−κ)αI
Np H
0
0 0 0 0 0
0 0 0 0 0
⎤ ⎥ ⎥ ⎥ ⎥ ⎦and V= ⎡ ⎢ ⎢ ⎢ ⎢ ⎣
γH 0 0 −(1−dH)νH 0
0 γL 0 0 −(1−dL)νL
0 0 η 0 0
−pHγH 0 0 νH 0
0 −pLγL 0 0 νL
⎤ ⎥ ⎥ ⎥ ⎥ ⎦.
The basic reproduction number is defined as the spec-tral radius ofFV−1:
R20 = (1−σ)2βαC
η(1−(1−dH)pH)γH
θγL
[(1−θ)γH+θγL]
Nh
Np
+ (1−σ)2(1−κ)pHβαI
η(1−(1−dH)pH)νH
θγL
[(1−θ)γH+θγL]
Nh
Np+
βαC
η(1−(1−dL)pL)γL
(1−θ)γH
[(1−θ)γH+θγL]
Nh
Np
+ (1−κ)pLβαI
η(1−(1−dL)pL)νL
(1−θ)γH
[(1−θ)γH+θγL]
Nh
Np.
(2)
Fig. 1Flow diagram. A flow diagram for describing MRSA transmission dynamics among high-risk and low-risk patient groups via hands of HCWs. Each group of patients is divided into three categories: susceptible(Si), colonized(Ci), and infected(Ii)fori=H,L
As admissions of colonized patients and discharges of patients are generally present in the ICU, the above case may not be possible in reality. MRSA may persist even if
R0<1 when there are admissions of colonized or infected patients. Note that whenλCH = 0 andλCL = 0, there exists only a disease-present steady state of (1). This can be proved by contradiction and it is omitted here. Due to several nonlinear terms in the model, calculating the disease-present steady state (E∗) explicitly is not possi-ble. Hence, the effects of certain parameters in the model on the prevalence of MRSA colonization or infection are numerically investigated.
Sensitivity analysis
To identify important parameters that significantly influ-ence MRSA prevalinflu-ence in the ICU, sensitivity indices at the endemic steady state to the model parameters are calculated. We follow the steps in [49] to calculate the indices. The normalized forward sensitivity index of a variableXiwith respect to a parameterpiis defined by
ωXi
pi =
∂Xi ∂pi
pi Xi .
Since there are eight state variables at the endemic steady state(E∗)and twenty parameters in the model, for ease of notation(UH,CH,. . .,HC)is relabeled by(X1,X2,. . .,X8) and(θ,λCH,. . .,Np)by (p1,p2,. . .,p20). In addition, the steady state Eq. (1) can be written as
fi(X1,X2,. . .,X8;p1,p2,. . .,p20)=0 fori=1, 2,. . ., 8.
Differentiating both sides of the equations gives
8
i=1
∂fk ∂Xi
∂Xi ∂pj = −
∂fk ∂pj .
for 1 ≤ k ≤ 8 and 1 ≤ j ≤ 20. Equivalently, the above system can be written in a matrix form as
JZ(j)=B(j)
whereJis the Jacobian matrix of (1) at the endemic steady state and we haveZ(j) = ∂Xi
∂pj
8×1, andB
(j) = −∂fi
∂pj
8×1
fori=1, 2,. . .8. Consequently,Z(j)can be calculated and the sensitivity index of a variableXi to the parameterpj can be obtained by multiplying ∂Xi
∂pj with
pj
Xi. By repeating
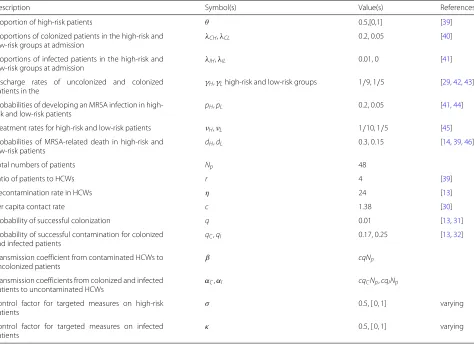
[image:4.595.59.540.84.396.2]Table 1List of parameters for MRSA transmission among high-risk and low-risk patients via HCWs
Description Symbol(s) Value(s) References
Proportion of high-risk patients θ 0.5,[0,1] [39]
Proportions of colonized patients in the high-risk and low-risk groups at admission
λCH,λCL 0.2, 0.05 [40]
Proportions of infected patients in the high-risk and
low-risk groups at admission λIH
,λIL 0.01, 0 [41]
Discharge rates of uncolonized and colonized patients in the
γH,γLhigh-risk and low-risk groups 1/9, 1/5 [29,42,43]
Probabilities of developing an MRSA infection in high-risk and low-high-risk patients
pH,pL 0.2, 0.05 [41,44]
Treatment rates for high-risk and low-risk patients νH,νL 1/10, 1/5 [45]
Probabilities of MRSA-related death in high-risk and low-risk patients
dH,dL 0.3, 0.15 [14,39,46]
Total numbers of patients Np 48
Ratio of patients to HCWs r 4 [39]
Decontamination rate in HCWs η 24 [13]
Per capita contact rate c 1.38 [30]
Probability of successful colonization q 0.01 [13,31]
Probability of successful contamination for colonized and infected patients
qC,qI 0.17, 0.25 [13,32]
Transmission coefficient from contaminated HCWs to
uncolonized patients β
cqNp Transmission coefficients from colonized and infected
patients to uncontaminated HCWs αC
,αI cqCNp,cqINp
Control factor for targeted measures on high-risk patients
σ 0.5, [ 0, 1] varying
Control factor for targeted measures on infected
patients κ
0.5, [ 0, 1] varying
(minus) sign of a calculated value indicates that a state variable increases (decreases) when a parameter increases while the value reflects a magnitude of impact.
Results
To investigate the effects of certain parameters, includ-ing the admission proportions of colonized and infected patients in the high-risk and low-risk groups, the prob-ability of developing an MRSA infection, and control factors on the prevalence of MRSA, numerical simula-tions are carried out. Based on the parameter values used in this study, the basic reproduction number is approximately 0.55. The approximation is obtained from the formula of R0 in (2) with the intermediate level of
infection prevention and control towards high-risk and infected groups of patients (σ = κ = 0.5). This leads to the overall prevalence of MRSA of 25% among patients and an acquisition rate of 10% in our baseline results. Note that here we define the acquisition rate as a percentage of patients who become colonized or infected with MRSA during their hospital stays. Hence, the quantity is approximately obtained from a subtraction
of MRSA prevalence in the ICU and MRSA admission prevalence.
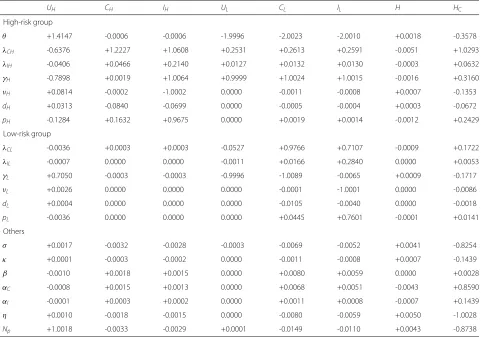
Table 2Sensitivity indices of the state variables at the endemic steady state to the related parameters
UH CH IH UL CL IL H HC High-risk group
θ +1.4147 -0.0006 -0.0006 -1.9996 -2.0023 -2.0010 +0.0018 -0.3578
λCH -0.6376 +1.2227 +1.0608 +0.2531 +0.2613 +0.2591 -0.0051 +1.0293
λIH -0.0406 +0.0466 +0.2140 +0.0127 +0.0132 +0.0130 -0.0003 +0.0632
γH -0.7898 +0.0019 +1.0064 +0.9999 +1.0024 +1.0015 -0.0016 +0.3160
νH +0.0814 -0.0002 -1.0002 0.0000 -0.0011 -0.0008 +0.0007 -0.1353
dH +0.0313 -0.0840 -0.0699 0.0000 -0.0005 -0.0004 +0.0003 -0.0672
pH -0.1284 +0.1632 +0.9675 0.0000 +0.0019 +0.0014 -0.0012 +0.2429
Low-risk group
λCL -0.0036 +0.0003 +0.0003 -0.0527 +0.9766 +0.7107 -0.0009 +0.1722
λIL -0.0007 0.0000 0.0000 -0.0011 +0.0166 +0.2840 0.0000 +0.0053
γL +0.7050 -0.0003 -0.0003 -0.9996 -1.0089 -0.0065 +0.0009 -0.1717
νL +0.0026 0.0000 0.0000 0.0000 -0.0001 -1.0001 0.0000 -0.0086
dL +0.0004 0.0000 0.0000 0.0000 -0.0105 -0.0040 0.0000 -0.0018
pL -0.0036 0.0000 0.0000 0.0000 +0.0445 +0.7601 -0.0001 +0.0141
Others
σ +0.0017 -0.0032 -0.0028 -0.0003 -0.0069 -0.0052 +0.0041 -0.8254
κ +0.0001 -0.0003 -0.0002 0.0000 -0.0011 -0.0008 +0.0007 -0.1439
β -0.0010 +0.0018 +0.0015 0.0000 +0.0080 +0.0059 0.0000 +0.0028
αC -0.0008 +0.0015 +0.0013 0.0000 +0.0068 +0.0051 -0.0043 +0.8590
αI -0.0001 +0.0003 +0.0002 0.0000 +0.0011 +0.0008 -0.0007 +0.1439
η +0.0010 -0.0018 -0.0015 0.0000 -0.0080 -0.0059 +0.0050 -1.0028
Np +1.0018 -0.0033 -0.0029 +0.0001 -0.0149 -0.0110 +0.0043 -0.8738
The plus (minus) sign indicates that a state variable increases (decreases) when a parameter increases while the value reflects a magnitude of impact
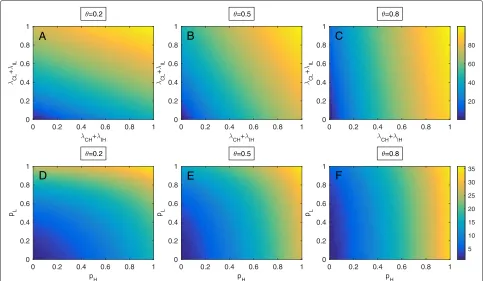
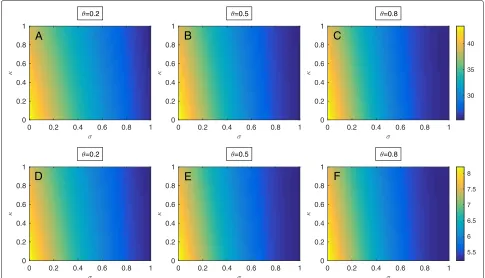
patients in the high-risk and low-risk groups. When the proportion of high-risk patients is small in comparison to low-risk patients, both of the probabilities of developing infections in the high-risk and low-risk groups influence the prevalence of infected patients in the ICU. However, such an impact may decline resulting from the probabil-ity of becoming infected with MRSA in the low-risk group having a smaller effect when the proportion of high-risk patients in the ICU becomes higher (see Fig.2e-f ).
To explore how the control factors (σandκ) that reflect infection prevention and control strategies towards high-risk patients and patients infected with MRSA influence MRSA prevalence in the ICU, both of the control factors are varied as shown in Fig.3a-f. It can be clearly seen that the control factor related to targeted control measures towards high-risk patients plays a greater role in reducing MRSA prevalence in patients as compared to the con-trol factor related to targeted concon-trol measures towards infected patients. In addition, the trend does not change even if the proportion of high-risk patients at admission increases.
According to Table 2, the most sensitive parameter is the proportion of high-risk patients in the ICU (ωCL,IL
θ ≈
−2). Other important parameters include the proportions of colonized patients at admission of the high-risk and low-risk groups, treatment rates, discharge rates, decon-tamination rate of HCWs, transmission coefficient from colonized patients to uncontaminated HCWs, numbers of patients, and control factor related to targeted mea-sures on high-risk patients. In addition, the sensitivity indices suggest that MRSA prevalence among patients in the high-risk group significantly increases according to the higher proportion of colonized patients of the high-risk group at admission(ωCH,IH
λCH = 1.2227, 1.0608).
For the higher prevalence of MRSA infection, it may also involve some other factors such as a higher dis-charge rate, the higher probability of developing an MRSA infection, and a lower treatment rate in high-risk patients
ωIH
γH,pH,νH =1.0064, 0.9675,−1.0002
Fig. 2Effects of parameters on the prevalence of MRSA.a-cThe prevalence of MRSA colonization and infection when the probabilities of colonization and infection at admission of high-risk(λCH+λIH)and low-risk patients(λCL+λIL)vary at three different levels of high-risk patients, low(θ=0.2), intermediate(θ=0.5)and high(θ=0.8).d-fThe prevalence of MRSA infection according to the probabilities of becoming infected with MRSA of high- and low-risk patients at low, intermediate, and high levels of high-risk patients at admission
probability of developing an MRSA infection of low-risk patients may result in higher MRSA prevalence in the low-risk group (ωCL,IL
λCL = 0.9766, 0.7107,ω
CL
γL,νL =
−1.0089,−1.0001,ωIL
νL,pL = −1.0001, 0.7601). Moreover,
there are also some factors that may lead to the higher prevalence of MRSA in the low-risk group: the lower pro-portion of high-risk patients and the higher discharge rate of high-risk patients(ωCL,IL
θ = −2.0023,−2.0010,ωγCHL,IL=
1.0024, 1.0015). Finally, the sensitive indices suggest that the higher proportion of colonized patients in the high-risk group at admission and the higher transmission coefficient from colonized patients to uncontaminated HCWs may result in the higher prevalence of HCW contamination(ωHC
λCH,αC = 1.0293, 0.8590). Also,
decreas-ing decontamination rate, control factor related to high-risk patients, and numbers of patients may significantly increase the higher prevalence of HCW contamination (ωHC
σ,η,Np= −0.8254,−1.0028,−0.8738).
Discussion
Despite advances in infection prevention and control interventions and successful control strategies, MRSA still continues to be a challenging problem causing morbidity and mortality in the ICU patients. Currently, to reduce the
spread of MRSA, many control strategies have been pro-posed. Some of those are for example screening patients on admission to the ICUs, implementing a contact precau-tion policy, isolating and cohort nursing MRSA-positive patients, decolonizing MRSA in colonized and infected patients, and limiting use of antibiotics.
In this study, a mathematical model was developed to investigate MRSA transmission among high-risk and low-risk patients via hands of HCWs, study the influences of high-risk patients in an ICU, and explore control strate-gies. Previous studies have demonstrated that advanced age, MRSA colonization, use of invasive devices, pro-longed length of stay, and serious underlying illness are for example possible risk factors for MRSA colonization and infection[15–18]. As active surveillance and stringent control measures for all patients can be financially chal-lenging especially for large health care institutions and can possibly impose a heavy burden on nursing time, some institutions recommend targeted surveillance and control [28,29,50]. Based on the model, we explored the effects of targeted control strategies and possible ways to reduce MRSA prevalence.
[image:7.595.57.540.87.368.2]Fig. 3Control factors. Effects of changing control parameters related to control measures towards high-risk patients(σ )and infected patients(κ) on MRSA prevalence with three different proportions of high-risk patients in the ICU, low(θ=0.2), intermediate(θ=0.5)and high(θ=0.8). (a)-(c) The prevalence of MRSA colonization and infection among patients. (d)-(f) The prevalence of MRSA infection among patients
[30] but is less than 1.52 approximated in another study [13]. Although, the basic reproduction number is less than 1, MRSA still persists in the ICU patients due to the presence of MRSA-positive patients at admission. In this present study, MRSA prevalence is approximately 25% which leads to the acquisition rate of 10% in our base-line result. Both approximations are in possible ranges of MRSA prevalence and the acquisition rate [9]. Gen-erally, the basic reproduction number can be used for not only determining whether a pathogen can persist in a population but also investigating the prevalence and severity of outbreaks. Consequently, our results suggest that there are several factors that may influence MRSA prevalence. Those factors are such as a ratio of high-risk to low-high-risk patients, transmission coefficients, con-trol factors, a ratio of patients to HCWs, and treatment rates.
We further investigated the effects of high-risk patients and other control parameters on MRSA prevalence by numerical simulations. Our results suggest that the higher prevalence of MRSA is linked to the proportion of high-risk patients in an ICU, the presence of colonized and infected patients in the high-risk group, the probability of developing an MRSA infection, and a control factor
associated with high-risk patients. These results also cor-respond to a formula of the basic reproduction number. For example, the control factor related to targeted con-trol measures towards high-risk patients is linked to a squared term in the basic reproduction number’s formula while a control factor associated with infected patients is linked to a simple term. This corresponds to a higher impact ofσ overκon MRSA prevalence in our numerical results.
[image:8.595.55.540.87.365.2]lower MRSA prevalence. In addition, according to the sen-sitivity indices, if the probability of developing an MRSA infection in high-risk patients is high, it may result in the higher prevalence of MRSA infection. As transmission coefficients and decontamination rate also significantly affect MRSA prevalence in our sensitivity analysis and they are linked to standard control measures, the results underline how important standard measures can help reduce the prevalence. Although those aforementioned factors may play an important part in determining over-all MRSA prevalence, it is unfortunate that some are not manageable and controllable. However, if there are oppor-tunities for control improvement, our results suggest a control effort towards high-risk patients. This results from the sensitivity indices demonstrating that the control fac-tor reflecting targeted control measures towards infected patients (κ) shows a smaller impact on reducing the prevalence of MRSA in comparison to the control fac-tor reflecting targeted control measures towards high-risk patients(σ). As the latter significantly helps reduce MRSA contamination in HCWs, it may consequently decrease cross-transmission among patients via hands of HCWs. In conclusion, our results from the basic reproduction number, numerical simulations, and sensitivity analysis are in agreement one another. They also correspond to preceding studies that suggest targeted surveillance and decolonization as a possible way to control MRSA with more efficient use of resources [29,51,52].
There are several limitations in this study. Firstly, we made an assumption that colonized and infected patients cannot become fully uncolonized in the model which is not in agreement with some preceding reports that suggest a much lesser extent of MRSA in ICU patients [53, 54] and hence it may lead to an overestimate of MRSA prevalence. Secondly, an assumption that the prob-ability of successful colonization and the average contact number between HCWs and patients are not different between high-risk and low-risk patients may also result in an overestimate of MRSA prevalence in low-risk patients. Thirdly, we did not take into account MSSA which may have a potential impact on MRSA prevalence. As hos-pitals may have different control strategies and some ICUs may have different endemic rates of MRSA and different characteristics, our findings only suggest possi-ble results for some ICU settings. Other scenarios such as a highly endemic setting or a lower endemic set-ting that affects ranges of parameters may need further investigations.
All in all, we believe that this study will help empha-size the influences of high-risk patients in an ICU, suggest important factors of the MRSA prevalence, and highlight the positive effects of control strategies towards high-risk patients.
Conclusions
The findings of this study suggest that the proportion of high-risk patients in an ICU and the proportion of col-onized and infected patients in the high-risk group at admission may play an important role on MRSA preva-lence. In addition, control strategies that significantly help reduce MRSA cross-transmission in high-risk patients may help reduce overall MRSA prevalence.
Abbreviations
HCW: Health care worker; ICU: Intensive care unit; LOS: Length of stay; MRSA: Methicillin-resistantStaphylococcus aureus
Acknowledgements
We would like to thank both reviewers of this article for valuable suggestions.
Authors’ contributions
FC and PP designed the study. FC developed the model, performed the analytic calculations, carried out the numerical simulations, interpreted the results, and wrote the manuscript. Both FC and PP read and approved the final manuscript.
Funding
We would like to thank the Research Fund for DPST Graduate with First Placement (02/2557) for the equipment and software support. The funding body had no role in the study design, analysis and interpretation of results nor in writing the manuscript.
Availability of data and materials
All data generated or analysed during this study are included in this published article.
Ethics approval and consent to participate
Not applicable.
Consent for publication
Not applicable.
Competing interests
The authors declare that they have no competing interests.
Author details
1Department of Mathematics, Faculty of Science, Mahidol University, Bangkok,
Thailand.2Department of Microbiology, Faculty of Science, Mahidol University,
Bangkok, Thailand.
Received: 10 June 2019 Accepted: 11 November 2019
References
1. Inweregbu K, Dave J, Pittard A. Nosocomial infections. Contin Educ Anaesth Crit Care Pain. 2005;5:14–7.
2. Haque M, Sartelli M, McKimm J, Bakar MA. Health care-associated infections-an overview. Infect Drug Resist. 2018;11:2321–33. 3. Di Bonito M, Caiaszzo S, Iannazzone M, et al. Prognostic differences
between VAP for Acinetobacter baumanii and VAP from other microorganisms. Transl Med UniSa. 2012;3:15–21.
4. Joaquin NMQ, Diekema DJ, Perencevich EN, et al. Long-term risk for readmission, methicillin-resistantStaphylococcus aureus(MRSA) infection, and death among MRSA-colonized veterans. Antimicrob Agents Chemother. 2013;57:1169–72.
5. Klevens RM, Morrison MA, Nadie J, et al. Invasive methicillin-resistant Staphylococcus aureusinfections in the United States. JAMA. 2007;298: 1763–71.
7. Kaur DC, Chate SS. Study of antibiotic resistance pattern in methicillin resistantStaphylococcus aureuswith special reference to newer antibiotic. J Glob Infect Dis. 2015;7:78–84.
8. Peterson LR, Schora DM. Methicillin-ResistantStaphylococcus aureus control in the 21st century: laboratory involvement affecting disease impact and economic benefit from large population. J Clin Microbiol. 2016;54:2647–54.
9. Hassoun A, Linden PK, Friedman B. Incidence, prevalence, and management of MRSA bacteremia across patient populations-a review of recent developments in MRSA management and treatment. Crit Care. 2017;21:211.
10. Ewans TM, Ortiz CR, LaForce FM. Prevention and control of nosocomial infection in the intensive care unit. In: Irwin RS, Cerra FB, editors. Intensive Care Medicine. New York: Lippincott-Raven; 1999. p. 1074–80. 11. Bloemendaal ALA, Jansen WMT, Vriens MR, et al. Acquisition and
cross-transmission ofStaphylococcus aureusin European intensive care units. Infect Control Hosp Epidemiol. 2009;30:117–24.
12. Majumdar SS, Padiglione AA. Nosocomial infections in the intensive care unit. Anaesth Intens Care. 2012;13:204–8.
13. Grundmann H, Hori S, Winter B, et al. Risk factors for the transmission of methicillin-resistantStaphyloccus aureusin an adult intensive care unit: fitting a model to the data. J Infect Dis. 2002;185:481–8.
14. Cadena J, Thinwa J, Water EA, et al. Risk factors for the development of active methicillin-resistantStaphyloccus aureus(MRSA) infection in patients colonized with MRSA at hospital admission. Am J Infect Control. 2016;44:1617–21.
15. Safdar N, Maki DG. The commonality of risk factors for nosocomial colonization and infection with antimicrobial-resistantStaphylococcus aureus,Enterococcus, gram-negativeBacilli,Clostridium difficile, and Candida. Ann Intern Med. 2002;136:834–44.
16. Vincent JL. Nosocomial infections in adult intensive-care units. Lancet. 2003;361:2068–77.
17. Oztoprak N, Cevik MA, Akinci E, et al. Risk factors for ICU-acquired methicillin-resistantStaphylococcus aureusinfections. Am J Infect Control. 2006;34:1–5.
18. Guggenbichler JP, Assadian O, Boeswald M, Kramer A. Incidence and clinical implication of nosocomial infections associated with implantable biomaterials-catheters, ventilator-associated pneumonia, urinary tract infections. GMS Krankenhhyg Interdiszip. 2011;6:18.
19. Vigil DI, Harden WD, Hines AE, et al. Risk of MRSA infection in patients with intermitten versus persistent MRSA colonisation. Infect Control Hosp Epidemiol. 2005;36:1292–7.
20. Graffunder EM, Venezia RA. Risk factors associated with nosocomial methicillin-resistantStaphylococcus aureus(MRSA) infection including previous use of antimicrobials. J Antimicrob Chemother. 2002;49: 999–1005.
21. McKinnell JA, Miller LG, Eells SJ, et al. A systematic literature review and meta-nalysis of factors associated with MRSA colonisation at time of hospital or ICU admission. Infect Control Hosp Epidemiol. 2013;34: 1077–86.
22. Catry B, Latour K, Jans B, et al. Risk factors for methicillin-resistant Staphylococcus aureus: a multi-laboratory study. PLoS ONE. 2014;9:e89579. 23. Gupta K, Martinello RA, Young M, et al. MRSA nasal carriage patterns and the subsequent risk of conversion between patterns, infection, and death. PLoS ONE. 2013;8:e53674.
24. Ofner-Agostini M, Varia M, Johnston L, et al. Infection control and antimicrobial restriction practices for antimicrobial-resistant organisms in Canadian tertiary care hospitals. Am J Infect Control. 2007;35:563–8. 25. Huskins WC, Huckabee CM, OGrady NP, et al. Intervention to reduce
transmission of resistant bacteria in intensive care. N Engl J Med. 2011;364:1407–18.
26. Calfee DP, Salgado CD, Milstone AM, et al. Strategies to prevent methicillin-resistantStaphylococcus aureustransmission and infection in acute care hospitals 2014 update. Infect Control Hosp Epidemiol. 2014;35: 772–96.
27. Brown J. Contact precautions for methicillin-resistantStaphylococcus aureus: are they still valuable? Curr Emerg Hosp Med Rep. 2014;2:189–95. 28. Kock R, Becker K, Cookson B, et al. Systematic literature analysis and
review of targeted preventive measures to limit healthcare-associated infections by methicillin-resistantStaphylococcus aureus. Euro Surveill. 2014;19:23–49.
29. Harris AD, Furuno JP, Roghmann M, et al. Targeted surveillance of methicillin-resistantStaphylococcus aureusand its potential use to guide empiric antibiotic therapy. Antimicrob Agents Chemother. 2010;54: 3143–8.
30. McBryde ES, Pettitt AN, McElwain DLS. A stochastic mathematical model of methicillin-resistantStaphylococcus aureustransmission in an intensive care unit: predicting the impact of interventions. J Theor Biol. 2007;245: 470–81.
31. Haber M, Levin BR, Kramarz P. Antibiotic control of antibiotic resistance in hospitals: a simulation study. BMC Infect Dis. 2010;10:254.
32. McBryde ES, Bradley LC, Whitby M, et al. An investigation of contact transmission of methicillin-resistant textitStaphylococcus aureus. J Hosp Infect. 2004;58:104–8.
33. Chamchod F, Ruan S. Modeling the spread of methicillin-resistant Staphylococcus aureusin nursing homes for elderly. PLoS ONE. 2012;7: e29757.
34. Wang X, Panchanathan S, Chowell G. A data-driven mathematical model of CA-MRSA transmission among age groups: evaluating the effect of control interventions. PLOS Comput Biol. 2013;9:e1003328.
35. Simon CP, Percha B, Riolo R, Foxman B. Modeling bacterial colonization and infection routhes in health care settings: analytic and numerical approaches. J Theor Biol. 2013;334:187–99.
36. Beauparlant M, Smith R. A metapopulation model for the spread of MRSA in correctional facillities. Infect Dis Model. 2016;1:11–27.
37. D’Agata EMC, Webb GF, Horn MA, et al. Modeling the invasion of community-acquired methicillin-resistantStaphylococcus aureusinto hospitals. Clin Infect Dis. 2009;48:274–84.
38. Ding W, Webb GF. Optimal control applied to community-acquired methicillin-resistantStaphylococcus aureusin hospitals. J Biol Dynam. 2017;11:65–78.
39. Wernitz MH, Swidsinski S, Weist K, et al. Effectiveness of a hospital-wide selective screening programme for methicillin-resistantStaphylococcus aureus(MRSA) carriers at hospital admission to prevent hospital-acquired MRSA infections. Clin Microbiol Infect. 2005;11:457–65.
40. Evans RS, Wallace CJ, Lloyd JF, et al. Rapid identification of hospitalized patients at high risk for MRSA carriage. J Am Med Inform Assoc. 2008;15: 506–12.
41. Fraser S, Brady RB, Graham C, et al. Methicillin-resistantStaphylococcus aureusin surgical patients: identification of high-risk populations for the development of targeted screening programmes. 92. 2010311–5. 42. Wang F, Chen Y, Chen T, et al. Risk factors and mortality of nosocomial
infections of methicillin-resistantStaphylococcus aureusin an intensive care unit. 26. 201182–8.
43. Patel DA, Shorr AF, Chastre J, et al. Modeling the economic impact of linezolid versus vancomycin in confirmed nosocomial phenumonia caused by methicillin-resistant Staphylococcus aureus. Crit Care. 2014;18: R157.
44. Haddadin AS, Fappiano SA, Lipsett PA. Methicillin-resistant
Staphylococcus aureus(MRSA) in the intensive care unit. Postgrad Med J. 2002;78:385–92.
45. Casapao AM, Lodise TP, Davis SL, et al. Association between vancomycin day 1 exposure profile and outcomes among patients with
methicillin-resistantStaphylococcus aureusinfective endocarditis. Antimicrob Agents Chemother. 2015;59:2978–85.
46. Libert M, Elkholti M, Massaut J, et al. Risk factors for methicillin resistance and outcome ofStaphylococcus aureusbloodsteam infection in a Belgian university hospital. J Hosp Infect. 2008;68:17–24.
47. Haber M, Levin BR, Kramarz P. Antibiotic control of antibiotic resistance in hospitals. BMC Infect Dis. 2010;10:254.
48. van den Driessche P, Watmough J. Reproduction numbers and sub-threshold endemic equilibria for compartmental models of disease transmission. Math Biosci. 2002;285:29–48.
49. Chitnis N Hyman JM, Cushing JM. Determining important parameters in the spread of malaria through the sensitivity analysis of a mathematical model. Bull Math Biol. 2008;70:1272–96.
50. Hidron AI, Kourbatova EV, Halvosa JS, et al. Risk factors for colonization with methicillin-resistantStaphyloccous aureus(MRSA) in patients admitted to an urban hospital: emergence of community-associated MRSA nasal carriage. Clin Infect Dis. 2005;41:159–66.
methicillin-resistantStaphylococcus aureusinfection. J Hosp Infect. 2013;85:33–44.
52. Cheng VC, Tai JW, Chau P, et al. Minimal intervention for controlling nosocomial transmission of methicillin-resistantStaphylococcus aureusin resource limited setting with high endemicity. PLoS ONE. 2014;9:e100493. 53. Huckabee CM, Huskins WC, Murray PR. Predicting clearance of
colonization with vancomycin-resistant enterococci and
methicillin-resistantStaphylococcus aureusby use of weekly surveillance cultures. J Clin Microbiol. 2009;47:1229–30.
54. Price JR, Cole K, Bexley A, et al. Transmission ofStaphylococcus aureus between health-care workers, the environment, and patients in an intensive care unit: a longitudinal cohort study based on whole-genome sequencing. Lancet Infect Dis. 2017;17:207–14.
Publisher’s Note