RESEARCH
Establishment of clinical diagnosis model
of Graves’ disease and Hashimoto’s thyroiditis
Zhaohui Cui
1,2†, Zhixiao Wang
1†, Xiaoyun Liu
1, Yun Cai
1, Xinyu Xu
1and Tao Yang
1*Abstract
Background: A clinical diagnosis model include thyroid functions, thyroid antibodies and radioactive iodine uptake (RAIU) of patients with hyperthyroidism were established and as new evaluation indicators for the differentiation of the Graves’ disease (GD) and Hashimoto’s thyroiditis (HT).
Methods: Clinical data of patients with newly diagnosed hyperthyroidism including gender, age, thyroid function, thyroid antibodies (FT3, FT4, TSH, TPOAb, TGAb, TRAb), RAIU (2 h, 6 h, 24 h) were collected. A stepwise regression analysis was performed to establish a model based on these variables.
Results: Model 1 was subjected to stepwise regression analysis. After screening, the variables that entered the model included FT3, TGAb, TPOAb, TRAb, 2-h RAIU, 24-h RAIU and gender, in which the variables FT3, TGAb, TRAb, 2-h RAIU, 24-h RAIU, and gender were significantly different. Model 2 without RAIU was also subjected to stepwise regression analysis. After screening, the variables that entered the model included FT4, TGAb, TPOAb, TRAb and gender were statistical significant. The larger value of each variable in the two models indicated the higher probability to diagnose GD. The area under the receiver operating characteristic (ROC) curve of model 1 was 0.843 (95% CI 0.779–0.894), and the area under the ROC curve of model 2 was 0.806 (95% CI 0.685–0.824), which showed good differential diagnostic value.
Conclusions: GD and HT diagnosis model was established according to the variables including gender, FT3, TGAb, TRAb, the 2-h RAIU, the 24-h RAIU in the model 1, and the variables FT4, TGAb, TPOAb, TRAb and gender in the model 2 that did not include RAIU. These models had high value to differentiate GD and HT for patients with early hyperthyroidism.
Keywords: Graves’ disease, Hashimoto’s thyroiditis, Model, Diagnosis
© The Author(s) 2019. This article is distributed under the terms of the Creative Commons Attribution 4.0 International License (http://creat iveco mmons .org/licen ses/by/4.0/), which permits unrestricted use, distribution, and reproduction in any medium, provided you give appropriate credit to the original author(s) and the source, provide a link to the Creative Commons license, and indicate if changes were made. The Creative Commons Public Domain Dedication waiver (http://creat iveco mmons .org/ publi cdoma in/zero/1.0/) applies to the data made available in this article, unless otherwise stated.
Background
Graves’ disease (GD) is a common organ-specific auto-immune endocrine disease, with an occurrence of 1.2% in the Chinese population. Autoimmune thyroid disease (AITD) includes two major clinical manifestations: GD and Hashimoto’s thyroiditis HT [1]. The prevalence of AITD is approximately 5% [1, 2], and the clinical features of this disease are mainly hyperthyroidism and hypo-thyroidism. Although the pathogenesis is not very clear, there is evidence that environmental factors (infection,
drugs, smoking, iodine, etc.) could trigger AITD in sus-ceptible individuals [3–6]. Case reports have shown that HT can progress to GD [7–10]. In addition, other stud-ies have reported that about 10–15% of patients with GD may have hypothyroidism after anti-thyroid treatment [11], suggesting that GD and HT may exist at the same time. In some cases, GD patients may have lymphocytic thyroiditis, and treatment with antithyroid drugs will lead to drug-induced hypothyroidism. Therefore, for patients with early hyperthyroidism, it is crucial to identify the cause of the disease.
At present, the diagnosis of GD is mainly based on the typical clinical manifestations of hyperthyroidism, diffuse enlargement (lesion) of thyroid B in ultrasound, and posi-tive expression of thyrotropin receptor antibody (TRAb),
Open Access
*Correspondence: [email protected]
†Zhaohui Cui and Zhixiao Wang contributed equally to this work 1 Department of Endocrinology, The First Affiliated Hospital of Nanjing
thyroglobulin antibody (TGAb), and thyroid peroxidase antibody (TPOAb). However, in the early stage of HT, there may also be clinical manifestation of hyperthyroid-ism, positive TGAb and TPOAb. For example, 70% of GD patients have positive TPOAb and TGAb. Similarly, TRAb is also positive in a few HT patients [12]. There-fore, it is difficult for clinicians to distinguish GD and HT with atypical clinical symptoms and positive antibodies.
Currently, the most valuable laboratory test is the determination of serum thyroid stimulating antibody (TSAb) and thyroid stimulating blocking antibody (TSBAb). It is generally believed that TSAb is dominant in GD patients. When the dominant antibody is TSBAb, the incidence of hypothyroidism is increased [13, 14]. However, the detection methods of TSBAb and TSAb are mainly used for scientific research, and it is not applica-ble in clinical detection for the diagnosis and subsequent treatment of the GD and HT.
So far, there is still no effective differentiation method. Therefore, for patients with early hyperthyroidism, we hypothesize that a clinical differentiation model could be established based on thyroid function (FT3, FT4, TSH), thyroid antibodies (TGAb, TPOAb, TRAb), RAIU (2 h, 6 h, 24 h) and cytological pathology of fine needle aspira-tion. Model could help clinicians to quantify the indica-tors while making an accurate diagnosis, thus providing a reference for the clinical diagnosis and identification of hyperthyroidism to effectively save existing medical resources and reduce the economic burden on patients.
Methods
Research subjects
This study included 197 patients (51 males and 146 females, aged 16–68, mean age 38.30 ± 12.63) whom were admitted to the Department of Endocrinology, the First Affiliated Hospital of Nanjing Medical University, from January 2016 to September 2017. The inclusion criteria included (1) patients with initial hyperthyroid-ism; (2) free T3 (FT3), free T4 (FT4), and thyroid stim-ulating hormone (TSH) were confirmed to the initial diagnosis of hyperthyroidism; and (3) clinical data were relatively complete. Patients with hyperthyroidism dur-ing pregnancy, severe hepatic or renal dysfunction, auto-immune disease, and other types of hyperthyroidism, or patients with unsuitable conditions for participation were excluded.
Research methods
Clinical data of patients with newly diagnosed hyper-thyroidism, including gender, age, thyroid function and antibodies (FT3, FT4, TSH, TPOAb, TGAb, TRAb), and RAIU (2 h, 6 h, 24 h) were collected. Informed consents were signed by all patients. Ultrasound-guided thyroid
fine needle aspiration was performed and rapid smear was done for three slides for pathological examination. The GD and HT grouping was based on the pathologi-cal findings of thyroid fine needle aspiration. FT3, FT4, TSH, TPOAb, TGAb, and TRAb levels were determined by chemiluminescence assays.
Statistical analysis
The independent sample t test was used to compare the two groups of quantitative data. The quantitative data were expressed as mean ± standard deviation. Logistic
regression was used for the diagnostic model equation. R software was used for all statistical analysis. The area under the RAIU curve was calculated using the trapezoi-dal rule. The diagnostic efficacy of the evaluation model was determined using a receiver operating characteristic (ROC) curve with α = 0.05 as the statistically significant
level.
Results
Clinical characteristics of the study subjects
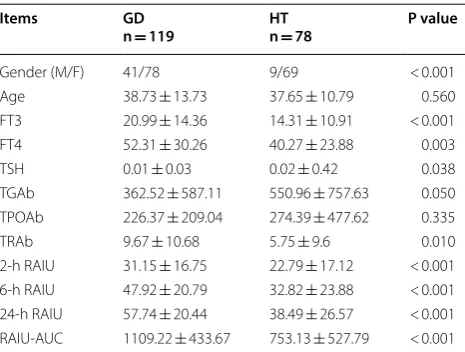
There was no significant difference between the two groups in age and TPOAb (P > 0.05). The levels of FT3, FT4 and TRAb in GD patients were significantly higher than those in HT group (P < 0.05). The level of TGAb in HT group was significantly higher than that in the GD group (P = 0.05). The RAIU at 2 h, 6 h, 24 h in the GD group was significantly higher than in the HT group. The area under the curve (AUC) for RAIU in GD group was significantly higher than that in HT group (Table 1).
Table 1 Clinical feature of the study subjects
M: male; F: female; GD: Graves’ disease; HT: Hashimoto’s thyroiditis; FT3: free T3; FT4: free T4; TSH: thyroid stimulating hormone; TGAb: thyroglobulin antibody; TPOAb: thyroid peroxidase antibodies; TRAb: thyrotropin receptor antibody; RAIU: radioactive iodine uptake; AUC: area under the curve
Items GD
n = 119 HTn = 78 P value
[image:2.595.305.538.513.689.2]Pathological diagnosis
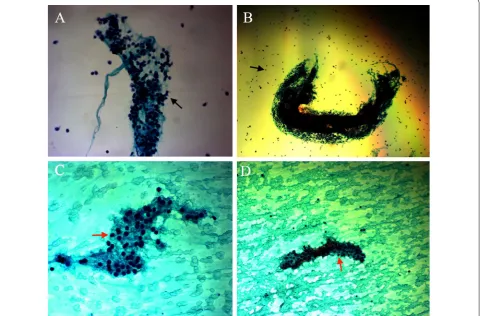
Pathological results were used to diagnose GD and HT in this study. HT’s pathological diagnosis is based on fre-quent occurrence of polymorphic lymphoid cells (small mature lymphocytes, larger activated lymphocytes, and occasional plasma cells) and Hürthle cells, and charac-terized by the different ratio of these two types of cells (Fig. 1) [15]. Hyperthyroidism is diagnosed according to the pathological reports of follicular cells (single-layered, honeycomb), glia, and phagocytic cells (Fig. 1).
Establishment of clinical diagnosis regression model Various clinical features of the patients with hyperthy-roidism were put into the model as the independent variables. Model 1 was subjected to stepwise regression analysis. After screening, the variables that entered the model included FT3, TGAb, TPOAb, TRAb, 2-h RAIU, 24-h RAIU and gender, in which the variables FT3, TGAb, TRAb, 2-h RAIU, 24-h RAIU, and gender were significantly different (P < 0.05).
Model 2 without RAIU was also subjected to stepwise regression analysis. After screening, the variables that
entered the model included FT4, TGAb, TPOAb, TRAb and gender, all of which were statistically significant. The larger the value of each variable in the two models indi-cated the higher probability to diagnose GD. Table 2 showed the regression coefficients and risk scores for each variable. The equations for the two models are as follows:
Model 1
Model 2
Area under the curve (AUC)
The area under the ROC curve ranged from 0.5 to 1.0. AUC < 0.7 indicated that the diagnostic accuracy was low;
Logit P=0.0399∗FT3−0.0008∗TGAb
+0.0709∗TRAb−0.0783∗X2h+ 0.0789∗X24h
−1.9153∗Gender+1.2281
Logit P=0.0219∗FT4−0.0012∗TGAb−0.0011∗TPOAb + 0.0518∗TRAb−1.8257∗Gender+3.0511
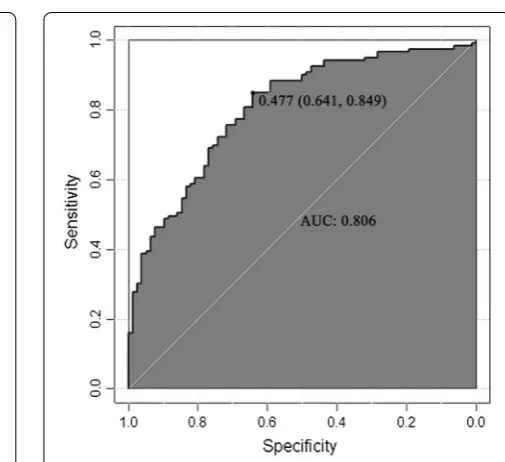
[image:3.595.59.541.382.698.2]while AUC > 0.8 suggested that the model had a good diagnostic value. As shown in Fig. 2, AUC of model 1 was 0.843 (95% CI 0.779–0.894), and AUC of model 2 was 0.806 (95% CI 0.685–0.824) (Fig. 3), suggesting that both models had good differential diagnostic value.
Determination of diagnostic cutoff point
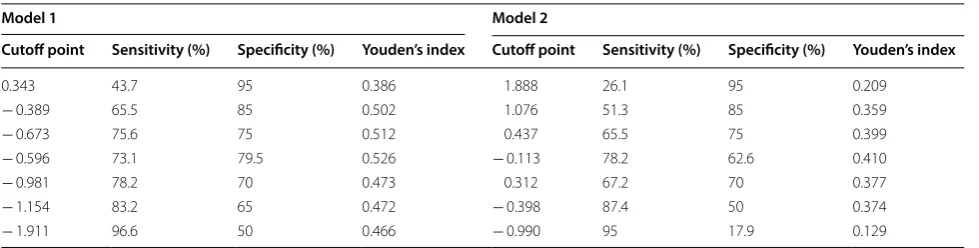
[image:4.595.56.542.99.247.2]The sensitivity and specificity analysis of the different diagnostic cutoff points for the two models are shown in Table 3. The maximum value of the Youden’s index is the best value for sensitivity and specificity.
In model 1, the sensitivity and specificity for diagnosis of GD were 73.1% and 79.5%, respectively when the cutoff
point was > − 0.596. When the cutoff point was < − 0.596, HT was diagnosed.
In model 2, the sensitivity and specificity for the diag-nosis of GD were 78.2% and 62.6%, respectively when the cutoff point is > − 0.113. In contrast, when the cutoff point was < − 0.113, HT was diagnosed.
Discussion
AITD is caused by dysregulation of the thyroid immune system. AITD is an organ-specific autoimmune disease mediated by T lymphocytes [1, 16]. AITD includes two major clinical manifestations: GD and HT, both of which are characterized by infiltration of thyroid parenchymal Table 2 Regression coefficients and risk scores for each variable
β: regression coefficient; OR: odds ratio; “–”: not applicable; FT3: free T3; FT4: free T4; TGAb: thyroglobulin antibody; TPOAb: thyroid peroxidase antibodies; TRAb: thyrotropin receptor antibody; X2 h: 2-h RAIU; X24 h: 24-h RAIU; AUC: area under the curve
Items Model 1 Model 2
β OR P β OR P
FT3 0.0399 1.0407 0.013935 – – –
FT4 – – – 0.0219 1.0221 0.000941
TGAb − 0.0008 0.9992 0.004100 − 0.0012 0.9988 5.94E − 05
TPOAb – – – − 0.0011 0.9989 0.030917
TRAb 0.0709 1.0734 0.000484 0.0518 1.0532 0.005661
X2 h − 0.0783 0.9247 0.000162 – – –
X24 h 0.0789 1.0821 5.04e − 08 – – –
Gender − 1.9153 0.1473 0.000152 − 1.8257 0.1611 0.00013
AUC 0.843 0.806
[image:4.595.44.544.292.531.2] [image:4.595.283.536.293.524.2] [image:4.595.56.298.295.524.2]lymphocytes and elevation of thyroid antibodies. The clinical features of GD and HT are mainly thyrotoxico-sis and hypothyroidism, respectively. Epidemiological data suggest that the interaction between genetic sus-ceptibility and the environment is a key factor for the occurrences of GD and HT. However, the mechanism of pathogenesis is still not clear.
It is still difficult to make differential diagnosis of GD and HT. The main clinical manifestation of GD is hyper-thyroidism, while the clinical features in the early stage of HT also manifested by hyperthyroidism. At present, cli-nicians distinguish GD and HT mainly based on clinical characteristics, thyroid antibodies, and RAIU.
Generally, TPOAb and TGAb are mainly used to diag-nose HT, while TRAb is mainly used for the diagnosis of GD. About 70% of GD patients have positive TPOAb and TGAb. However, TRAb can also be significantly increased in HT patients [9]. TPOAb, TGAb, TRAb can only provide a reference for the clinical diagnosis of GD and HT. To confirm of the diagnoses, the measurement of TSAb and TSBAb is not clinically feasible despite of their accuracy. Similarly, the RAIU is increased in GD patients. Such increase in HT patients is not as high as GD patients, but there is no clearly defined range and cli-nicians can only judge based on clinical experience.
Therefore, for the initial onset of GD and HT, it may be difficult to differentiate, and so far there is no clear and objective diagnostic criterion in clinical practice. With-out properly and effectively guide clinical treatment, patients might accept the wrong treatment plan, leading to serious adverse consequences. Therefore, in this study, the pathological results were used as the basis for the diagnosis of GD and HT.
After screening, these two groups enter model 1 and 2 respectively. The larger value of each variable in the two models indicated the higher probability to diagnose GD. This is the first time to establish a differential diagnosis
model using the clinical features of GD and HT and related laboratory results.
From the perspective of area under the ROC curve of the two models, model 1 and model 2 have high diagnos-tic value for the identification of GD and HT. It is recom-mended to use − 0.596 as the cutoff point for diagnosing GD and HT when using Model 1. Similarly, it is recom-mended to use − 0.113 as the cutoff point to diagnose GD and HT when using model 2. If the AUC is greater than cutoff point, GD should be diagnosed. Conversely, if the AUC is less than the cutoff point, HT should be diagnosed. When the patient’s etiological analysis is not clear, our model can help clinicians make diagnosis based on readily available clinical data. Furthermore, the two models can be used to choose laboratory tests that can be performed (local hospitals usually have the ability to perform detection of thyroid antibodies).
However, there are also some shortcomings in our model. For example, model 1 is currently only applicable to hospitals that can carry out radionuclide scanning, and there are limitations for some local hospitals in China. In addition, due to the limited sample size, we have not yet verified the results for large sample sizes. Future studies will further optimize and verify the model.
Conclusions
In the present study, clinical indexes of GD and HT including FT3, FT4, TGAb, TPOAb, TRAb, 2-h RAIU, 24-h RAIU and gender were used to establish a clinical diagnostic model, which can quantitative assist for the diagnosis of GD and HT. Therefore, it helps clinicians differentiate GD and HT, making it easier and timelier to provide patients with optimal treatments.
Abbreviations
GD: Graves’ disease; HT: Hashimoto’s thyroiditis; RAIU: radioactive iodine uptake; ROC: receiver operating characteristic; AITD: autoimmune thyroid disease; TRAb: thyrotropin receptor antibody; TGAb: thyroglobulin antibody; TPOAb: thyroid peroxidase antibody; TSAb: thyroid stimulating antibody; Table 3 Sensitivity and specificity of the two models at each cutoff point
Youden’s index = sensitivity + specificity − 1, the maximum value is the optimal value
Model 1 Model 2
Cutoff point Sensitivity (%) Specificity (%) Youden’s index Cutoff point Sensitivity (%) Specificity (%) Youden’s index
0.343 43.7 95 0.386 1.888 26.1 95 0.209
− 0.389 65.5 85 0.502 1.076 51.3 85 0.359
− 0.673 75.6 75 0.512 0.437 65.5 75 0.399
− 0.596 73.1 79.5 0.526 − 0.113 78.2 62.6 0.410
− 0.981 78.2 70 0.473 0.312 67.2 70 0.377
− 1.154 83.2 65 0.472 − 0.398 87.4 50 0.374
[image:5.595.56.546.100.224.2]•fast, convenient online submission
•
thorough peer review by experienced researchers in your field
• rapid publication on acceptance
• support for research data, including large and complex data types
•
gold Open Access which fosters wider collaboration and increased citations maximum visibility for your research: over 100M website views per year
•
At BMC, research is always in progress.
Learn more biomedcentral.com/submissions
Ready to submit your research? Choose BMC and benefit from: TSBAb: thyroid stimulating blocking antibody; FT3: free T3; FT4: free T4; TSH:
thyroid stimulating hormone; AUC : area under the curve.
Authors’ contributions
ZC, ZW and TY designed the study, analyzed the data. ZC drafted the manu-script. TY, XL and YC performed the recruitment. XX performed the laboratory work. All authors read and approved the final manuscript.
Author details
1 Department of Endocrinology, The First Affiliated Hospital of Nanjing Medical
University, Nanjing 210029, People’s Republic of China. 2 Department of
Endo-crinology, The Affiliated Huaian NO.1 People’s Hospital of Nanjing Medical University, Huai’an 223300, People’s Republic of China.
Acknowledgements Not applicable.
Competing interests
The authors declare that they have no competing interests.
Availability of data and materials
The data and materials can be found from the first author, co-first authors and corresponding author.
Consent for publication Not applicable.
Ethics approval and consent to participate
The experimental protocol was approved by the Ethics Committee of the First Affiliated Hospital of Nanjing Medical University and conformed to the provi-sions of the Declaration of Helsinki (Ethical approval No. 2015-SR-227).
Funding Not applicable.
Publisher’s Note
Springer Nature remains neutral with regard to jurisdictional claims in pub-lished maps and institutional affiliations.
Received: 31 October 2018 Accepted: 31 December 2018
References
1. Antonelli A, Ferrari SM, Corrado A, Di Domenicantonio A, Fallahi P. Auto-immune thyroid disorders. Autoimmun Rev. 2015;14(2):174–80.
2. Jacobson DL, Gange SJ, Rose NR, Graham NM. Epidemiology and estimated population burden of selected autoimmune diseases in the United States. Clin Immunol Immunopathol. 1997;84(3):223–43. 3. Tomer Y, Huber A. The etiology of autoimmune thyroid disease: a story of
genes and environment. J Autoimmun. 2009;32(3–4):231–9.
4. Topliss DJ. Clinical update in aspects of the management of autoimmune thyroid diseases. Endocrinol Metab (Seoul). 2016;31(4):493–9.
5. Sarfo-Kantanka O, Kyei I, Sarfo FS, Ansah EO. Thyroid disorders in central ghana: the influence of 20 years of iodization. J Thyroid Res. 2017;2017:7843972.
6. Shukla SK, Singh G, Ahmad S, Pant P. Infections, genetic and environ-mental factors in pathogenesis of autoimmune thyroid diseases. Microb Pathog. 2018;116:279–88.
7. Ohye H, Nishihara E, Sasaki I, Kubota S, Fukata S, Amino N, et al. Four cases of Graves’ disease which developed after painful Hashimoto’s thyroiditis. Intern Med. 2006;45(6):385–9.
8. Champion B, Gopinath B, Ma G, El-Kaissi S, Wall JR. Conversion to Graves’ hyperthyroidism in a patient with hypothyroidism due to Hashimoto’s thyroiditis documented by real-time thyroid ultrasonography. Thyroid. 2008;18(10):1135–7.
9. Furqan S, Haque NU, Islam N. Conversion of autoimmune hypothyroidism to hyperthyroidism. BMC Res Notes. 2014;7:489.
10. Dunne C, De Luca F. Long-term follow-up of a child with autoimmune thyroiditis and recurrent hyperthyroidism in the absence of TSH receptor antibodies. Case Rep Endocrinol. 2014;2014:749576.
11. Umar H, Muallima N, Adam JM, Sanusi H. Hashimoto’s thyroiditis follow-ing Graves’ disease. Acta Med Indones. 2010;42(1):31–5.
12. Effraimidis G, Wiersinga WM. Mechanisms in endocrinology: auto-immune thyroid disease: old and new players. Eur J Endocrinol. 2014;170(6):R241–52.
13. Takasu N, Matsushita M. Changes of TSH-stimulation blocking antibody (TSBAb) and thyroid stimulating antibody (TSAb) over 10 years in 34 TSBAb-positive patients with hypothyroidism and in 98 TSAb-positive Graves’ patients with hyperthyroidism: reevaluation of TSBAb and TSAb in TSH-receptor-antibody (TRAb)-positive patients. J Thyroid Res. 2012;2012:182176.
14. Diana T, Krause J, Olivo PD, König J, Kanitz M, Decallonne B, et al. Preva-lence and clinical relevance of thyroid stimulating hormone receptor-blocking antibodies in autoimmune thyroid disease. Clin Exp Immunol. 2017;189(3):304–9.
15. Harvey AM, Truong LD, Mody DR. Diagnostic pitfalls of Hashimoto’s/ lymphocytic thyroiditis on fine-needle aspirations and strategies to avoid overdiagnosis. Acta Cytol. 2012;56(4):352–60.