www.ijaer.in Copyright © IJAER 2017, All right reserved Page 3709
A COMPARATIVE ANALYSIS OF CONTRACT-FISHERMEN CATCH
LEVELS IN AKWA IBOM STATE, NIGERIA.
*1Namso N. Frank, 2Gabriel S. Umoh and 1Damian Agom
1Department of Agricultural Economics and Extension Akwa Ibom State University, Obio Akpa Campus.
2Department of Agricultural Economics and Extension, University of Uyo, Akwa Ibom State, Nigeria
*Corresponding author: Department of Agricultural Economics and Extension, Akwa Ibom State University, Ikot
Akpaden, Mkpat Enin, P.M.B. 1167, Uyo, Akwa Ibom State, Nigeria. Tel: +2348038292596, +2348085574288.
Received: 17/10/2016 | Accepted: 25/10/2016 | Published: 16/09/2017
ABSTRACT
Considering the erratic and unpredictable seasonal seining in artisanal fishing, several factors determine their catch level. One and the most important is availability and cost of credit. Fishermen find solace in contract fishing and modern contract theory of contract has been proven to be convenient because it can rationalise ex-post contract arrangement by considering cost and increase output to the fishers. To this test assumption, analysis of the output of current contract fishers, former contract fishers and those that have not been in contract were examined and compared. Results show that there significance difference on the output of contract/former contract fishers, contract/non contract fishers and former contract and non contract fishers. Contract fishing appears to be a promising institutional arrangement to facilitate fishermen access to an array of fishing inputs which they are typically excluded and it enhances catch level of the poor fishers. On determinants of catch level, the positive determinants of contract fishers were household size, credit, quantity of fuel used per trip and years spent working together by crew members whereas the only negative determinant was age. Former-contract fishermen catch level was positively determined by amount of credit and quantity of fuel used per trip while negative determinants were hours of labour and years spent working together. The positive determinants of non-contract fishermen’s catch level were: education level and amount of credit while the only negative determinant was year’s crew members spent working together.
www.ijaer.in Copyright © IJAER 2017, All right reserved Page 3710
INTRODUCTION
Nigeria, with an approximate coastline of 853 km2, maritime area of 46300 km2, inland water of
125470.82 km2 and a continental shelf of 0-200m depths is rich in virtually all fishery resources
(IFAD/CBNRMP, 2005). Nigeria’s annual fish demand is 1.5 million metric ton, with a per capita fish consumption of 7.5-8.5kg ((Federal Department of Fisheries (FDF), 2005). However, the estimated mean national production from 1985 - 2004 was 461,095 metric tons, as compared to a mean demand of 1,580,580 metric tons. The short-fall remained above 70% and is augmented by fish import at 700,000 – 900,000 metric tons annually, at an estimated cost of $400 million (FDF, 2005). This has precipitated low protein intake of below 8.5kg which is far below the FAO recommendation of 13kg per capita (FDF, 2005). The situation has not only affected the nutrition of the people, but also the financial resources of the people and the nation. The reason adduced for the enormous production – demand gap is lack of credit for the artisanal fishermen to boost production (FBS, 1992, Akanni, 2008). Though, the artisanal fishermen utilises “relatively” small amount of capital and energy, small fishing boats, make short fishing trips close to the shore and produced mainly for local consumption, they are responsible for 90% of the country’s fish production (FAO, 2007) and are among the poorest set of rural dwellers.
Most often, they are unable to support daily fishing activities and perpetually in a viscous web of low capital, income and productivity (Nwosu, 2004). Their average annual income is approximately US$400 per annum (p.a.), with a per capita and daily poverty line of US$115 p.a and poverty line of US$0.83 respectively. This was considerably less than the "absolute poverty
level of US$301 p.a. per capita and US$2.05 daily poverty line for rural areas accepted by FAO
and other UN-related bodies (Ben-yami, 2000).
www.ijaer.in Copyright © IJAER 2017, All right reserved Page 3711
of financing/repayment. Though this credit system seems expensive in financial – economic terms and tends to keep the borrower in a constant dependence on the creditor, according to Ben-yami, (2000), “it is part of the fisherfolk’s life and is absolutely necessary for the least fishing activity”. He reported that a loan of Two Thousand Naira (N2000) attracted an annual interest of 147% (N1167).
According to IFAD (2005) project assessment appraisal, dearth of fishing equipment due to lack of credit has a significant negative effect on artisanal fish landings. Ben-yami (2000) reported that the injection of credit in the form of inputs/cash, improves the catch level of fishers. This is because technical improvement of sea-going and capture capabilities enhances access to the large and reasonable stable resources of small pelagics (shadow waters living fishes) and increase capability to go for dermersal (bottom sea living fishes) stocks. These two independent assertions point to the importance of credit in the improvement of both quality and quantity of artisanal fisher’s catch.
One of the major attractions of contract fishing for the artisanal fishers is the availability of credit provided either as fishing inputs or cash to increase the catch level of the artisanal fishers. Credit provision in form of fishing inputs addresses fixed fishing input(s) costs whereas credit provision in form of cash addresses variable fishing costs. An estimated average fixed and variable costs of N157,643 and N3,650 for contract and non contract fishers (without outboard engine) was reported in Akwa Ibom State by Inakan (2002). This precipitated a monthly average income of N112,697 and N50,560 for contract and non contract fishers respectively. The contract/non contract monthly income difference, estimated at 123% increase is attributed to accessibility of credit either as fishing inputs or cash. Therefore, contract fishing is expected to increase the artisanal fish landings, his income, standard of living and wealth.
Empirical studies on catch level (output) of artisanal fishermen abound, such studies include;
Akanni, (2008), Anene, et al., (2010), Nafisat, et al., (2011), Ogunbameru, (2012) and Kareem,
et al., (2013) among others. Their comparative output analysis is either based on boat capacity
(motorised and non-motorised), skills of the skipper or type of water bodies exploited etc. Though, artisanal contract fishing has been reported in the Philippines (Carnaje, 2007) and
Kenya (Howe, 2008), these studies eulogised contract fishing but basically addressed its modus
operandi. Preliminary Studies by Inakan, (2002) and Okon, (2003) points to the fact that contract
www.ijaer.in Copyright © IJAER 2017, All right reserved Page 3712
participation on fisher’s catch levels. The study attempts to bridge the apparent information gap in literature and provide sufficient empirical evidence to help policy on development of the artisanal fisheries business in Nigeria.
The objective of this paper was therefore to analyse the catch level of contract, former contract and non-contract fishermen by: - (i) evaluate the catch level (ii) analyse the wealth level (iii) examine the determinants of catch level for the three classes of artisanal fishermen in the study area.
STUDY AREA
This study was carried out in Akwa Ibom State, Nigeria. The State is located at latitude 4o33 and
5o33 North and longitude 7o35 and 8o25 East. By land mass, it is the tenth largest State in Nigeria with an area of 8,412 km2. It has a population of 3.92 million persons (National Population
Commission, 2006) with an average population density of 350 people km-2. The State is one of the core States in the Niger Delta region located in the South-South geo-political zone in Nigeria. It has the largest wetland in West Africa and the longest coastland in Nigeria which spans over 129km (IFAD-CBNRMP, 2005). The State is drained by three main rivers - Imo, Qua and Cross rivers. The Akwa Ibom coastline is dotted with many fishing communities (of variable sizes according to the number of fishing units (canoes) and number of fishermen. Some of are: Ifiayong, Eman in Uruan LGA, Ayadehe in Itu LGA, Esin-Ufot in Oron, Egbuhu in Mbo LGA,
Okorette in Ikot Abasi LGA. Within this fishing communities are some coastal settlements (ine)
with a significant concentration of multi-lingual artisanal fisher folks.
Sampling Techniques
www.ijaer.in Copyright © IJAER 2017, All right reserved Page 3713
Ibaka and Mkpan-Utong. Esuk Use, Esik Ikpaya, Utaku, Esin Ufot, Ine Moses, Ine Gowon, Ita Abasi among others. The last stage of sampling was the random selection of four fishermen each from the selected eight fishing settlements. This started with identification of the fishermen’s organisation at each fishing settlement. The chair persons from these organisations were contacted and interviewed. The chair persons identified each members based on their credit status – currently on contract, former contract and non contract fishermen. From the identified fishers, four of them were randomly selected from each settlement. The selected fisher’s consent were sought and obtained (oral) through the chair persons of the organisation and the pre-tested questionnaires administered by trained and resident enumerators who are familiar with the language and customs in the study areas. Each questionnaire had three sections – for fishers on contract, former contract and non contract. It was based on the contract status of each fisherman that the relevant section was filled. Two hundred and forty (240) questionnaires were administered out of which 232 were retrieved giving a response rate of 97%. The discarded questionnaires were based on incomplete/inconsistence information. A total of 91 contracts, 80 former and 61 non fishers were interviewed. The 232 were used for the analysis.
Primary data was used for the analysis. The relevant primary data were obtained through survey of the study area. Primary data of interest were: the demographics, value of credit collected, weight of fisher’s landings, quantity of fuel utilised, daily fisher’s sales value, hours spent in fishing, type of labour used and years crew members spent working together. Output of fishermen, estimated as the weight of their daily catch was obtained at the landing beach (fish trading centre). Basically, the fish mammies have two sizes of baskets which they used in quantifying the fisher’s wares. The fish weight per basket was measured using a weighing balance and noted. Subsequent fish weight per day was based on this estimation. However, daily fish value (Naira) was obtained by interviewing each respondent.
Analytical Techniques
Analysis of Variance (ANOVA) statistics was employed to test the mean differences in output of contract, former contract and non-contract fishermen. The model as given by (Webster, 1992) is given below:
Analysis of Variance (ANOVA)
Source df SS Ms F-cal F-tab
Treatment (Contract) c-1
Block (Former) r-1
Residual (Non–contract) (n-1)(r-1)
www.ijaer.in Copyright © IJAER 2017, All right reserved Page 3714
Least Significant difference (LSD) for unbalanced designs was used for the verification of the mean differences. This was because the number of observations was not the same in every sample (classes of fishermen). It compares the LSD criterion to the absolute difference in sample means. The formula is given below:
LSDjk = √[1
𝑟𝑗+ 1
𝑟𝑘](𝑀𝑆𝐸)𝐹∝1, 𝑛 − 𝑐 (Webster, 1992)
Where: rj is the number of observation in the jth sample and rk is the number of observation in
the kth sample. MSE is the mean error square, c is the number of samples, n is the total number of observation in all samples combined, 𝐹∝1, 𝑛 − 𝑐 is the F range probability distribution at α confident interval with 1 and n-c degree of freedom.
Regression: Theoretically stated, output in contract situation is a function of both characteristics of the principal, the agent and the characteristics of the task itself. This studies regresses some of these characteristics against the catch weight of the fishermen to assess its impact. The mathematical modelled in linear form is as shown in equation:
Y = βo+ β1Q1+β2Q2 +β3Q3+………+ β8Q8 + β9Q9 + εi (Webster, 1992)
Where: Y = Output of fishermen, β1, β2, β3, β4, β5…..β8 are the coefficients to be estimated, β0 is a
constant and εi is the error term. Y is the fishermen’s output (kg), Q1 is age of the fisherman
(years), Q2 is education level of the fisherman (years), Q3 is household size of the fisherman (no.
of persons), Q4 is No. of Extension visits to the fisherman, Q5 is amount of credit taken by
fisherman (Naira), Q6 is hours of labour per fishing trip of the fisherman (hours), Q7 is quantity of
fuel use by the fisherman per trip (litres), Q8 is years crew spent working together with the
fisherman (years).
RESULTS AND DISCUSSIONS
Socio–demographic Characteristics of Respondents: Some important socio- demographic characteristics of artisanal fishermen in Akwa Ibom State considered in this study are given below:
www.ijaer.in Copyright © IJAER 2017, All right reserved Page 3715
because people in this age range are full of vigour. This is in tandem with the reports of Udo and Nyienakuna (2008), Ayanwu, Mkpado and Ohaka (2009).
Education: Result of analysis on educational level of the respondents in the study area (Table 1), shows that the modal educational group for contract and former-contract fishers was primary level while that of the non-contract fishers was no formal education. The contract, former contract and non-contract fisher’s no formal educational status was represented by 12%, 29.51% and 45% respectively. Education is said to be the bedrock of development and educated farmers are said to enjoy increase production through access to credit, information and other inputs. This was expected of fishers in the study area. Though, Costales, Son, Lapar and Tioncgo (2008) opined that contracting is based on reputation and trust, and not on educational status, they were of the opinion that education enhances innovations and productivity.
Table 1: Socio – Demographic Characteristics of Artisanal Fishermen in Akwa Ibom State.
S/N Variables Contract Former Contract Non Contract
1 Average Age of Fisherman (years) 21 – 30
31 – 40 41 - 50 51 - 60 61 +1.00 Total 40 years 11(12.09%) 41(45.05%) 29(31.87%) 10(10.99%) 0 (0.00%) 91 (100%) 45 years 5(8.20%) 16(26.23%) 31(50.82%) 5(8.20%) 4(6.56%) 61(100%) 49 years 07(8.75%) 21(26.25%) 39(48.75%) 10(12.5%) 3(3.75%) 80 (100%)
2 Educational Level of Fishermen (%) No formal Education
www.ijaer.in Copyright © IJAER 2017, All right reserved Page 3716 3 Average Household size of Fishermen (Persons)
1 – 2 3 – 4 5 - 6 7 – 8 9 + 1.00
Total 6 Persons 3 (3.30%) 26 (28.57%) 39 (42.86%) 12 (13.19%) 11 (12.09%) 91 (100%) 6 Persons 2 (3.28%) 11 (18.03%) 31 (50.82%) 11 (18.03%) 6 (9.84%) 61 (100%) 5 Persons 7 (8.75%) 27 (33.75%) 24 (30.00%) 19 (23.75%) 3 (3.75%) 80 (100%)
4 Source of Credit (Frequency) Percentage credit from Bank
Percentage credit from Cooperatives Society Percentage credit from Money Lenders Percentage credit from Family Members Percentage credit from Etibe (Contribution) Percentage credit from Church
Total 1 (1.00%) 16 (17.58%) 18 (19.78%) 11 (10.68%) 56 (54.36%) 1 (1.00%) 103 (100%) 0 (0.00%) 24(22.22%) 11(10.19%) 12(11.11%) 61(56.48%) 0(0.00%) 108(100%) 1(1.00%) 15(14.42%) 26(25.00%) 12(11.54%) 51(49.04%) 1(1.00%) 104(100%)
5 Duration of fishing trip per day 4 - 5 Hours
6 –7 Hours 8 –9 Hours 10 + 12.000 Hours
Total 10 (10.99%) 18 (19.78%) 20 (21.99%) 43 (47.25%) 91 (100%) 15 (24.59%) 17 (27.87%) 11 (18.03%) 18 (29.51%) 61 (100%) 22 (27.50%) 21 (26.25%) 14 (17.5%) 23 (28.75%) 80 (100%)
6 Average catch per fishing trip Below 10kg 11- 20 kg 21- 30kg 31- 40kg Above 40kg
Total 2 (2.20%) 9 (8.89%) 16 (17.58%) 25 (27.47%) 39 (42.86%) 91 (100%) 3 (4.92%) 07 (11.48%) 20 (32.79%) 14 (22.30%) 17 (27.87%) 61 (100%) 8 (10.00%) 15 (18.75%) 19 (23.75%) 16 (20.00%) 22 (27.50%) 80 (100%) 7 8
Area of Operation
Coastal and brackish Water Inland Waters
Lake/Estuaries Ocean
Total
Asset Values (N)
22 (24.18%) 20 (21.98%) 1 (1.1%) 48 (52.75%) 91 (100%) 388,280.00 27 (44.26%) 10 (16.39%) 4 (6.56%) 20 (32.79%) 61 (100%) 437,666.00 32 (52.46%) 18 (22.50%) 27 (33.75%) 3(3.75%) 80 (100%) 280,053.50
www.ijaer.in Copyright © IJAER 2017, All right reserved Page 3717
Household size: Household size distribution shows that the modal household size for contract and former contract fishers was 5-6 persons, while that of those who have never been in contract was 3-4 persons. The average household size of contract, former contract and non-contract fishers are 5, 5 and 6 persons respectively. This was expected because agricultural households are characterized by high number of household members (Pollnac, 1988). Similarly, the household size of the fishers was also noted to have high number of persons. Though, this helps to increase the output of fish production if a good number are into the fishing work, however, a substantial amount of fish is also used for household consumption, thereby reducing the overall household income (Udo and Nyienakuna, 2008). This is indicative of why heads of larger household sizes will readily opt for contracting. This result is similar to that Cai, Ung, Setboonsarng and Leung (2008) with Cambodia contract rice farmers.
Sources of Credit: Findings of the study reveals that majority of the fishers sourced their credit
from personal savings (etibe) as represented by 54.36% for contract, 56.485% for former
contract and 49.04% for non-contract fishers. The low percentage of sourcing funds from bank is
not only due to the ignorance of the fishers, but the reservation and bank’s credit conditions for
agriculture in general and fishing in particular. Besides this, most of the respondents obtained funds from their family members indicating that fishing in the study area are operated as a family business (Udo and Nyienakuna,2008). The implication is that major sources of credit amongst the respondents are non-institutional and are devoid of administrative delays with less insistence on collateral securities. This finding is shared by Olayide, Ogunfowora, Essang, and Idachaba (1981).
Duration of Fishing Trip: Table1 shows that 10.99%, 24.59% and 27.50% of contract, former contract and non-contract fishers spend 4-5 hours per fishing trips respectively. Similarly, 19.78% of contract, 27.87% of former contract and 26.25% of non-contract fishers spend 6-7 hours per fishing trip. A total of 21.99%, 18.03% and 17.50% of contract, former contract and non- contract fishers were found to spend 8-9 hours per fishing trip. The possible explanation is that, the non contract fishers, fish around the estuaries and lakes thus, making up to two fishing trips a day. The contract fishers make one fishing trip a day because they operate at the oceans and oceanic suburbs.
www.ijaer.in Copyright © IJAER 2017, All right reserved Page 3718
modal catch per trip of contract and non contract fishermen was above 40kg while that of former contract fishers was 21-35kg. Though, Unal (2006) and Berkes (1986) were not comparing contract fishers, they independently reported an average catch weight of 33kg/day/two man boat and 20kg/day/two man boat respectively for Turkish marine and coastal fisheries. The higher catch weight of contract fishers is expected because of the type of the fishing inputs used by them, operating area, boat capacity/gadgets and inherent contract incentives. This argument holds for the differences in catch weight between former and non-contract fishermen. The implication is that catch weight increases as contracting is embraced by fishermen i.e contracting engenders increase in output. This finding is shared by Murray (2003) and Catelo and Costales (2004) in livestock production, Olomola (2010 b), Elepu and Nalukenge (2009), Stessens and Eeckloo (2004) in crops and Atherton and Kingdon (2000) on contract teachers output. They all subscribe to the fact that contracting engendered greater output and modern contract is a function of capitalisation (Carnaje, 2007).
Area of Operation: The modal area of operation of contract fishers is the ocean accounting for 52.75% meaning that more than half of the contract fishers operated in the oceanic suburb. This has implication on the type of fish caught, the boat capacity used and the duration of the fishing trip. The modal class of operation for former and non-contract fishers is the costal brackish water and are represented by 44.26% and 52.46% respectively. This implies that the former and non-contract fishers operated within the coastal waters perhaps because of their boat capacity and this has implication on the type of fish caught, the output and their income. The finding is similar to that of Evbuomwan, Sere-Ejembi, Bada,Momah and Sodipo (2004) who reported that fisher’s area of operation was a function of the entire boat capacity and that 65.1% of their respondents operated in the lagoon, 19.1% and 15.9% operated on coastal brackish water and ocean respectively.
Output (Catch Level) of the Fishers
The result of analysis of variance (ANOVA) from Table 2 shows that, contract fishermen with 323.506 sum of squares, 161.753 mean square and an F-value of 3.879 has a significantly difference output at 5% level. Non contract fishers with 33.270 sum of squares, 11.09 mean square and an F-value of 2.76 has no significantly difference output even at 5% level.
www.ijaer.in Copyright © IJAER 2017, All right reserved Page 3719
Table 2: Analysis of Variance for Output of the Artisanal Fishermen
Sum of squares df Mean square F-value F-tab(5%)
Treatment (CONOUTPUT) 323.506 2 161.753 3.879 3.15**
Block (NONOUTPUT) 33.2707 3 11.0902 0.266 2.76NS Residual (FOROUTPUT) 2251.56 54 41.6955
Total 2608.33 59 44.209
Source: Computer Extract, 2015
Table 3: Least Significant Different (LSD) at 0.01(99%)
Pair Wise Mean Comparison (Kg) Absolute pair mean LSDJK criterion
CONOUTPUT (37.53) – FOROUTPUT (30.33) 7.2kg 2.75
CONOUTPUT (37.53) – NONOUTPUT (25.63) 11.9kg 2.75
FOROUTPUT (30.33) – NONOUTPUT (25.63) 4.7kg 2.83
Source: Computer Extract, 2015
CONOUTPUT FOROUTPUT NONOUTPUT
Group Mean 37.53 30.33 25.63
FOROUTPUT = Former contract Fishermen Output, CONOUTPUT = Contract Fishermen Output
NONOUTPUT = Non-Contract Fishermen Output
www.ijaer.in Copyright © IJAER 2017, All right reserved Page 3720
reciprocates improved performance. Thus, the significance difference in the output of contract, former contract as well as non-contract fishers could be attributed to access to credit in form of fishing inputs.
Determinants of Artisanal Fishermen Catch Level
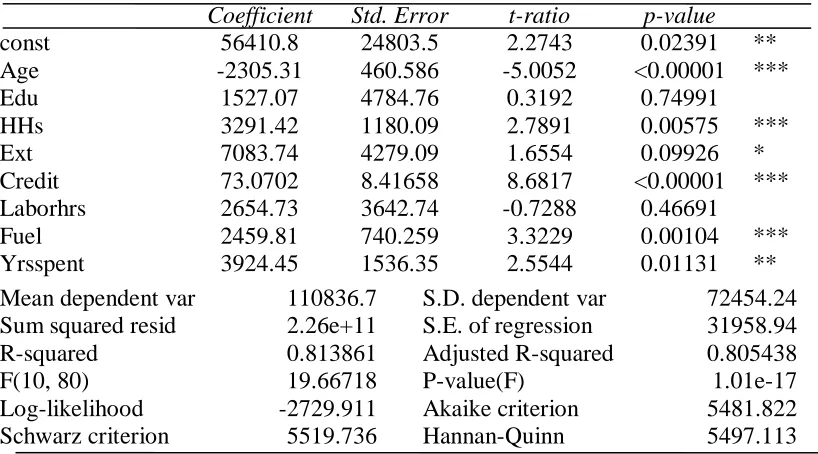
Contract Fishers: The result of the regression equation for contract fishers shows that age of the contract fishers was negatively correlated with the catch level of the contract fishers. The implication is that catch level of the contract fishers will increase with decrease in age of the fishers. The likely explanation is that the “principals” in contract fishing preferred younger reputable fishers for the business. This is because the younger fishers who are still in their prime can withstand the rigour of the sea/oceanic hazard and are zealous to owning personal inputs.
Table 4: OLS in full of Contract Fishermen
Coefficient Std. Error t-ratio p-value
const 56410.8 24803.5 2.2743 0.02391 **
Age -2305.31 460.586 -5.0052 <0.00001 ***
Edu 1527.07 4784.76 0.3192 0.74991
HHs 3291.42 1180.09 2.7891 0.00575 ***
Ext 7083.74 4279.09 1.6554 0.09926 *
Credit 73.0702 8.41658 8.6817 <0.00001 ***
Laborhrs 2654.73 3642.74 -0.7288 0.46691
Fuel 2459.81 740.259 3.3229 0.00104 ***
Yrsspent 3924.45 1536.35 2.5544 0.01131 **
Mean dependent var 110836.7 S.D. dependent var 72454.24
Sum squared resid 2.26e+11 S.E. of regression 31958.94
R-squared 0.813861 Adjusted R-squared 0.805438
F(10, 80) 19.66718 P-value(F) 1.01e-17
Log-likelihood -2729.911 Akaike criterion 5481.822
Schwarz criterion 5519.736 Hannan-Quinn 5497.113
Source: Extracted from computed print-out, 2014 (***, **,*. 1%, 5%, 10% sig. level)
www.ijaer.in Copyright © IJAER 2017, All right reserved Page 3721
sector. Fuel with positive sign could be explained by the fact that the contract fishermen explore the oceanic waters which is distance from their landing site. This may increase fuel consumption depending on the distance as compared to the exploitation of the lakes by non-contract fishers. Year spent working together by the fishers could be explain by the fact that the contract fishers recruited experienced skippers (employed) for their fishing expedition whereas the former and non – contract fishers used apprentices or family members for their fishing expedition. The model explains 81% of the data used.
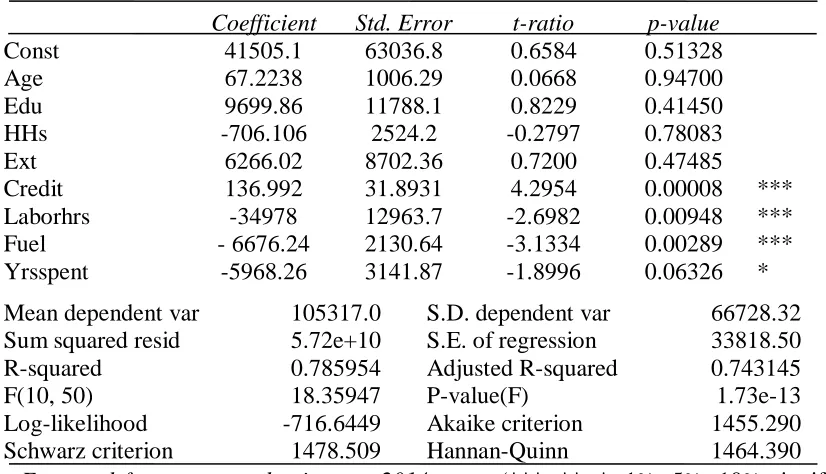
Former - Contract Fishers: The result of the regression equation for former-contract fishers shows that only hours of labour and years spent working together were the negatively signed
parameters. They had the expected a priori signed and were significant at 1% and 10% level. It
shows that hours of labour, fuel and years spent working together of the former-contract fishers were negatively correlated with their catch level. This implies that catch level of the former-contract fishers will increase with decrease in hours of labour and years spent working together. The negative hours of labour spent in fishing by the former contract fishers is likely due to time spent in transit to and from the real fishing waters. Field survey confirms that substantial catch could only be done in deep surrounding waters and these waters are distance from the fisher’s operational base.
Table 5: OLS of Former - Contract Fishermen
Coefficient Std. Error t-ratio p-value
Const 41505.1 63036.8 0.6584 0.51328
Age 67.2238 1006.29 0.0668 0.94700
Edu 9699.86 11788.1 0.8229 0.41450
HHs -706.106 2524.2 -0.2797 0.78083
Ext 6266.02 8702.36 0.7200 0.47485
Credit 136.992 31.8931 4.2954 0.00008 ***
Laborhrs -34978 12963.7 -2.6982 0.00948 ***
Fuel - 6676.24 2130.64 -3.1334 0.00289 ***
Yrsspent -5968.26 3141.87 -1.8996 0.06326 *
Mean dependent var 105317.0 S.D. dependent var 66728.32
Sum squared resid 5.72e+10 S.E. of regression 33818.50
R-squared 0.785954 Adjusted R-squared 0.743145
F(10, 50) 18.35947 P-value(F) 1.73e-13
Log-likelihood -716.6449 Akaike criterion 1455.290
Schwarz criterion 1478.509 Hannan-Quinn 1464.390
Source: Extracted from computed print-out, 2014 (***, **, *. 1%, 5%, 10% significant
www.ijaer.in Copyright © IJAER 2017, All right reserved Page 3722
Fuel with negative sign could be explained by the fact that, most of the former contract fishermen were using the outboard engines bought for them by the former principals and the likelihood of increase fuel consumption could not be rule out. On the negative correlation of years spent working together, the likely explanation is that the former contract fishers used family members for their fishing expedition. Again, field survey confirms this and the response given by them is that; they had fully paid their loan and thus do owe nobody. The positive correlation of credit implies that increase credit will increase catch level of the fishers. This underscores the importance of credit in the artisanal fishing business. The likely explanation is that modern fishing is a function of capitalization and artisanal fishing capital is a function of credit from the private sector (Carnaje, 2007). The model explains 78% of the data used.
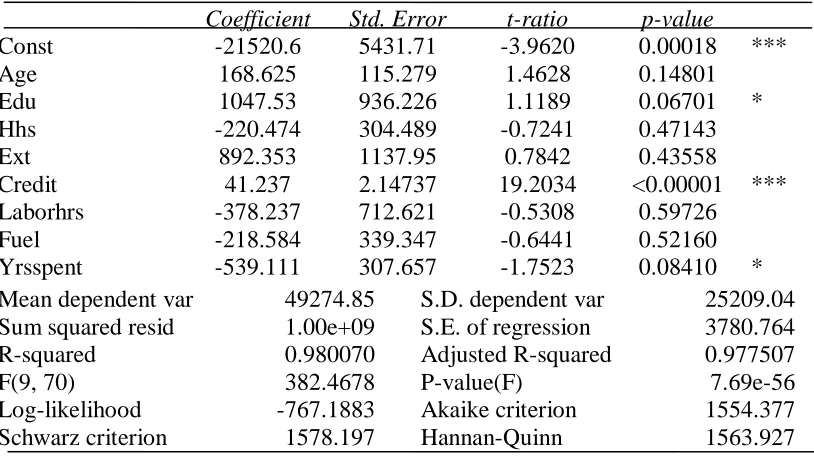
Non – Contract Fishers: The result of the regression equation for non - contract fishers shows that only years spent working together was the only negative significantly signed parameter. It had the expected a priori signed and was significant at 10% level. It shows that years spent working together of the contract fishers was negatively correlated with the catch level of the non contract fishers. The implication is that catch level of the non-contract fishers will increase with decrease in years spent working together of the fishers. The likely explanation is that the non – contract fishers used apprentices or family members for their fishing expedition. This is because they had no loan repayment at stake and their fishing is only for income and family consumption.
Table 6: OLS of Non - Contract Fishermen
Coefficient Std. Error t-ratio p-value
Const -21520.6 5431.71 -3.9620 0.00018 ***
Age 168.625 115.279 1.4628 0.14801
Edu 1047.53 936.226 1.1189 0.06701 *
Hhs -220.474 304.489 -0.7241 0.47143
Ext 892.353 1137.95 0.7842 0.43558
Credit 41.237 2.14737 19.2034 <0.00001 ***
Laborhrs -378.237 712.621 -0.5308 0.59726
Fuel -218.584 339.347 -0.6441 0.52160
Yrsspent -539.111 307.657 -1.7523 0.08410 *
Mean dependent var 49274.85 S.D. dependent var 25209.04
Sum squared resid 1.00e+09 S.E. of regression 3780.764
R-squared 0.980070 Adjusted R-squared 0.977507
F(9, 70) 382.4678 P-value(F) 7.69e-56
Log-likelihood -767.1883 Akaike criterion 1554.377
Schwarz criterion 1578.197 Hannan-Quinn 1563.927
www.ijaer.in Copyright © IJAER 2017, All right reserved Page 3723
Education and credit were positively signed and it implies that an increase in educational level and credit will increase the catch level of the fishers. The importance of education and credit, and their likelihood to increase catch level of the fishers is reflected here. The model explains 98% of the data used.
Conclusion and Recommendation based on weak analysis and hence hard to interpret
From the study conducted and the analysis carried out, it is evident that contract fishing significantly affects the catch level of the fishermen in the State. If the importance of financing artisanal fisheries commends the result for careful consideration, the acceptability of contract fishing underscores the importance of agricultural credit for increase catch level in the artisanal fishery sub-sector of Akwa Ibom State and indeed Nigeria. Contract fishing appears to be a promising institutional arrangement to facilitate fishermen access to an array of fishing inputs which they are typically excluded. Although, credit is used as output-securing device, it enhances catch level of the poor fishers.
On determinants of catch level of contract fishers, the study concludes that some characteristics of the fishermen and other factors determine their catch level. For contract fishers the positive determinants were household size, credit, quantity of fuel used per trip and years spent working together by fishers whereas the only negative determinant was age. Former-contract fishermen catch level was positively determined by amount of credit while negative determinants were hours of labour, quantity of fuel used per trip and years spent working together. The positive determinants of non-contract fishermen’s catch level were: educational level and amount of credit while the only negative significant determinant was year’s fishers spent working together.
The outputs of contract fishermen were found to be higher than that of others. Therefore, the study recommends increase in capitalization (in form of fishing inputs) for the fishers. The Growth Enhancement Scheme (GES) of the Nigerian Government should be modified to
accommodate the “artisanal fishery value chain” as requested by Memorandum 18 of 40th
Regular meeting of National Council on Agriculture and Rural Development (NCARD).
www.ijaer.in Copyright © IJAER 2017, All right reserved Page 3724
REFERENCES
Anene, A., Ezeh, C.I. and Oputa, C. O. (2010). Resource Use Efficiency of Artisanal Fishing in
Oguta, Imo State, Nigeria. Journal of Development and Agricultural Economics 2(3) 94-99
Akanni, K.A. (2008). Catch Levels and Capital Investment of Artisanal Fishermen in Lagos
State, Nigeria. Turkish Journal of Fisheries and Aquatic Sciences 8: 361-368.
Ben-Yami, M. (2000). Integration of Traditional Institutions and People’s Participation in
Artisanal Fisheries Development Project in South Eastern Nigeria. In: FAO Corporate
Document Repository. Http://www.fao/org/dorcep/004/y1290e/y1290ede.htm.of 10/4/2013
Carnaje, G. P (2007). Contractual Arrangement in Philippine Fisheries. Discussion Paper Series.
No. 2007-22. http://www.PIds.Gov.Ph. of 28/05/2010.
Eaton C, and Shepherd, A. W. (2001) Contract Farming: Partnership for Growth. In: FAO Services Bulletin 145. http://www.fao/dorcep/004/y0937e09. html. of 28/05/2010.
FAO (2007). Food and Agricultural Organisation. FID/CP/NIR. Nigerian Fishery Sub- Sector. http://www.fao.org/DORCEP/003/x6956E/x695302. htm. of 27/05/2010
Federal Department of Fisheries (FDF), (2005). Report of Presidential Committee on Fisheries
and Aquaculture Development. Consolidated Report of Federal Department of Fisheries,
Federal Ministry of Agriculture and Rural Development. Abuja (1):13-25
Federal Bureau of Statistics (FBS) (1992) Annual Abstract of Statistics: Federal Republic of Nigeria, Abuja. This may be too old
IFAD/CBNRMP (2005). International Fund for Agricultural Development / Community Based Natural Resource Management Programme. Niger Delta Appraisal Report. pp. 231 -239.
Kareem, R. O., Idowu, E. O. Williams, S. B, Ayinde, I, A, Bashir, N. O. (2013). Comparative Analysis of Motorized and Manually Propelled Technologies of Artisanal Fisheries in Ijebu Waterside of Ogun State. Sustainable Agriculture Research italics; 2(1). 133-142
Lunnddvall check spelling, K., Ochoro, W.O. and Hjalmarsson, L. (1998). “The Productivity of the Kenyan Manufacturing Sector.” In Bigstein, A. and P. Kimuyu (Eds.) The Structure
www.ijaer.in Copyright © IJAER 2017, All right reserved Page 3725
Marine Fisheries Review (1982): Nigerian Fisheries Sub Sector Development, 44(5): 25-35.
Moses, B. S. (1990) Akwa Ibom Agricultural Development Project (AKADEP). Studies and
Proposals for the Development of Akwa Ibom State Fisheries.No. 14: 23-50. This is over
20 year old is it appropriate for sample selection?
National Population Commission (NPC) (2006). The 2006 Population Census Official Gazette (Extraordinary), 24(94), National Population Commission Report. pp. 14-19.
Nafisat, B. I, Adekule, A. I., Nathanael, A. B., Otubusin, S. and Eunice, O. F. (2011). Effect of Socio-economic Factors on Fish Catch in Lower Ogun River, Isheri-olofin and Ihsasi, Ogun State, Nigeria. International Journal of Agricultural Management & Development italics, 1(4): 247-257.
Nigerian Agricultural Policy, (1980). The Policy Objectives for the Nigerian Fisheries. pp. 2-5.
Nwosu, A. C. (2004). Private Sector Initiatives in the Agricultural Sector, in Enhancing Private Sector-led Growth in Nigeria. In: Proceedings of the 13th Annual Conference of the
Regional Research Unit. Benin City, Nigeria 8-12th November. pp. 97-112.
Ondiege, P. O. (1996). Capital and Performance of Small Enterprise in Kenya”. In: Mukiri, W.
G. (eds.); Determinants of Access to Bank Credit by Micro and Small Enterprises in
Kenya. Partner, Beacon Consultant Services, Nakuru, Kenya. pp. 45-52.
Ogunbameru, A. (2012). Catch Level And Technical Efficiency In Coastal Fisheries Of Ogun
State, Nigeria. Jorind 10 (3), www.Transcampus.Org./Journals,
www.Ajol.Info/Journals/Jorind
Ovie, S. I and Raji, A. (2006) Food Security and Poverty Alleviation through Improved Valuation and Governance of River Fisheries in Africa. National Institute for Freshwater Fisheries Research Paper. New Bussa, Nigeria. pp. 3-8.
www.ijaer.in Copyright © IJAER 2017, All right reserved Page 3726
Umoh, G. S. and Frank, N. N. (2011). Contract Fishing: Filling the Niche in Agricultural Financing in Nigeria. In: Proceedings of the 12th Annual National Conference of NAAE,
Benin, Nigeria. pp. 159-165.
Young, H. P and Burke, M. A. (2000), Competition and Custom in Economic Contracts: A Case
Study of Illinois Agriculture. In: Center on Social and Economic Dynamics Working Paper