RESEARCH
Analysis of longitudinal semicontinuous
data using marginalized two-part model
Miran A. Jaffa
1*, Mulugeta Gebregziabher
3, Sara M. Garrett
4, Deirdre K. Luttrell
4, Kenneth E. Lipson
5,
Louis M. Luttrell
4and Ayad A. Jaffa
2,4Abstract
Background: Connective tissue growth factor (CTGF), is a secreted matricellular factor that has been linked to increased risk of cardiovascular disease in diabetic subjects. Despite the biological role of CTGF in diabetes, it still remains unclear how CTGF expression is regulated. In this study, we aim to identify the clinical parameters that modu-late plasma CTGF levels measured longitudinally in type 1 diabetic patients over a period of 10 years. A number of patients had negligible measured values of plasma CTGF that formed a point mass at zero, whereas others had high positive values of CTGF that were measured on a continuous scale. The observed combination of excessive zero and continuous positively distributed non-zero values in the CTGF outcome is referred to as semicontinuous data. Methods: We propose a novel application of a marginalized two-part model (mTP) extended to accommodate longitudinal semicontinuous data in which the marginal mean is expressed in terms of the covariates and estimates of their effect on the mean responses are generated. The continuous component is assumed to follow distributions that stem from the generalized gamma family whereas the binary measure is analyzed using logistic model and both have correlated random effects. Other approaches including the one- and two-part with uncorrelated and correlated random effects models were also applied and their estimates were all compared.
Results: Our results using the mTP model identified intensive glucose control treatment and smoking as clinical factors that were associated with decreased and increased odds of observing non-zero CTGF values respectively. In addition, hemoglobin A1c, systolic blood pressure, and high density lipoprotein were all shown to be significant risk factors that contribute to increasing CTGF levels. These findings were consistently observed under the mTP model but varied with the distributions for the other models. Accuracy and precision of the mTP model was further validated using simulation studies.
Conclusion: The mTP model identified new clinical determinants that modulate the levels of CTGF in diabetic subjects. Applicability of this approach can be extended to other biomarkers measured in patient populations that display a combination of negligible zero and non-zero values.
Keywords: Connective tissue growth factor, Longitudinal data, Marginalized two-part model, One-part model, Semicontinuous data, Two-part model, Type 1 diabetes
© The Author(s) 2018. This article is distributed under the terms of the Creative Commons Attribution 4.0 International License (http://creat iveco mmons .org/licen ses/by/4.0/), which permits unrestricted use, distribution, and reproduction in any medium, provided you give appropriate credit to the original author(s) and the source, provide a link to the Creative Commons license, and indicate if changes were made. The Creative Commons Public Domain Dedication waiver (http://creat iveco mmons .org/ publi cdoma in/zero/1.0/) applies to the data made available in this article, unless otherwise stated.
Open Access
*Correspondence: [email protected]
1 Epidemiology and Population Health Department, Faculty of Health Sciences, American University of Beirut, P.O.Box 11-0236, Riad El-Solh, 1107 2020 Beirut, Lebanon
Background
Diabetes mellitus is a progressive disease of the vascu-lature, leading to increased risk of both microvascular complications such as diabetic nephropathy (DN) and retinopathy (DR), and cardiovascular disease (CVD), including myocardial infarction and stroke [1, 2]. Emerg-ing evidence points to a mechanistic link between micro-vascular complications such as DN and DR and increased risk of cardiovascular disease [3–5]. Since early patho-logic events are similar within small and large vessels, it is postulated that common risk markers and mechanisms that initiate and promote vascular damage are involved. One such factor that has been identified as a pathogenic risk determinant for the development of microvascular and cardiovascular complications is connective tissue growth factor (CTGF). CTGF is a secreted matricellular potent chemotactic and extracellular matrix-inducing factor that has been implicated in progression of inflam-matory and fibroproliferative disorders [6]. Plasma CTGF levels were independently associated with hyperten-sion, increased albumin excretion rate, increased carotid intima-media thickness, hemoglobin A1c (HbA1c) and circulating levels of lipoproteins [7]. Plasma CTGF was also linked to increased risk of cardiovascular events and mortality in patients with atherosclerotic disease and was associated with plaque stabilization following stroke [8, 9]. Moreover, plasma CTGF levels were shown to pre-dict myocardial infraction in type 2 diabetic subjects [10]. Taken together, these studies suggest that CTGF may have substantial value both as a pathogenic risk marker of inflammation-induced tissue injury and as a therapeutic target.
Despite that the divergent biological effects of CTGF on the vasculature was established, it still remains unclear how CTGF expression is regulated. To gain insights into the factors that modulate plasma CTGF levels, circulat-ing levels of CTGF were measured longitudinally in type 1 diabetic patients over a period of 10 years. Our results indicated that a number of patients had negligible meas-ured values of plasma CTGF that formed a point mass at zero, and other patients had high values of CTGF that were measured on a continuous scale. The combina-tion of excessive zero and continuous positively distrib-uted non-zero values in the CTGF outcome observed in our study is referred to as semicontinuous data [11]. The cause behind the semicontinuous data of plasma CTGF may be attributed to factors or clinical covari-ates that either promote expression and release of CTGF and/or inhibition of CTGF in diabetic subjects. Hence, it is important to identify the clinical factors that asso-ciate with the odds of having detected non-zero CTGF values as well as determining the factors that correlate with CTGF levels. This clinical problem motivated our
research work in which we present different models for analysis of the semicontinuous CTGF data considered in this manuscript.
approaches considered in this manuscript included mar-ginalized two-part that we extend to accommodate longi-tudinal repeated measures data, two-part correlated and uncorrelated random effects, and one-part models. These models are advantageous in terms of feasibility of imple-mentation by using available statistical procedures such as SAS proc NLMIXED used for mTP and TP with corre-lated random effects, and SAS Proc Glimmix for TP with uncorrelated random effects compared to the other avail-able approaches which are complex and computationally intensive [12, 15] and require EM algorithms or Bayesian approaches to be implemented. Another advantage of the mTP when modelled for cross sectional data is that its estimates were consistent and unbiased [18].
To our knowledge, all studies that centered on CTGF as an outcome applied conventional statistical methods that ignore the zero part and just analyze the non-zero con-tinuous part. Ignoring the zeros will not allow for deter-mining the factors that affect the zero values of CTGF, and information from the zero component will not con-tribute to the likelihood function, which introduces bias to the estimation process.
The Marginalized two-part model implemented here is an extension of a previous work for cross sectional stud-ies by Voronca et al. [18] that we developed to analyze longitudinal semicontinuous data. This extension of the mTP model to longitudinal data with repeated measures imposes an added level of complexity due to the inclu-sion of random effects that account for the within-subject correlation. In addition, this extended model incorpo-rates higher dimensional variance–covariance matrix that accounts for the correlations between the random effects of the zero and non-zero processes. In specific, the within-subject correlation is accounted for by including correlated random effects in the binary and continuous parts. Random intercepts in both parts are jointly mod-eled in a marginalized likelihood function integrated over the random effects. Intercepts are the only random effect included in the overall specification of the mean. The marginal mean is parameterized directly in terms of regression coefficients using both zero and non-zero values and direct interpretation of the covariate effects on the marginal mean can be drawn for the entire pop-ulation and not conditional on the positive values. The generalized gamma family of distributions known for its flexibility to account for different types of data was incor-porated in our longitudinal model. In addition, we con-sidered the special cases of the generalized gamma that include standard gamma, Weibull, and lognormal. Gen-eralized gamma distribution is defined by parameters for the shape and scale that give it flexibility and appro-priateness to fit datasets with different skewness and asymmetry.
In the model’s section, we start first by describing the generalized gamma family of distributions, and the two-part models for longitudinal data with uncorrelated and correlated random effects. We then describe the margin-alized two-part model with genermargin-alized gamma and other distributions that stem from this family, and the one-part model that analyzes the whole data with zeros and non-zeros. These models were applied to a cohort of diabetic patients with CTGF measures as the outcome of interest that motivated this study.
Study population
Plasma CTGF levels were measured on 693 subjects from the Diabetes Control and Complications Trial (DCCT)-cohort of type 1 diabetes [19]. The patients enrolled in the DCCT study between 1983 and 1989 and half of the subject population was randomly assigned to conven-tional diabetes treatment and the other half was assigned to intensive diabetes treatment. In 1993, the DCCT study was stopped when intensive treatment was clearly shown to reduce the risks of microvascular complications [20]. The DCCT study was approved by the Institutional Review Boards of all participating DCCT centers and all participants provided written informed consent. Clinical factors such as blood pressure, HbA1c, lipoprotein, dura-tion of diabetes, and demographic factors such as age, gender, and smoking were all collected on these patients and were used as covariates in our analysis to assess their effects on CTGF levels.
CTGF measurement
Plasma CTGF levels were measured longitudinally at baseline [study entry (1983–1989)], mid-point of DCCT (1988–1991) and end of DCCT (1993) with a sand-wich ELISA that detects both intact CTGF, and cleaved CTGF to release the N-fragment of CTGF (N + W-CTGF
assay). The capture antibody is human anti-human CTGF-domain 1 and the detection antibody is mouse anti-human CTGF-domain 2 (FibroGen, San Francisco, CA, USA). Standard curve was prepared with rhCTGF (CTGF expressed in CHO cells and affinity purified with an anti-CTGF antibody column, FibroGen, San Fran-cisco, CA USA). Absorbance at 405 nm was acquired on a SpectraMax 340PC spectrophotometer and ana-lyzed with SoftMax Pro 4.8 software (Molecular Devices, Sunnyvale, CA, USA). The total CTGF values of the repeated measures (n = 1985) in all subjects throughout
the study are plotted in Fig. 1. The data shows that about 62% (n = 1231) of CTGF levels measured were negligible
The models
Four models were explored and illustrated: (1) two-part model for longitudinal data with uncorrelated random effects, (2) two-part model for longitudinal data with cor-related random effects, (3) marginalized two-part model, and (4) one-part model. We first start by describing the generalized gamma and the distributions that stem from this family which are the gamma, Weibull and lognormal distributions. These different distributions were considered for the continuous part of the Two-part models and the marginalized two-part model. As for the one-part model, these distributions were applied on the entire sample that has both the zero values and the continuous part altogether.
Generalized gamma family of distributions
We describe here the modeling framework of the gener-alized gamma distribution determined by three param-eters for the shape and scale. Specifications of these parameters result in certain distributions such as stand-ard gamma, lognormal, and Weibull. Thus, this family of distributions is appropriate to help understand the dependent variable and the process behind generating its values by comparing the model fit for each of the distri-butions and to select the best estimates using maximum likelihood approach in a regression framework.
The generalized gamma probability density function is specified as such:
(1) f
y;k,µ,σ
= η
η
σyΓ (η)√ηexp
u√η−ηexp k
u
,
where Γ (.) is the standard gamma function, u=sign(k)logy−µσ , for shape parameter k,
loca-tion parameter µ >0 and scale parameter σ >0 and
η=k
−
2
>0.
The sth moments of the GG distribution are specified as such:
And mean and variance are respectively
where C(σ,k)=σlog
k2
k +log
Γ1
k2 + σ
k
−logΓ1
k2
and
Specifications of σ and k result in different distribu-tions. When σ=k the gamma distribution is obtained, when k= 1 the Weibull distribution is obtained, and when k→ 0 the limiting distribution of the generalized gamma reduces to lognormal distribution.
Two‑part model for longitudinal data with uncorrelated random effects
The longitudinal two-part model can be described as such:
where Yij represents the observation for the positive con-tinuous outcome with a point mass at zero for the ith subject at the jth time point, πij=PrYij>0 is the probability of being non zero for the ith subject at the jth time point, and fYij;Xij′δ is the density function for
the positive values of Yij. The parameterization of this model is done in two parts that are fit separately:
In part 1 the binary outcome is modeled as
(2)
EYs=exp
µs+ sσlog
k2
k +log
Γ
1
k2+
sσ
k
−log
Γ
1
k2
(3) E(Y)=exp
µ+C(σ,k)
(4) Var(Y)=
�
exp(µ)k2σ/k �2
×
Γ�k12 +
2σ
k �
Γ�k12
� −
Γ�k12 +
2σ
k �
Γ�k12
�
−2
(5)
gTPYij=
1−π
ij if Yij=0
πijf
Yij;Xij′δ
if Yij>0
(6) logitPr
Yij>0
=logitπij=Z′ijα+b1i
Fig. 1 Histogram depicting the frequency of CTGF (ng/ml) levels
[image:4.595.57.293.87.315.2]where b1i represents the random effect intercept that accounts for the within subject correlation pertaining to the repeated measures for the same subject in the zero part
Assuming that the log for the g link function, the loca-tion parameter μij for the continuous component is mod-eled in the second part as
where b2i represents the random effect intercept that accounts for the within subject correlation pertaining to the repeated measures for the same subject in the con-tinuous part
The two random effect intercepts b1i and b2i in the two process of zero and non-zero are assumed to be inde-pendent and uncorrelated. Zij′ is the vector of covariates for the ith subject measured at the jth time point for the binary part and Xij′ is the vector of covariates for the ith
subject measured at the jth time point used for the con-tinuous part. The two parts might have common covari-ates or completely different ones. α is the vector of model coefficients corresponding to the binary part and δ is the vector of coefficients corresponding to the continuous part conditional on the values being non-zero.
The marginal mean and variance of Yij from a TP model can be derived as such:
When GG is assumed in the continuous part, the mar-ginal mean is
The variance of Yij corresponding to TP can be obtained using the variance formula in Eq. (10) and the sth moments for GG in Eq. (2). C is defined in Eq. (3) and its specifica-tion leads to the different distribuspecifica-tions that belong to
(7)
b1i=N
0,σb21
(8)
g
E
Yij|Yij >0=logµij|Yij >0=Xij′δ+b2i
(9)
b2i=N
0,σb22
(10)
EY
ij=πijEYij
Yij>0,VarYij
=πijEYij2 Yij >0
−πijEY
ij Yij>0
2
(11) E
Yij=πijexpµij+C(σ,k)
= 1
1+exp−zij′α
expXij′δ+b2i+C(σ,k)
the GG family of distributions. For instance, when C= 0 and σ=k then the GG distribution reduces to the TP-gamma distribution model for the continuous part; when C(σ )=log [Γ (1+σ )] and k= 1 then the TP-Weibull dis-tribution is obtained, and when C(σ )=σ22 and k→ 0 then the TP-lognormal distribution is obtained.
In the binary part, the estimates of the vector of coeffi-cients α represent population based averages for the whole population for the probability of positive values. When taken on an exponential scale, exp(α) can be interpreted as the odds ratio of having positive value for a one unit increase in the corresponding covariate. Meanwhile, in the continuous part the vector of coefficients δ are estimated for only those with positive non-zero values that represent a portion of the data and not the whole sample. When the log link is assumed in the continuous part, then conditional on the observation being non-zero, the exponential of the estimate of δ is the multiplicative change in the value of the outcome when the corresponding covariate increases by one unit. Hence, the binary part provides population esti-mates for the probability of non-zero, and the continuous part provides estimates for the effect on the population mean given that the value is non-zero.
Two‑part model for longitudinal data with correlated random effects
So far it was assumed that the intercepts in the two pro-cesses are the only random effect specified in the two-part model and that these random variables are independent. This assumption of independence leads to biased estimates in the regression coefficients and the variance components in the continuous part [21]. To correct this assumption the two random effects are assumed to be dependent and their correlation is included in the model specification and likeli-hood function. In this case the random effects are assumed to have joint distribution which could be the bivariate nor-mal distribution determined as such:
The binary part provides subject-specific estimates for the probability of obtaining non-zero values, and the continuous part provides subject-specific estimates of the conditional mean of log of the outcome provided the value is non-zero.
The estimation of Zi, Xi, and Σ can be estimated by maximizing the marginal of the log likelihood function that is integrated over the random effects that can be described as such:
bi= b
1i
b2i
=BVN
0 0
,Σ=
σb21 σ
2
b12
σb212 σ
2
where f represents the distribution function of the con-tinuous part of the outcome Y, and θ represents the bivariate normal distribution for the random intercepts.
Marginalized two‑part models (MTP) extended to longitudinal data
The longitudinal form of the probability density function (pdf) for an MTP model
gMTP can be written as such:
where πij is the probability of non-zero value for the out-come Yij and is obtained from a logistic model, thus it will take the form of πij=
expZij′α+u1i
1+expZij′α+u1i
and β representing
the vector of marginal coefficients corresponding to the continuous part of an MTP model, ui represents the cor-related random effect intercepts in both parts of MTP
The marginal mean is of the form
Solving for the location parameter of the GG distribu-tion in E(Yij) expressed in Eq. (11), we get the following parameterization:
(12) L=
i
1−πij|Zi,b1iI(Yij=0)πij|Zi,b1iI(Yij>0)fYij|Xi,b2iI(Yij>0)θ (bi|Σ )dbi
(13) gMTPYij=
1−π
ij if Yij=0
πijf
Yij;Xij′β,u2i
if Yij >;0
(14) ui=
u
1i
u2i
∼BVN
[0, 0],G=
σu12 σu122 σu122 σu22
(15)
E(Yij) = exp (Xi′β+u2i) =ξ
distribution model for the continuous part, when C(σ )=log [Γ (1+σ )] , and k= 1 the MTP-Weibull dis-tribution is obtained, and when C(σ )=σ22 and k→ 0 the MTP-lognormal distribution is obtained. The dis-tribution used in the continuous non-zero part of MTP should have a finite closed-form mean that can be param-eterized as in Eq. (16).
The binary part provides subject-specific estimates of the probability of having non-zero values for the outcome wherein the exponential of α is interpreted as the subject-specific odds ratio for having a non-zero response attrib-uted to a one unit increase in the respective covariate. The continuous part provides effects of the estimates on subject-specific and population mean for parameters cor-responding to covariates that are not included as random effects in the model’s specification. This specification was assumed in the correlated mTP model described earlier. Parameter estimates in the continuous part will only have subject-specific interpretation if the corresponding covari-ates are included as random effects. The exponential of the parameter β in the continuous part represents the multi-plicative effect on the overall mean for the whole popula-tion attributed to a one unit increase in the corresponding covariate X. The continuous component of the correlated marginalized Two-part model provides effects of the esti-mates on the entire sample, while that of the correlated Two-part model provides estimates of the effect on portion of the sample pertaining to the positive non-zero values.
Statistical estimation and inference for MTP longitudinal models
The general format of the likelihood function can be described as such:
(17)
L
π,µ, k,σ, G|y
=Π
i
1−πij|Zi,u1iI(Yij=0)πij|Zi,u1ifYij;k,µij,σ,u2iI(Yij>0)q(ui|G)
where f represents the pdf of the GG distribution or any other distribution from its family and q is the bivariate normal distribution for the random intercepts. Express-ing μij in terms of Eq. (16), and πij as denoted earlier, the marginal likelihood function for the GG distribution can be described as such
C is defined in Eq. (3) and its specification leads to the different distributions that belong to the GG fam-ily of distributions. For instance, when C= 0, and σ=k the GG distribution reduces to the MTP-gamma
(16)
where
In this likelihood function (Eq. 18), q(ui) represents the bivariate normal distribution for the random effects with mean vector of zeros and variance–covariance matrix G. The random effects ui are integrated out to get the mar-ginal likelihood function. The log of the marmar-ginal likeli-hood function is then maximized by taking the first derivative with respect to each parameter and setting the equation to zero to obtain the maximum likelihood esti-mate for each of the fixed effects, α, β, k, σ, G respectively. Empirical Bayes estimators using the adaptive Gaussian quadrature approach [22] was used to obtain predicted values of the random effects ui. The likelihood function for the standard Gamma, lognormal, and Weibull distri-butions are obtained in a similar manner by just replacing the distribution of the continuous non-zero part by the corresponding probability density function. The asymp-totic standard errors are computed using Fisher informa-tion after substituting the maximum likelihood estimates for α, β, k, σ, G corresponding to the MTP-GG model:
The marginal likelihood function is maximized using dual Quasi-Newton optimization [23].
One‑part model for longitudinal data
The one-part model does not distinguish between zero and non-zero values in the sense that it assumes that all values are generated from the same process and the con-cept of having a zero and non-zeros processes as in the Two-part models does not apply here. Hence, the one-part model analyzes both the zeros and non-zeros as one sample and produces parameter estimates for the whole data (for both the zero and non-zero values altogether).
(18) L�
α,β, k,σ, G|y�
=�
i
�
1−
1
1+exp�−Zij′α+u1i
�
I(Yij=0)
∗
�
�k
�
�−
2|k|−2
�
1+exp�−Zij′α+u1i
��
σYijΓ
��
�k
�
�−
2���
�k
�
�−
2exp
�
Q(α,β,σ,k)�
I(Yij>0)
q(ui)dui
Q(α,β,k,σ )=sign(k)logYij−
Xij′β+u2i−log
expitZij′α+u1i
−C(σ,k)
σ
k
−2
−k −
2
expklogYij−
Xij′β+u2i−log
expitZij′α+u1i
−C(σ,k)σ
(19)
Varα,ˆ β,ˆ kˆ,σˆ,Gˆ=diagI−1α,ˆ βˆ,kˆ,σˆ,Gˆ
The one-part model can be described as:
where b0i∼N
0,σb0i2 , γ is the vector of parameters for the fixed effect covariates Wij. The parameter estimates are generated for the entire sample using approaches such as quasi-likelihood generalized linear models that allow fitting of zero values, or by adding a small constant to the zero values [24]. The one-part model provides estimates of the population-based effects of parameters γ on the overall marginal mean, with the exponential of γ representing the multiplicative change on E(Yij) corre-sponding to a one unit increase in the respective covari-ate when the log link is assumed. It was established that this model results in less efficient, imprecise and biased estimates with inflated type 1 error [24, 25].
Results
The different models, mTP, TP with correlated random intercepts, TP with uncorrelated random intercepts wherein the zero and continuous parts are fit separately, and the one-part model that fits the zero and non-zero values together in one model and assumes that a single process generates these values, were all applied on the CTGF levels measured longitudinally presenting the out-come of interest. The objective was to identify factors that associate with the zero and non-zero processes that generate the CTGF values in order to gain insight on how these levels are regulated.
Three different distributions were assumed for the con-tinuous part of CTGF; gamma, lognormal and Weibull and their corresponding respective results are shown in (20) gEYij=log
Tables 1, 2, 3 wherein we included the slope estimates, its standard errors and P-values. The distribution that fits the data the most was the one that had the least meas-ures of fit, Akaike information criterion (AIC), Bayesian information criterion (BIC) and log Likelihood values. Gamma distribution had the lowest AIC, BIC and log likelihood values indicating that it fits best the data for mTP and TP with correlated random intercepts models (Table 4). Our results discussed in detail below indicated that mTP model gives parameter estimates that are con-sistent across all distributions while the other models had discrepancy in the hypothesis testing and inferences that were dependent on the distribution of the continuous measures. The models that appeared to have increased inconsistent, inaccurate and biased estimates are the one-part and two-part uncorrelated random intercepts models. The low coverage in the confidence interval and
the inflated type 1 error in the one-part model and the attributed bias in the estimates under this model and the uncorrelated two-part especially when zero values are prevailing in the data, explain some of the contradictory results observed in this study.
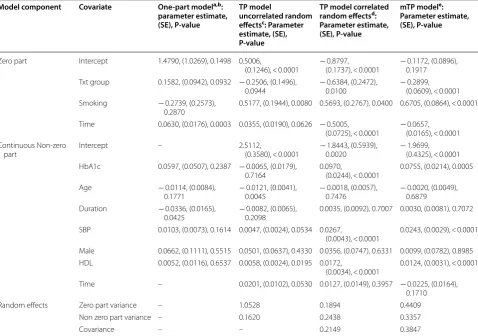
[image:8.595.59.538.124.460.2]Our results showed that smoking status was sig-nificantly associated with an increase in the probabil-ity of non-zero values for CTGF. Specifically smokers had higher odds of 1.7–1.96 of getting non-zero lev-els of CTGF than nonsmokers with P-values ranging between < 0.0001 and 0.04 depending on the model. This result was consistently demonstrated for mTP, TP with uncorrelated and correlated random effects models, and for all 3 distributions. This result suggests that smoking is associated with increased plasma CTGF levels in type 1 diabetic patients. This lends support to previous find-ings that CTGF expression levels in pulmonary vessels Table 1 Parameter estimates for one-part model, two-part (TP) model with uncorrelated random effects, TP with correlated random effects, and marginalized two-part (mTP) models assuming gamma distribution for the non-zero component
One-part modela fits the entire sample without distinction between zero and non-zero processes, so only one estimate for the intercept and one for time were generated. In one-part modelb the parameter estimates for txt group and smoking represent the effect of these covariates on the CTGF levels themselves and not on the probability of non-zero values, unlike the TP and mTP models. TP model uncorrelated random effectsc and TP model correlated random effectsd generate estimates for the continuous part using only a portion of the sample pertaining to positive non-zero values. mTP modele provides estimates for the parameters in the continuous part for the entire sample (zero and non-zero values)
Model component Covariate One‑part modela,b: parameter estimate, (SE), P‑value
TP model
uncorrelated random effectsc: Parameter estimate, (SE), P‑value
TP model correlated random effectsd: Parameter estimate, (SE), P‑value
mTP modele: Parameter estimate, (SE), P‑value
Zero part Intercept 1.4790, (1.0269), 0.1498 0.5006,
(0.1246), < 0.0001 − 0.8797, (0.1737), < 0.0001 − 0.1172, (0.0896), 0.1917 Txt group 0.1582, (0.0942), 0.0932 − 0.2506, (0.1496),
0.0944 − 0.6384, (0.2472), 0.0100 − 0.2899, (0.0609), < 0.0001 Smoking − 0.2739, (0.2573),
0.2870 0.5177, (0.1944), 0.0080 0.5693, (0.2767), 0.0400 0.6705, (0.0864), < 0.0001 Time 0.0630, (0.0176), 0.0003 0.0355, (0.0190), 0.0626 − 0.5005,
(0.0725), < 0.0001 − 0.0657, (0.0165), < 0.0001 Continuous Non-zero
part Intercept – 2.5112, (0.3580), < 0.0001 − 1.8443, (0.5939), 0.0020 − 1.9699, (0.4325), < 0.0001 HbA1c 0.0597, (0.0507), 0.2387 − 0.0065, (0.0179),
0.7164 0.0970, (0.0244), < 0.0001 0.0755, (0.0214), 0.0005
Age − 0.0114, (0.0084),
0.1771 − 0.0121, (0.0041), 0.0045 − 0.0018, (0.0057), 0.7476 − 0.0020, (0.0049), 0.6879 Duration − 0.0336, (0.0165),
0.0425 − 0.0082, (0.0065), 0.2098 0.0035, (0.0092), 0.7007 0.0030, (0.0081), 0.7072 SBP 0.0103, (0.0073), 0.1614 0.0047, (0.0024), 0.0534 0.0267,
(0.0043), < 0.0001 0.0243, (0.0029), < 0.0001 Male 0.0662, (0.1111), 0.5515 0.0501, (0.0637), 0.4330 0.0356, (0.0747), 0.6331 0.0099, (0.0782), 0.8985 HDL 0.0052, (0.0116), 0.6537 0.0058, (0.0024), 0.0195 0.0172,
(0.0034), < 0.0001 0.0124, (0.0031), < 0.0001 Time – 0.0201, (0.0102), 0.0530 0.0127, (0.0149), 0.3957 − 0.0225, (0.0164),
0.1710
Random effects Zero part variance – 1.0528 0.1894 0.4409
Non zero part variance – 0.1620 0.2438 0.3357
isolated from smokers was higher than those from non-smokers [26].
With respect to the impact of intensive glycemic treat-ment, its effect on the probability of non-zero values of CTGF varied between models and distributions. The mTP model consistently demonstrated its significant effects on the non-zero probability across all 3 distribu-tions. Patients that were on intensive glycemic treat-ment had 1.34 times lower odds of getting non-zero CTGF values compared to patients on standard treat-ment (P-values were < 0.0001, 0.0113, 0.0125). Hence, mTP model showed that intensive glycemic treatment is associated with increased probability of having negli-gible CTGF values. However, the effect of intensive gly-cemic treatment was not consistently observed in the TP model with correlated random effects in all 3 distri-butions. In Table 1, when the gamma distribution was
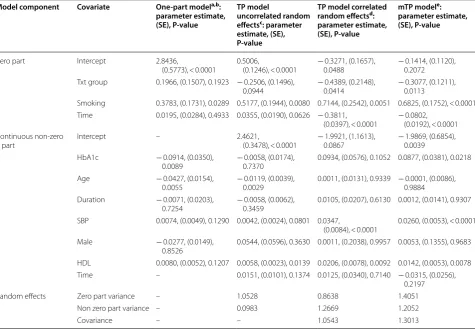
[image:9.595.61.537.124.453.2]used for the continuous measure and in Table 2 with the lognormal distribution, intensive glycemic treatment was significantly associated with decreased odds of hav-ing non-zero values for CTGF by about 1.6 times com-pared to patients on conventional glycemic treatment (P-values = 0.01 and 0.04). However, using the Weibull distribution for the continuous part (Table 3), intensive glycemic treatment had a borderline significant effect with P-value of 0.0509. Given that the gamma distribu-tion was the best fit for this data (AIC = 4279 Table 4), one can deduce that the odds of observing zero CTGF values is exp (0.6384) = 1.89 times higher in intensively treated patients compared to those on the conventional arm. On the other hand, the TP model with uncorrelated random effects failed to capture this significant associa-tion between the intensive glycemic treatment group and the probability of non-zero values (P-value = 0.0944). The Table 2 Parameter estimates for one-part model, two-part (TP) model with uncorrelated random effects, TP with correlated random effects, and marginalized two-part (mTP) models assuming lognormal distribution for the non-zero component
One-part modela fits the entire sample without distinction between zero and non-zero processes, so only one estimate for the intercept and one for time were generated. In one-part modelb the parameter estimates for txt group and smoking represent the effect of these covariates on the CTGF levels themselves and not on the probability of non-zero values, unlike the TP and mTP models. TP model uncorrelated random effectsc and TP model correlated random effectsd generate estimates for the continuous part using only a portion of the sample pertaining to positive non-zero values. mTP modele provides estimates for the parameters in the continuous part for the entire sample (zero and non-zero values)
Model component Covariate One‑part modela,b: parameter estimate, (SE), P‑value
TP model
uncorrelated random effectsc: parameter estimate, (SE), P‑value
TP model correlated random effectsd: parameter estimate, (SE), P‑value
mTP modele: parameter estimate, (SE), P‑value
Zero part Intercept 2.8436,
(0.5773), < 0.0001 0.5006, (0.1246), < 0.0001 − 0.3271, (0.1657), 0.0488 − 0.1414, (0.1120), 0.2072 Txt group 0.1966, (0.1507), 0.1923 − 0.2506, (0.1496),
0.0944 − 0.4389, (0.2148), 0.0414 − 0.3077, (0.1211), 0.0113 Smoking 0.3783, (0.1731), 0.0289 0.5177, (0.1944), 0.0080 0.7144, (0.2542), 0.0051 0.6825, (0.1752), < 0.0001 Time 0.0195, (0.0284), 0.4933 0.0355, (0.0190), 0.0626 − 0.3811,
(0.0397), < 0.0001 − 0.0802, (0.0192), < 0.0001 Continuous non-zero
part Intercept – 2.4621, (0.3478), < 0.0001 − 1.9921, (1.1613), 0.0867 − 1.9869, (0.6854), 0.0039
HbA1c − 0.0914, (0.0350),
0.0089 − 0.0058, (0.0174), 0.7370 0.0934, (0.0576), 0.1052 0.0877, (0.0381), 0.0218
Age − 0.0427, (0.0154),
0.0055 − 0.0119, (0.0039), 0.0029 0.0011, (0.0131), 0.9339 − 0.0001, (0.0086), 0.9884 Duration − 0.0071, (0.0203),
0.7254 − 0.0058, (0.0062), 0.3459 0.0105, (0.0207), 0.6130 0.0012, (0.0141), 0.9307 SBP 0.0074, (0.0049), 0.1290 0.0042, (0.0024), 0.0801 0.0347,
(0.0084), < 0.0001 0.0260, (0.0053), < 0.0001
Male − 0.0277, (0.0149),
0.8526 0.0544, (0.0596), 0.3630 0.0011, (0.2038), 0.9957 0.0053, (0.1355), 0.9683 HDL 0.0080, (0.0052), 0.1207 0.0058, (0.0023), 0.0139 0.0206, (0.0078), 0.0092 0.0142, (0.0053), 0.0078 Time – 0.0151, (0.0101), 0.1374 0.0125, (0.0340), 0.7140 − 0.0315, (0.0256),
0.2197
Random effects Zero part variance – 1.0528 0.8638 1.4051
Non zero part variance – 0.0983 1.2669 1.2052
fact that this model ignores the correlation between the two components and fits the zero part separately from the continuous part treating them as two independent
entities might have lowered the power of hypothesis test-ing and introduced bias in the parameter estimates and inaccuracy in the results.
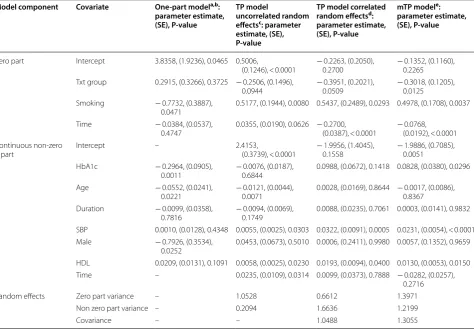
[image:10.595.62.537.124.453.2]Unlike mTP and TP, one-part model fits the entire sample and assumes that all values are obtained from a single process instead of two different zero and non-zero processes. Hence, parameter estimates under this model for treatment group and smoking represent the effect of these covariates on CTGF levels and not on the probabil-ity of non-zero values. Our results showed that under the one-part model treatment group had no effect on CTGF levels and this was consistently demonstrated for all 3 distributions (Tables 1, 2, 3, one-part model). This result is not in agreement with mTP and clinical findings which supported the hypothesis that intensive glucose control regulates and lowers CTGF levels [7, 27]. As for smoking, its effect on CTGF levels were captured under lognormal Table 3 Parameter estimates for one-part model, two-part (TP) model with uncorrelated random effects, TP with correlated random effects, and marginalized two-part (mTP) models assuming Weibull distribution for the non-zero component
One-part modela fits the entire sample without distinction between zero and non-zero processes, so only one estimate for the intercept and one for time were generated. In one-part modelb the parameter estimates for txt group and smoking represent the effect of these covariates on the CTGF levels themselves and not on the probability of non-zero values, unlike the TP and mTP models. TP model uncorrelated random effectsc and TP model correlated random effectsd generate estimates for the continuous part using only a portion of the sample pertaining to positive non-zero values. mTP modele provides estimates for the parameters in the continuous part for the entire sample (zero and non-zero values)
Model component Covariate One‑part modela,b: parameter estimate, (SE), P‑value
TP model
uncorrelated random effectsc: parameter estimate, (SE), P‑value
TP model correlated random effectsd: parameter estimate, (SE), P‑value
mTP modele: parameter estimate, (SE), P‑value
Zero part Intercept 3.8358, (1.9236), 0.0465 0.5006,
(0.1246), < 0.0001 − 0.2263, (0.2050), 0.2700 − 0.1352, (0.1160), 0.2265 Txt group 0.2915, (0.3266), 0.3725 − 0.2506, (0.1496),
0.0944 − 0.3951, (0.2021), 0.0509 − 0.3018, (0.1205), 0.0125 Smoking − 0.7732, (0.3887),
0.0471 0.5177, (0.1944), 0.0080 0.5437, (0.2489), 0.0293 0.4978, (0.1708), 0.0037
Time − 0.0384, (0.0537),
0.4747 0.0355, (0.0190), 0.0626 − 0.2700, (0.0387), < 0.0001 − 0.0768, (0.0192), < 0.0001 Continuous non-zero
part Intercept – 2.4153, (0.3739), < 0.0001 − 1.9956, (1.4045), 0.1558 − 1.9886, (0.7085), 0.0051
HbA1c − 0.2964, (0.0905),
0.0011 − 0.0076, (0.0187), 0.6844 0.0988, (0.0672), 0.1418 0.0828, (0.0380), 0.0296
Age − 0.0552, (0.0241),
0.0221 − 0.0121, (0.0044), 0.0071 0.0028, (0.0169), 0.8644 − 0.0017, (0.0086), 0.8367 Duration − 0.0099, (0.0358),
0.7816 − 0.0094, (0.0069), 0.1749 0.0088, (0.0235), 0.7061 0.0003, (0.0141), 0.9832 SBP 0.0010, (0.0128), 0.4348 0.0055, (0.0025), 0.0303 0.0322, (0.0091), 0.0005 0.0231, (0.0054), < 0.0001
Male − 0.7926, (0.3534),
0.0252 0.0453, (0.0673), 0.5010 0.0006, (0.2411), 0.9980 0.0057, (0.1352), 0.9659 HDL 0.0209, (0.0131), 0.1091 0.0058, (0.0025), 0.0230 0.0193, (0.0094), 0.0400 0.0130, (0.0053), 0.0150 Time – 0.0235, (0.0109), 0.0314 0.0099, (0.0373), 0.7888 − 0.0282, (0.0257),
0.2716
Random effects Zero part variance – 1.0528 0.6612 1.3971
Non zero part variance – 0.2094 1.6636 1.2199
Covariance – – 1.0488 1.3055
Table 4 Model fit comparison for mTP and TP with correlated random intercepts using gamma, lognormal, and Weibull distributions for the none-zero component
Model AIC BIC − 2 log likelihood
mTP Gamma 5827.6 5900.2 5795.6
Lognormal 6161.1 6238.3 6127.1 Weibull 6151.3 6223.9 6119.3 TP with
correlated intercepts
[image:10.595.57.292.576.670.2](P-value = 0.0289) and Weibull (P-value = 0.0471) dis-tributions but not with Gamma distribution. This detected association showed that smoking contributes to decreased levels of CTGF which is not in line with the results from mTP and TP models as well as clinical find-ings [26]. This inaccuracy in the estimates could be due to the bias and lack of consistency in the parameter esti-mates attributed to one-part model.
As for the continuous non-zero part, high density lipoprotein (HDL) was consistently associated with the non-zero values of CTGF, and this was demonstrated for the TP and mTP models and in all 3 distributions (all P-values < 0.05), except for the one-part model that failed to show this association and which could be attrib-uted to the low coverage in the confidence interval of this model. When a significant association was captured, patients with higher plasma HDL levels appeared to have increased levels of CTGF. For example, under the gamma distribution and the mTP model, type 1 diabetic patients who have 1 mg/dl higher HDL had about 1.24% (ng/ml) increased levels of CTGF (Table 1, P-value < 0.0001).
Duration of diabetes and gender consistently demon-strated a non-significant effect on the observed CTGF levels across the TP and mTP models with different distributions. However, the one-part model showed that duration of diabetes, and gender were significantly associated with CTGF only under the gamma and Weibull distributions respectively. These significant associations could be attributed to the fact that the one-part model has increased biased in its estimates and inflated type one error that lead to inaccurate con-clusion of significant association when in reality a cor-relation does not exist. The increased bias and type 1 errors in the one-part model are triggered by the fact that under this approach and unlike the two-part mod-els estimates are generated for the entire sample with-out distinguishing between the zeros and non-zeros when in fact these values are generated by two different processes.
Systolic blood pressure (SBP) did not have consist-ently detected effects on the observed values of CTGF in all four models. In this regard, SBP showed a positive significant effect on CTGF under mTP model and TP model with correlated random intercepts for all 3 distri-butions (P-values < 0.05). A borderline significant effect of SBP on CTGF was detected under TP with uncorre-lated random intercepts model with gamma distribu-tion (Table 1, P-value = 0.0534), an insignificant effect with lognormal distribution under these same models (Table 2, P-value = 0.0801), and a significant effect for these models under the Weibull distribution (Table 3, P-value = 0.0303). One-part model showed a non-sig-nificant association between SBP and CTGF for all 3
distributions which again could be attributed to the lower coverage in the confidence interval in this model. In addition, given that mTP model and TP model with correlated random effects have less bias in the estimates than one-part and TP with uncorrelated random inter-cepts models, then one can conclude that SBP has a sig-nificant positive effect on the observed non-zero CTGF values. If we were to interpret its marginal effect on the CTGF population mean under mTP model with gamma (Table 1), we can deduce that when SBP increases by 1 mmHg the observed values of CTGF increase by about (exp(0.0243) − 1)*100% = 3% (ng/ml) on average.
When the effect of age on CTGF values was assessed, it also had inconsistent relationship with CTGF observed values that varied with each model. Both mTP and TP models with correlated random effects indicated a non-significant association between age and CTGF under all distributions. TP with uncorrelated random effects and one-part models showed significant effect of age on CTGF values (P-value < 0.05) for all distributions under the TP uncorrelated model, and for lognormal and Weibull under the one-part model. These significant results could be attributed to the inflation of type 1 error in the one-part model and TP model with uncorrelated random effects.
Our results also showed that HbA1c, a marker of meta-bolic control, was significantly associated with CTGF under mTP model with all 3 distributions. In this respect, an increase of 8 ng/ml in the marginal mean of CTGF was attributed to a 1% increase in HbA1c (P-value = 0.0005) under the gamma distribution. Similar interpretation can be drawn for mTP with lognormal and Weibull dis-tributions. The TP model with correlated random effects showed a significant effect of HbA1c only with gamma distribution but did not capture any significant effect with the other distributions. This could be attributed to the fact that mTP had better precision and accuracy in the parameter estimates compared to all other models.
the other models. This conclusion was further examined using a simulation study that intended to determine the performance of each of the models and which we discuss in the following section.
Simulation study
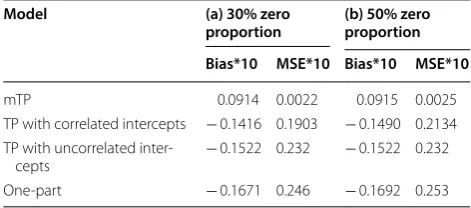
To assess the performance of each of the models: mTP, TP with correlated random intercepts, TP with uncorre-lated random intercepts, and the one-part model, a simu-lation study was conducted wherein different proportions of zeros were included. We performed 1000 simulations with sample size of 200 and with 9 repeated measures and 30% proportions of zeros, and with 12 repeated measures with 50% proportion of zeros. The performance of each of the models was determined in terms of bias and mean square errors (MSE) and the smaller these per-formance indicators the more accurate and precise the model’s estimates are. Our simulation results included in Table 5 indicated that mTP had the smallest bias and MSE compared to the remaining models and under the different zero proportions. In this regard, mTP had 35% decrease in bias and 88.4% decrease in MSE compared to TP with correlated random effects in the simula-tion study that had 30% proporsimula-tion of zeros, and 39% decrease in bias and 98% decrease in MSE under the sim-ulation study with 50% proportion of zeros. Hence mTP performed better than the TP with correlated random effect and this was evident in both studies especially in the case of higher zero proportion of 50%. In the simula-tion study with 30% zero proporsimula-tion, TP with correlated random effect had a decrease of 7% to 12% in bias, and 18% to 21% in MSE compared to TP with uncorrelated random intercepts and the one-part model respectively. Similarly, under the simulation study of 50% zero propor-tion, a decrease of 2% and 9% was denoted for bias and 8% to 16% in MSE compared to the TP with uncorrelated
random intercepts and the one-part model respectively. Hence, our simulation study results suggested that TP with correlated random effects had better performance than the remaining two models (TP with uncorrelated random effects and one-part model), and that mTP had smaller attributed bias and MSE compared to the other 3 models indicating better accuracy and precision of its estimates.
Discussion
In this manuscript, we present a novel application of a likelihood-based approach to analyze semicontinuous longitudinal data using a marginalized two-part model that we extended to incorporate longitudinal repeated measures. Various distributions were incorporated that included gamma, lognormal and Weibull. Random intercepts at an individual patient level were introduced in both the zero and non-zero components to account for the within subject correlation inherent due to the repeated measures on the same subject. We applied this model on a cohort of type 1 diabetic subjects with the aim of identifying clinical determinants that associate with CTGF, a pathogenic risk factor for diabetic compli-cations. CTGF levels measured in this cohort displayed a mixture of negligible low values forming a point mass at zero and continuous observed positive values. The objec-tive of this study is to determine what risk factors impact, these two components that ultimately result in CTGF levels. We also compared the estimates under different distributions using other models for analyzing semicon-tinuous longitudinal outcomes. The models explored here included in addition to marginalized two-part model, the two-part model with correlated, and uncorrelated random effects wherein, the continuous and zero com-ponents are fit separately, and the one-part model that provides estimates for the entire sample without distin-guishing between the zero and non-zero processes. The marginalized two-part model allows for interpretation of the estimate in the continuous part as 1 unit increase in the covariate on the overall marginal mean comprised of zeros and non-zeros, while the effect of the estimates in the continuous part under the two-part model are inter-preted conditional upon the values being observed.
[image:12.595.55.291.146.250.2]When the mTP model was applied on a cohort of type 1 diabetic patients, it gave consistent results for the param-eter estimates across all 3 distributions, demonstrating robustness for the underlying distribution compared to one-part and two-part models with uncorrelated ran-dom intercepts. The clinical determinants that displayed significant associations with the probability of non-zero values for CTGF under the mTP model were the glyce-mic treatment and smoking status. However, the clinical Table 5 Simulation results for mTP, TP with correlated
random intercepts, TP with uncorrelated random intercepts, and one-part model using simulated data with (a) proportion of zeros is 30% and (b) proportions of zeros is 50%
1000 simulations with sample size of 200 were generated with (a) 9 repeated measures and (b) 12 repeated measures
Model (a) 30% zero
proportion (b) 50% zero proportion Bias*10 MSE*10 Bias*10 MSE*10
mTP 0.0914 0.0022 0.0915 0.0025
TP with correlated intercepts − 0.1416 0.1903 − 0.1490 0.2134 TP with uncorrelated
inter-cepts − 0.1522 0.232 − 0.1522 0.232
parameters that were significantly associated with the continuous observed positive values of CTGF were HDL, HbA1c and SBP.
In general, the TP model with correlated random effects resulted in estimates that are close to the parame-ter estimates under the mTP model but showed some dis-crepancy in the results of some clinical parameters that varied between the different distributions. Specifically, HbA1c was shown to be significantly associated with continuous observed values for CTGF under the TP cor-related random intercepts with gamma distribution, but this association was not significant under the lognormal and Weibull distributions. Similarly, the intensive glyce-mic treatment group was shown to be significantly asso-ciated with the probability of non-zero under the gamma and lognormal distributions, but this association was not significant under the Weibull distribution. Gamma and lognormal distributions were better fit for this data given their lower AIB and BIC values and resulted in more stable results than TP with Weibull. This inconsistency in the inferences in the TP model with correlated ran-dom intercepts, could be attributed to its sensitivity to the underlying distribution and the true random effects structure, which is not the case with the mTP model [15]. It is worth noting here that from a clinical perspective, HbA1c was shown in some studies to be positively asso-ciated with CTGF levels, and treatment was shown to be correlated with the detection levels for CTGF [7, 27].
With respect to the TP model with uncorrelated ran-dom intercepts and separate fitting of the zero and con-tinuous components, this approach was consistent with the mTP and the TP models with correlated random intercepts in the inference for smoking that was shown to be significantly associated with the probability of non-zero. However, this was not the case with the parameter estimate for intensive glycemic treatment in the zero part, wherein this model failed to capture the significant effect of intensive treatment on the probability of non-zero measures. Similar result was obtained with HbA1c where a non-significant association was reached under this model with all distributions. SBP was shown to be significantly associated with the continuous part under the Weibull distribution, but not with lognormal or gamma distributions. This result is not in line with find-ings from other clinical studies that showed a significant association between hypertension and CTGF [7, 9]. The discrepancy in the inferences between the mTP model and the TP model with uncorrelated random effect could be attributed to the increased lack of efficiency, and bias in the parameter estimates due to ignoring the correla-tion between the random effects in the two components and fitting the zero and continuous parts separately [21, 28].
The one-part model produced estimates and infer-ences that contradicted clinical findings. For instance this model suggested that increased HbA1c and smok-ing are protective factors that contribute to decreas-ing CTGF which is opposite of what has been clinically demonstrated [26, 27]. In this regard, CTGF levels were shown to be significantly associated with HbA1c in type 1 diabetic patients with nephropathy [27]. The expression of CTGF was also shown to be increased in the kidney and vasculature isolated from animal models of diabetes, implicating a role for hyperglycemia in modulating CTGF expression [29, 30]. Furthermore, hyperglycemia was shown to stimulate the expression of CTGF in mesangial cells, podocytes and vascular smooth muscle cells and this process involved activation of transforming growth factor beta, MAPK kinase pathway and protein kinase C [31–34]. In addition, the one-part and two-part with uncorrelated random effects were the only models that detected a significant association between age and CTGF levels. This inaccuracy in the results could be due to the inflated type 1 error and negative bias that pose major disadvantages of the one-part model [35].
that fits both components as one sample. However, the overall execution time is still short and it needed less than or approximately 1 min maximum time to converge successfully. Nevertheless, this additional execution time is outweighed by the gain in accuracy and precision of the mTP model.
Conclusion
In summary, our findings showed that mTP provided stable estimates that are less sensitive to the underlying distributions when compared to the two-part and one-part models. Our simulation results showed superiority of mTP over the other models in terms of minimum bias and mean square errors indicating better accuracy and precision of the parameters’ estimates. Incorporating the within-subject correlation and the correlation between the zero and continuous non-zero processes and express-ing the marginal mean directly in terms of parametriza-tion of the regression coefficients using both the zero and non-zero values could all contribute to the precision and accuracy of this model.
Furthermore, in this manuscript we adopted a novel approach that analyzes for the first time CTGF from the perspective of having different processes that result in the zero and non-zero values. The mTP model pre-sented here has identified new clinical determinants that modulate the levels of CTGF in diabetic subjects. In this regard, intensive glycemic treatment was shown to be associated with decreased odds of CTGF detec-tion, and smoking was identified as a factor that asso-ciates with increased probability of non-zero which indicates its association with increased levels of CTGF. Moreover, HDL, SBP and HbA1c were associated with increased levels of CTGF. This finding is of clinical sig-nificance, since it provides insights into factors that affect the levels of CTGF, a pathogenic risk factor for diabetic complications. In addition, a key advantage is that the analytical approaches described herein are applicable to all inflammatory biomarkers and cytokine profiles measured in patient populations that display a combination of negligible zero and non-zero values to understand the factors that regulate their production. Moreover, the models illustrated in this study are not limited to only clinical outcome datasets but could be also applicable to a vast array of real life situations such as health services research whereby lack or absence of a service may lead to proliferation of zero values, which requires this type of analyses. Hence, this study could be utilized as a model approach for the analyses of sim-ilar settings wherein semicontinuous data is present.
Abbreviations
CTGF: connective tissue growth factor; CVD: cardiovascular disease; mTP: marginalized two-part model; TP: two-part model; AIC: Akaike information criterion; BIC: Bayesian information criterion; SBP: systolic blood pressure; HDL: high density lipoprotein; HbA1c: hemoglobin A1c.
Authors’ contributions
MAJ and MG conceived the methodological approaches for the manuscript and performed all the analysis for the study. MAJ wrote, reviewed and edited the manuscript. MG reviewed and edited the manuscript. DKL and SMG over-saw the measurements of CTGF and reviewed the manuscript. KEL reviewed and edited the manuscript. LML reviewed the manuscript. AAJ conceived the study, amassed the resulting data and wrote reviewed and edited the manu-script. All authors read and approved the final manumanu-script.
Author details
1 Epidemiology and Population Health Department, Faculty of Health Sci-ences, American University of Beirut, P.O.Box 11-0236, Riad El-Solh, 1107 2020 Beirut, Lebanon. 2 Department of Biochemistry and Molecular Genetics, Faculty of Medicine, American University of Beirut, Beirut, Lebanon. 3 Depart-ment of Public Health Sciences, Medical University of South Carolina, Charles-ton, SC, USA. 4 Department of Medicine, Medical University of South Carolina, Charleston, SC, USA. 5 Fibrogen Inc, San Francisco, CA, USA.
Acknowledgements
We would like to acknowledge the DCCT/EDIC as the source of data. A complete list of participants in the DCCT/EDIC Research Group is presented in the Additional Material published online for the article in N Engl J Med 2015;372:1722–33.
Competing interests
Kenneth E Lipson is employed by Fibrogen Inc., the company which makes the CTGF assay used to measure CTGF in the DCCT study participants. None of the other authors have any potential conflicts of interest or financial disclosure to report.
Availability of data and materials
Restrictions apply to the availability of the data that support the findings of the current study.
Consent for publications Not applicable.
Ethics
The DCCT was approved by the Institutional Review Boards of all participating DCCT centers and all participants provided written informed consent.
Funding
This work was supported by the National Institutes of Health Grants HL077192 (AAJ) and 5 P01 HL055782.
Publisher’s Note
Springer Nature remains neutral with regard to jurisdictional claims in pub-lished maps and institutional affiliations.
Received: 4 April 2018 Accepted: 27 October 2018
References
1. Cheung N, Wong TY. Diabetic retinopathy and systemic vascular compli-cations. Prog Retin Eye Res. 2008;27:161–7.
2. Hojs R, Ekart R, Bevc S, Hojs N. Biomarkers of renal disease and progres-sion in patients with diabetes. J Clin Med. 2015;4:1010–24.
•fast, convenient online submission •
thorough peer review by experienced researchers in your field • rapid publication on acceptance
• support for research data, including large and complex data types •
gold Open Access which fosters wider collaboration and increased citations maximum visibility for your research: over 100M website views per year •
At BMC, research is always in progress.
Learn more biomedcentral.com/submissions
Ready to submit your research? Choose BMC and benefit from: 4. Brown WV. Microvascular complications of diabetes mellitus: renal
protection accompanies cardiovascular protection. Am J Cardiol. 2008;102:10L–3L.
5. Granger DN, Rodrigues SF, Yildirim A, Senchenkova EY. Microvas-cular responses to cardiovasMicrovas-cular risk factors. Microcirculation. 2010;17(3):192–205.
6. Kular L, Pakradouni J, Kitabgi P, Laurent M, Martinerje C. The CCN family: a new class of inflammation modulators. Biochemie. 2011;93:377–88. 7. Jaffa AA, Usinger WR, McHenry MB, Jaffa MA, Lipsitz SR, Lackland
D, et al. Connective tissue growth factor and susceptibility to renal and vascular disease risk in type 1 diabetes. J Clin Endocrinol Metab. 2008;93:1893–900.
8. Leeuwis JW, Nguyen TQ, Theunissen MGJ, Peeters W, Goldschmeding R, Pasterkamp G, et al. Connective tissue growth factor is associated with a stable atherosclerotic plaque phenotype and is involved in plaque stabilization after stroke. Stroke. 2010;2010(41):2979–81.
9. Gerritsen KG, Falke LL, van Vuuren SH, Leeuwis JW, Broekhuizen R, Nguyen TQ, et al. Plasma CTGF is independently related to an increased risk of cardiovascular events and mortality in patients with atherosclerotic disease: the SMART study. Growth Factors. 2016;4:149–58.
10. Hunt KJ, Jaffa MA, Garrett SM, Luttrell DK, Lipson KE, Lopes-Virella M, Luttrell LM, Jaffa AA, VADT Investigators. Plasma connective growth factor (CTGF/CCN2) levels predict myocardial infraction in the Veterans Affairs Diabetes Trial (VADT) cohort. Diabetes Care. 2018;41(4):840–6. 11. Olsen MK, Schafer JL. A two-part random-effects model for
semicontinu-ous longitudinal data. JASA. 2001;96:730–45.
12. Yiu S, Tom DMB. Two-part models with stochastic processes for model-ling longitudinal semicontinuous data: Computationally efficient infer-ence and modelling the overall marginal mean. SMMR. 2017. https ://doi. org/10.1177/09622 80217 71057 3.
13. Berk KN, Lachenbruch PA. Repeated measures with zeros. SMMR. 2002;11:303–16.
14. Tooze JA, Grunwald GK, Jones RH. Analysis of repeated measures data with clumping at zero. SMMR. 2002;11(4):341–55.
15. Su L, Tom BD, Farewell VT. A likelihood-based two-part marginal model for longitudinal semi-continuous data. SMMR. 2015;24(2):194–205. 16. Hall DB, Zhang Z. “Marginal models for zero inflated clustered data. Stat
Model. 2004;2004(4):161–80.
17. Smith VA, Preisser JS, Neelon B. A marginalized two-part model for semi-continuous data. Stat Med. 2014;2014(33):4891–930.
18. Voronca DC, Gebregziabher M, Durkalski VL, Liu L, Egede LE. Marginalized two part models for generalized gamma family of distributions. cornell university library. arXiv: 2015; 1511.05629[stat.ME].
19. The DCCT Research Group. The diabetes control and complications trial (DCCT): design and methodologic considerations for the feasibility phase. Diabetes. 1986;35:530–45.
20. The Diabetes Control and Complications Trial Research Group. The effect of intensive treatment of diabetes on the development and progression of long term complications in insulin-dependent diabetes mellitus. N Engl J Med. 1993;329:977–86.
21. Su L, Tom BD, Farewell VT. Bias in 2-part mixed models for longitudinal semicontinuous data. Biostatistics. 2009;10:374–89.
22. Pinheiro JC, Bates DM. Approximations to the Log-likelihood function in the nonlinear mixed-effects model. J Comput Graph Stat. 1995;4:12–35. 23. Fletcher R. Practical methods of optimization. 2nd ed. New York: Willey;
1987.
24. Buntin MB, Zaslavsky AM. Too much ado about two-part models and transformations? Comparing methods of modeling Medicare expendi-tures. J Health Econ. 2004;23:525–42.
25. Smith VA, Neelon B, Preisser JS, Maciejewski ML. A marginalized two-part model for longitudinal semicontinuous data. SMMR. 2017;26:1949–68. 26. Zhou S, Li M, Zeng D, Hu X, Li Y, Wang R, Sun G. Expression variations of
connective tissue growth factor in pulmonary arteries from smokers with and without chronic obstructive pulmonary disease. Sci Rep. 2015;5:8564. 27. Roestenberg P, van Nieuwenhoven FA, Wieten L, Boer P, Diekman T, Tiller
AM, et al. Connective tissue growth factor is increased in plasma of type 1 diabetic patients with nephropathy. Diabetes Care. 2004;27(5):1164–70. 28. Albert PS, Shen J. Modelling longitudinal semicontinuous emesis volume
data with serial correlation in an acupuncture clinical trial. JRSS Series C. 2005;54:707–20.
29. Tan Y, Keum JS, Wang B, McHenry MB, Lipsitz SR, Jaffa AA. Targeted dele-tion of B2-kinin receptors protects against the development of diabetic nephropathy. Am J Physiol Renal Physiol. 2007;293:F1026–35. 30. Riser BL, Denichilo M, Cortes P, Baker C, Grondin JM, Yee J, Narins RG.
Regulation of connective tissue growth factor activity in cultured rat mesangial cells and its expression in experimental diabetic glomerulo-sclerosis. J Am Soc Nephrol. 2000;11:25–38.
31. Furlong F, Crean J, Thornton L, O’leary B, Murphy M, Martin F. Dysregu-lated intracellular signaling impairs CTGF-stimuDysregu-lated responses in human mesangial cells exposed to high extracellular glucose. AJP Renal Physiol. 2007;292:F1691–700.
32. Dai HY, Zheng M, Ly LL, Tang RN, Ma KL, Liu D, Wu M, Liu BC. The roles of connective tissue growth factor and integrin-linked kinase in high glucose-induced phenotypic alterations of podocytes. J Cell Biochem. 2012;113:293–301.
33. Liu X, Luo F, Pan K, Wu W, Chen H. High glucose upregulates connective tissue growth factor expression in human vascular smooth muscle cells. BMC Cell Biol. 2007;16(8):1.
34. Wang B, Carter RE, Jaffa MA, Nakerakanti S, Lackland D, Lopes-Virella M, Trojanowska M, Luttrell LM, Jaffa AA. Genetic variant in the promoter of connective tissue growth factor gene confers susceptibility to nephropa-thy in type 1 diabetes. J Med Genet. 2010;47:391–7.