Pulse Pressure Testing and Analysis
of Steel Plates with Openings
by
Nicholas J. Underwood MEng.
Thesis submitted in accordance with the
requirements of the University of Liverpool for
the degree of Doctor in Philosophy by
Nicholas J. Underwood
November 2013
© 2013
Steel plates are widely used in a variety of civil engineering applications for load bearing structural components, due to their favourable strength to weight ratio. Many of these plates have openings that are commonly used for reducing weight, access for utilities or for inspection in shipping and offshore installations. However the influence of these openings to the structural component’s robustness and resilience against blast loading is relatively unknown, with limited research conducted in this subject to date.
Due to the high costs associated with offshore facilities they are typically very congested. This coupled with the producing, processing, storing and transporting of hydrocarbon materials means that explosions and subsequent fires are major hazards with severe consequences. In the event of an explosion, the blast load will initially impact the secondary structure (large spanning plated sections) and then transfer through to the primary structure, highlighting their critical consideration in safety assessments. Plated structures are also known to cause confinement, which in turn will results in higher overpressures, making the consequences of an event more severe.
The aim of this research was to investigate the combined influence that openings have on the overpressure and the structural response of thin ductile plates subjected to extreme dynamic transverse loads. This was achieved by conducting a set of well-defined experiments investigating the response of 1/8 scale (0.5 m square) mild steel plates with openings subjected to pulse pressure loading. Six central (scaled) openings were considered; circular (50, 75 and 100 mm) and extended circular (50 by 75, 75 by 100 and 100 by 125 mm) representative of typical offshore and shipping applications. Each plate design was assessed with two boundary conditions (restrained and non-restrained) and two nominal loading conditions. The boundary conditions adopted in this study allowed the response to be bounded, and enabled them to be practicably modelled in FEA-analyses and in the simplified analytical approaches. A pulse pressure test facility was used to generate nominal pulse pressure loads (25 and 50 psi) applied over a time (100 to 200+ ms load duration) representative of extreme explosion loading conditions offshore. All plates exhibited a mode I type failure (large inelastic deformation) highlighting the large reserve strength in such members.
The work has shown that the inclusion of an opening (<5% of the exposed panel area) does not significantly degrade the structural resistance when damage is restricted to large inelastic deformation. The reduction in stiffness due to the hole is compensated by the reduced area to which the load is applied.
The data generated in the laboratory tests was used to develop and validate finite element models. In general, excellent correlation was observed between the experimental failure modes and the permanent displacements, within an average difference of 12% and 15% for the restrained and non-restrained plates respectively. The finite element models also provided a useful insight into the various failure processes and transient behaviour which could not be observed experimentally.
A simplified analytical model was developed to predict the response of the plates and was validated against the experimental data. The results for the permanent displacements compared favourably with the restrained plates at the two nominal pressures (6.5% at 25 psi and 7% at 50 psi), but correlated less well with the non-restrained ones (10% at 25 psi and 3% at 50 psi). Correct definition of support conditions along with a detailed description of the development of plasticity, as shown in the finite element models was fundamental in accurately predicting response of the non-restrained plates. The simplified techniques developed are cost effective compared with more sophisticated finite element methods making them suitable for preliminary engineering design studies.
Ultimately this study provides evidence to suggest that small (circular or extended circular) openings positioned away from areas of high stress, could be used as a passive system to mitigate the influences of an explosion event offshore. This has many benefits in the form of reducing weight, reducing confinement (thus lowering overpressures) and reducing the loading applied to these members, and subsequently reducing the loading transferred through to the primary structure.
I would like to extend my gratitude to my supervisor, Dr. Graham Schleyer, and all the members of the Impact Research Centre, both past and present, at the University of Liverpool. In particular, I would like to extend my sincerest gratitude to Dr. Schleyer for his continued encouragement and belief in me. Without his guidance and enthusiasm, this work would not have been possible.
I am grateful for the financial support of the Engineering and Physical Sciences Research Council (EPSRC) and the Korean government (Basic Science Research Program through the National Research Foundation of Korea (NRF) funded by the Ministry of Education, Science and Technology under Grant No. K20903002030-11E0100-04610). This enabled me to attend various international conferences and conduct several collaborative projects. Hence, I am indebted to Professor Tore Borvik and PhDc Knut Rakvag for the fruitful experimental and numerical collaboration, which included a three-week stay at the Department of Structural Engineering, NTNU.
My thanks also extend to Mr. Hyung Min Do for his help, friendship and enthusiasm, especially during the development of the analytical models. Warm thanks are given to PhDc Shaharudin Zaini for his tireless assistance during the experimental work.
I would like to thank all my friends, both in Liverpool and those from back home, for always being there to give words of support, or to provide a means of distraction when I needed it most.
Most of all, I would like to thank Laura and my family, for their unwavering love and support throughout all my endeavours.
Publications
Journal Articles
Rakvag K.G. Underwood N.J. Schleyer G.K. Borvik T. and Hopperstad O.S. Transient pressure loading of clamped metallic plates with pre-formed holes.
International Journal of Impact Engineering, (53):44-55, 2013.
Schleyer G.K. Underwood N.J. Do H.M. Paik J.K. and Kim B.J. On pulse pressure loading of plates with holes.Central European Journal of Engineering, 2(4):496-508, 2012.
Papers in Conference Proceedings
Underwood N.J. Schleyer G.K. Paik J.K. and Kim B.J. Nonlinear structural consequence analysis of plates with apertures under pulse pressure loads: an experimental and numerical approach.Proceedings of the 12th International Conference on Structures Under Shock and Impact, 4-6th September, Kos, Greece, 2012.
Zaini S.S. Schleyer G.K. Barnett S.J. and Underwood N.J. High pressure Static Test on UHPFRC Panels Using Pulse Pressure Loading Rig. Proceedings of Awam International Conference on Civil EngineeringAICCE’ 12, Pearl of the Orient, Malaysia, 2012.
Do H.M. Schleyer G.K. Underwood N.J. Paik J.K. and Kim B.J. Buckling and ultimate strength of damaged plates with openings.Proceedings of the 2011 World Congress on Advances in Structural Engineering and MechanicsTechno-Press, Seoul pp 1939-1947, 2011.
Schleyer G.K. Underwood N.J. Do H.M. Paik J.K. and Kim B.J., On the simplified analysis of square plates with holes.Proceedings of the 30th International Conference on Ocean, Offshore and Arctic EngineeringASME, Rotterdam pp 1-5, 2011.
Schleyer G.K. and Underwood N.J. Dalzell G. Stacey N. Major Hazards Management - a finishing module for undergraduate engineers on how to manage risk.EE2010 Engineering Education Conference, 6-8 July, Aston University, Birmingham, UK, 2010.
Contents
Abstract i
Acknowledgment iii
Publications iv
Nomenclature xxi
1 Introduction 1
1.1 The generic problem . . . 2
1.2 Scope . . . 3
1.3 Aims and Objectives . . . 3
1.3.1 Arrangement of thesis . . . 4
2 Literature Review 5 2.1 Plates . . . 5
2.2 Offshore installations . . . 7
2.2.1 Plate applications . . . 7
Plates with openings . . . 9
Steel-plated boundary conditions . . . 9
2.2.2 Offshore challenges . . . 9
2.2.3 Threat . . . 10
What are the hazards? . . . 10
What is the risk of an explosion? . . . 11
What are the consequences of an explosion? . . . 11
2.3 Explosions . . . 13
2.3.1 Explosion mechanism . . . 14
2.3.2 Fluid structure interaction . . . 14
2.3.3 Fragmentation . . . 15
2.3.4 Synergetic effects of blast and fragmentation . . . 15
2.4 Blast resistant design . . . 16
2.4.1 Mitigation . . . 17
2.4.2 Offshore material characteristics . . . 17
2.5 Vulnerability of plated structures . . . 19
2.5.1 Components response . . . 20
2.5.2 Strengthening of offshore topsides structures . . . 21
2.5.3 Failure modes . . . 22
2.6 Structural response modelling . . . 23
2.6.1 Experimental methods . . . 23
2.6.2 Analytical modelling . . . 24
2.6.3 Computation modelling . . . 27
2.6.4 Factors considered when selecting method . . . 28
2.7 Previous studies on thin plates subjected to blast . . . 29
2.7.1 Influence of boundary conditions . . . 30
2.7.2 Mode I failure: Large inelastic deformation . . . 30
2.7.3 Influence of stiffeners . . . 31
2.7.4 Influence of pulse shape effects . . . 31
2.7.5 Influence of openings . . . 33
2.8 Current design codes . . . 34
2.8.1 UFC 3-340-02 . . . 34
2.8.2 UKOOA . . . 35
2.8.3 API RP 2FB . . . 36
2.8.4 N-004 NORSOK standard . . . 38
2.8.5 ISO 19900-6 . . . 38
2.8.6 Summary of current design codes . . . 39
2.9 Summary . . . 40
3 Material Tests 43 3.1 Introduction . . . 43
3.2 Constitutive relations . . . 43
3.3 Mechanical properties of steel . . . 44
True stress-strain . . . 44
Necking . . . 44
Stress distribution at the neck . . . 46
3.3.1 Microstructure of mild steel . . . 47
3.3.2 Strain-rate effect . . . 48
3.3.3 Temperature effect . . . 48
3.4 Experiments . . . 49
3.4.1 Material . . . 49
3.4.2 Microstructure . . . 49
3.4.3 Macrostructure . . . 50
3.4.4 Tensile tests at high strain-rates . . . 51
Specimen preparation . . . 51
3.4.5 Tensile tests at medium strain-rates . . . 52
3.4.6 Tensile tests at low strain-rates . . . 54
3.5 Experimental results . . . 55
3.6 Selection of constitutive relations . . . 59
3.6.1 Advanced non-linear (Numerical) constitutive relation . . . . 60
3.6.2 Simplified (Analytical) constitutive relation . . . 60
3.7 Summary . . . 61
4.1 Introduction . . . 63
4.1.1 Objectives of chapter . . . 64
4.2 Experimental set-up . . . 65
4.2.1 Instrumentation . . . 66
4.2.2 Principle of operation . . . 67
4.3 Characterisation tests . . . 69
4.3.1 Procedure . . . 69
Firing mechanism . . . 69
Pressure-time history recording . . . 70
4.3.2 Selection of pressure loadings . . . 71
Representative loading . . . 71
4.3.3 Scaling . . . 72
4.3.4 Example data capture for test configuration 1 . . . 73
4.3.5 Repeatability of loading . . . 74
Important parameters . . . 76
4.3.6 Simplified test configuration . . . 77
Improvement . . . 78
Example data capture for test configuration 2 . . . 78
Analysis . . . 79
4.3.7 Uniformity of pressure distribution over the structure . . . 79
4.3.8 Results . . . 80
4.4 Summary . . . 81
5 Component Tests 83 5.1 Introduction . . . 83
5.2 Edge conditions of the component tests . . . 83
5.2.1 Clamped with assumed in-plane restraint (restrained) . . . 83
5.2.2 Clamped without in-plane restraint (non-restrained) . . . 84
5.3 Test plates . . . 84
5.3.1 Openings . . . 85
5.4 Pressure loading . . . 86
5.5 Scaling effects . . . 86
5.5.1 Geometrically similar scaling . . . 87
5.5.2 Size effect . . . 87
5.6 Measurements . . . 88
5.6.1 Pressure . . . 88
5.6.2 Maximum and final displacements . . . 88
5.7 Experimental programme . . . 92
5.8 Experimental results and observations . . . 92
5.8.1 Test results . . . 92
5.8.2 Restrained plates . . . 97
5.8.3 Unrestrained plates . . . 99
5.9 Summary . . . 100
6 Full 3D Modelling of Component Tests 111
6.1 Introduction . . . 111
6.2 The Finite Element code . . . 112
6.2.1 Finite Element techniques . . . 112
6.2.2 Lagrangian solver . . . 112
6.2.3 Eulerian solver . . . 113
6.2.4 Arbitrary Lagrangian Eulerian (ALE) . . . 114
6.2.5 Explicit time integration . . . 115
Explicit time integration procedure . . . 115
Critical time step . . . 116
6.3 Material modelling . . . 117
6.3.1 Constitutive relation . . . 117
6.3.2 Identification of material parameters . . . 118
Strain hardening . . . 118
Strain rate sensitivity . . . 119
Temperature softening . . . 120
Fracture criteria . . . 121
Cockcroft-Latham model . . . 121
6.4 Pure Lagrangian . . . 122
6.4.1 Procedure to generate 3D FE model - restrained plate . . . 122
Model geometry . . . 122
Mesh sensitivity study . . . 123
6.4.2 Procedure to generate 3D FE model - non-restrained plate . . 124
Model geometry . . . 124
Mesh sensitivity study . . . 125
6.4.3 Results and Discussion . . . 128
Restrained plates . . . 128
Validation against experimental work . . . 129
Transient deformation . . . 133
Non-restrained plates . . . 137
Validation against experimental work . . . 138
Transient deformation . . . 142
6.4.4 Parametric study . . . 145
6.5 Eulerian . . . 150
6.6 Arbitrary Lagrangian Eulerian (ALE) . . . 152
6.7 Summary . . . 154
7 Simplified Analytical Solution 157 7.1 Introduction . . . 157
7.2 Previous work . . . 158
7.2.1 Energy solution . . . 158
7.3 Proposed energy solution . . . 160
7.3.1 Energy formulation for a restrained rectangular plate with central rectangular hole . . . 162
7.3.2 Energy formulation for a non-restrained rectangular plate with central rectangular hole . . . 165
gular hole with circular ends . . . 167
7.3.4 Comparison with experimental data from literature . . . 167
Static and dynamic loading of plates with no hole . . . 167
Dynamic loading of square plate with square hole . . . 168
7.3.5 Comparison with experimental data from present study . . . . 168
Simplification of the pressure pulse load . . . 168
Material properties . . . 169
Constitutive relation . . . 169
Estimation of strain rate effects . . . 170
Temperature softening . . . 171
7.3.6 Results and Discussion . . . 171
Restrained plates . . . 171
Validation against experimental work . . . 172
Non-restrained plates . . . 176
Calibrated against experimental work . . . 177
7.3.7 Parametric study . . . 178
7.3.8 Limitations to this approximate approach . . . 181
7.4 Methodology to estimate inertia effects . . . 181
Restrained plates . . . 182
7.5 Accuracy of analytical approach . . . 183
7.6 Summary . . . 184
8 Conclusions and Recommendations 185 8.1 Introduction . . . 185
8.2 Conclusions . . . 186
8.3 Limitations . . . 189
8.4 Further work . . . 190
References 191
A Deformation data 203
List of Figures
2.1 Examples of steel plates utilised in industry. . . 6
2.2 Typical steel-plated structures. . . 8
2.3 Various types of beam members (stiffeners). . . 8
2.4 Typical applications where plates with openings are used in (a) bulkheads[1]and (b) offshore structures. . . 9
2.5 Typical offshore installation layout. . . 10
2.6 Frequency of Exceedance-Pressure[2]. . . 11
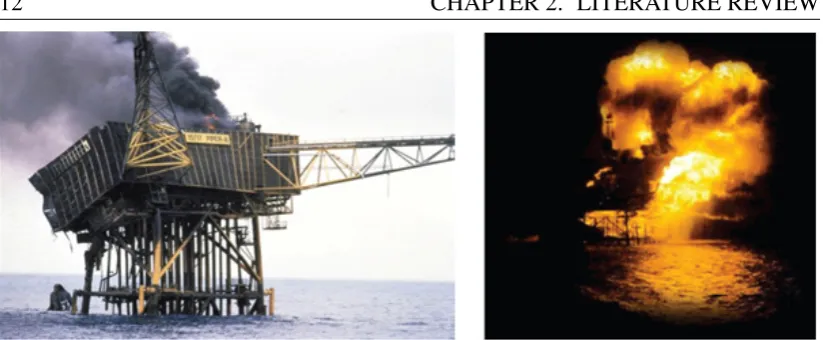
2.7 Images from the Piper Alpha collapse. . . 12
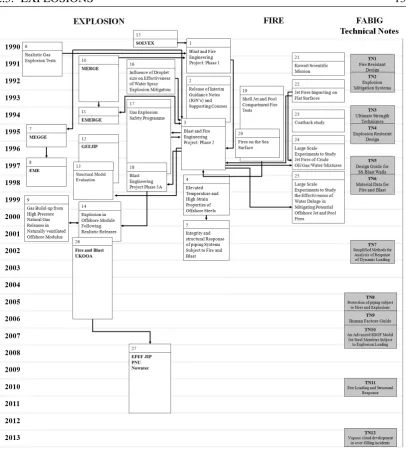
2.8 Timeline of Joint Industry Projects since Piper Alpha incident. . . 13
2.9 Characteristic shapes of (a) Impulsive and (b) Pressure wave. . . 14
2.10 The Schelkin Feedback Loop. . . 15
2.11 Synergetic effect of blast and fragmentation: Time of arrival for M107 155 mm artillery shell[3]. . . 16
2.12 Stress-strain curves for mild steel at various strains[4]. . . 19
2.13 Typical steel-plated structure under blast loading. . . 20
2.14 Effect of membrane action[5]. . . 21
2.15 Failure modes for a clamped beam subjected to blast loading[6]. . . . 22
2.16 Pressure-Impulse chart. . . 25
2.17 The difference between applying pressure in (a) positive direction and (b) negative direction with respect to the plate imperfection. . . 26
2.18 Typical non-linear analysis approach[7]. . . 28
2.19 Transient deformation profile of a clamped mild steel square plate[8]. . 31
2.20 Maximum response for SDOF system (undamped) subject to triangular load pulses with different rise times[9]. . . 32
3.1 Tensile flow instabilities in sheet tensile samples[10]. . . 45
3.2 Comparison of engineering and true stress-strain curve including the Bridgman correction[10]. . . 47
3.3 Stress-strain curves for mild steel at various strains[4]. . . 48
3.4 Typical microstructure of DC01 at (a) 100 (b) 200 and (c) 400 magnification. . . 50
3.5 Schematic diagram of Spilt Hopkinson Tension Bar (SHTB) setup -units in mm. . . 51
3.6 (a) Friction lock and (b) mounted test specimen. . . 51
3.7 Tensile specimens conducted at NTNU - units in mm[11]. . . 52
3.8 Schematic of the novel medium strain rate testing techniques (Mini bar). 53 3.9 Servo-hydraulic testing machine used at (a) NTNU and (b) UoL. . . . 54
3.10 Tensile specimens conducted at UoL - units in mm. . . 54 3.11 True stress versus true plastic strain curves at various strain rates. . . . 56 3.12 Effects of strain rate on the behaviour of Docol form 01 using the
hydro-pneumatic testing machine. . . 58 3.13 Effects of strain rate on the behaviour of Docol form 01 using the SHTB. 58 3.14 Variation in stress-strain over entire batch for Docol form 01. . . 59 4.1 Expanded view of pulse pressure loading rig (PPLR). . . 65 4.2 PPLR assembled with (a) end cover plate and (b) film diaphragm. . . 65 4.3 Detailing of (a) miniature pressure gauge and (b) close up of sensing
area and air leakage issues - units in mm. . . 67 4.4 Test configuration 1 for dynamic load testing. . . 68 4.5 Engineering drawing of (a) characterisation plate and (b) bolt-on
apertures - units in mm. . . 69 4.6 Arrangement of looped wire for bursting the thin diaphragm material. 70 4.7 Characterisation test configuration with the pressure gauge positions
highlighted. . . 70 4.8 Key test measurements during depressurisation of one chamber. . . . 72 4.9 Variation in Tdwith increasing burst area for single diaphragm[12]. . . 72
4.10 Example pressure-time history recorded using test configuration 1 by (a) each pressure transducer and (b) the calculated pressure difference between chamber I and chamber II. . . 73 4.11 Differences between the idealised triangular pulse shape and the actual
experimental pressure-time history data. . . 74 4.12 Repeatability assessment of the new smaller PPLR at nominal
pres-sures of 25 psi and 50 psi using the rigid characterisation plate. . . 74 4.13 Example burst diaphragms for (a) 25 psi test with a single diaphragm
and (b) 50 psi test requiring two diaphragms. . . 75 4.14 Variation in depressurisation time based on number of diaphragms
(skins)[12]. . . 76 4.15 Test configuration 2. . . 77 4.16 Example pressure-time history recorded using test configuration 2
from (a) each pressure transducer and (b) the calculated pressure difference between chamber I and chamber II. . . 78 4.17 Pressure-time history for plate with opening showing construction of
idealised triangular pulse load. . . 79 4.18 Characterisation test configuration with the pressure gauges re-positioned
and highlighted. . . 80 4.19 Pressure variation near to the opening. . . 80 4.20 Variation in (a) rise time, Tr and (b) depressurisation time, Td with
increasing area of hole in rigid plate. . . 81 5.1 (a) Schematic of the restrained plate specimen with the clamped region
shaded and (b) the test rigs support plate and the test specimen which is mounted with 36 bolts - units in mm. . . 84
of the clamping frame shaded and (b) the test rigs support plate and the test specimen which is mounted and restrained with the clamping frame fixed against 2 mm thick spacers via 8 bolts. . . 85 5.3 (a) Typical application where plates with openings are used in bulkheads[1]
and (b) offshore structures. . . 85 5.4 Square component test specimens with circular and extended circular
holes - units in mm. . . 86 5.5 (a) General arrangement of LVDT and (b) fixture between plate and
LVDT. . . 88 5.6 Effect of LVDT on pressure-time history curve. . . 89 5.7 LVDT obstruction of burst diaphragm area. . . 89 5.8 Points taken to map displacement fields for comparison with numerical
and analytical studies. . . 90 5.9 Example plot of results taken by mapping the displacement field of
each test (a) mid-point, (b) diagonal from corners and (c) quarter sections. 91 5.10 Pressure-time curves for restrained plates with circular holes loaded to
(a) nominally 25 psi and (b) nominally 50 psi. . . 93 5.11 Pressure-time curves for restrained plates with extended circular holes
loaded to (a) nominally 25 psi and (b) nominally 50 psi. . . 93 5.12 Pressure-time curves for non-restrained plates with circular holes
loaded to (a) nominally 25 psi and (b) nominally 50 psi. . . 94 5.13 Pressure-time curves for non-restrained plates with extended circular
holes loaded nominally to 50 psi, 25 psi unavailable. . . 94 5.14 Restrained plate (a) with clamping frame, (b) clamping frame removed
and (c) close up inspection around bolts. . . 97 5.15 Deformed shapes of the restrained plates exposed to 50 psi nominal
pressure. . . 101 5.16 Final permanent deflection of restrained plate without opening taking
measurement at (a) mid-point, (b) diagonal from corners and (c) quarter sections. . . 102 5.17 Final permanent deflection of restrained plate with 50 mm opening
taking measurement at (a) mid-point, (b) diagonal from corners and (c) quarter sections. . . 102 5.18 Zeiss Contura G2 coordinate measuring machine. . . 103 5.19 Measured displacement field for a restrained plate using Zeiss Contura
G2 coordinate measuring machine. . . 103 5.20 Comparison between manual profiling and coordinate measuring
ma-chine measurements to obtain the average permanent deflection profile of an experimentally tested restrained plate. . . 104 5.21 Average permanent deflection for all of the restrained plates at the
mid-span loaded nominally to 25 psi (NH - No Hole). . . 104 5.22 Average permanent deflection for all of the restrained plates at the
mid-span loaded nominally to 50 psi (NH - No Hole). . . 105 5.23 Non-restrained plate (a) with clamping frame, (b) clamping frame
removed and (c) close up. . . 105
5.24 Deformed shapes of the non-restrained plates exposed to 50 psi nominal pressure. . . 106 5.25 Final permanent deflection of non-restrained plate without opening
taking measurement at (a) mid-point, (b) diagonal from corners and (c) quarter sections. . . 107 5.26 Final permanent deflection of non-restrained plate with 50 mm
open-ing takopen-ing measurement at (a) mid-point, (b) diagonal from corners and (c) quarter sections. . . 107 5.27 Measured displacement field for a non-restrained plate using Zeiss
Contura G2 coordinate measuring machine. . . 108 5.28 Lateral buckling of a non-restrained plate around the clamping frame. 108 5.29 Average permanent deflection for all of the non-restrained plates at the
mid-span loaded nominally to 25 psi (NH - No Hole). . . 109 5.30 Average permanent deflection for all of the non-restrained plates at the
mid-span loaded nominally to 50 psi (NH - No Hole). . . 109 6.1 Illustration of a two-dimensional shearing of a block showing
La-grangian mesh[13]. . . 113 6.2 Illustration of a two-dimensional shearing of a block showing Eulerian
mesh[13]. . . 113 6.3 ALE vs Lagrangian mesh[14]. . . 114 6.4 Stress-strain (σ-εp) curve of DC01 and fit to the extended Voce
hardening rule. . . 119 6.5 True stress versus true plastic strain curves. . . 119 6.6 Flow stress as a function of strain rate. Experimental data points are
shown as dots and the results obtained with the Modified Johnson-Cook model is shown as a line. . . 120 6.7 Finite element mesh of a restrained plate with a 50 mm central opening
and a characteristic element size of 5 x 5 mm. In (a) the boundary conditions are modelled to simulate the clamped with in-plane restraint boundary conditions. In (b) the boundary conditions are modelled to incorporate the clamped area and the bolts. The bolts are modelled as rigid walls and shown in black. Similar finite element models were generated for the other plate geometries in this investigation. . . 123 6.8 Finite element mesh of a non-restrained plate with a 50 mm central
opening with a characteristic element size of 2.5 x 2.5 mm. Similar finite element models were generated for the other plates in this investigation. . . 125 6.9 Pre-test configuration of (a) experimental arrangement and (b)
numer-ical simulation. . . 125 6.10 Influence of dynamic friction coefficient on non-restrained plate with
75 mm opening loaded nominally to 50 psi. . . 127 6.11 Comparison between numerical and experimental permanent
deflec-tion of restrained plates. . . 129 6.12 Restrained plate failure mechanism - experimental and numerical
comparison (clamped area included for clarity). . . 130
measurement at (a) mid-point, (b) diagonal from corners and (c) quarter sections. Results from numerical simulations are shown as lines and the experimental data are shown as error bars. . . 131 6.14 Final permanent deflection of restrained plate with 100 mm by 125
mm opening taking measurement at (a) mid-point, (b) diagonal from corners and (c) quarter sections. Results from numerical simulations are shown as lines and the experimental data are shown as error bars. . 131 6.15 Final permanent deflection of restrained plate with 50 mm opening
taking measurement at (a) mid-point, (b) diagonal from corners and (c) quarter sections. Results from numerical simulations are shown as lines and the experimental data are shown as error bars. . . 132 6.16 Final permanent deflection of restrained plate with 75 mm by 100
mm opening taking measurement at (a) mid-point, (b) diagonal from corners and (c) quarter sections. Results from numerical simulations are shown as lines and the experimental data are shown as error bars. . 132 6.17 Transient deformation profiles of mild steel square plate[8]. . . 133 6.18 Transient deformation profiles of restrained mild steel square plates
based on the numerical simulations for (a) full plate loaded at a nominal pressure of 50 psi (b) full plate loaded at a nominal pressure of 25 psi. . . 134 6.19 Transient response of restrained plate with 75 mm by 100 mm opening
at a nominal pressure of 50 psi. . . 135 6.20 Fringes of equivalent plastic strain plotted on the permanent deformed
shapes of the various restrained plate designs after 50 psi nominal pressure loading. . . 136 6.21 Comparison between numerical and experimental permanent
deflec-tion of non-restrained plates with and without a dynamic fricdeflec-tion coefficient. . . 138 6.22 Final permanent deflection of non-restrained plate without opening
taking measurement at (a) mid-point, (b) diagonal from corners and (c) quarter sections. Results from numerical simulations are shown as lines and the experimental data are shown as error bars. . . 139 6.23 Final permanent deflection of non-restrained plate with 100 mm
opening taking measurement at (a) mid-point, (b) diagonal from corners and (c) quarter sections. Results from numerical simulations are shown as lines and the experimental data are shown as error bars. . 139 6.24 Final permanent deflection of non-restrained plate 50 by 75 mm
opening taking measurement at (a) mid-point, (b) diagonal from corners and (c) quarter sections. Results from numerical simulations are shown as lines and the experimental data are shown as error bars. . 140 6.25 Final permanent deflection of non-restrained plate with 100 by 125
mm opening taking measurement at (a) mid-point, (b) diagonal from corners and (c) quarter sections. Results from numerical simulations are shown as lines and the experimental data are shown as error bars. . 140
6.26 Non-restrained plate failure mechanism - experimental and numerical comparison. . . 141 6.27 Non-restrained plate failure mechanism (close-up) - experimental and
numerical comparison. . . 142 6.28 Transient deformation profiles of non-restrained mild steel square
plates based on the numerical simulations for (a) full plate loaded at a nominal pressure of 50 psi (b) plate with a 75 mm opening loaded at a nominal pressure of 50 psi. . . 143 6.29 Fringes of equivalent plastic strain plotted on the permanent deformed
shapes of the various non-restrained plate designs after 50 psi nominal pressure loading. . . 144 6.30 Equal pressure-time history applied to each plate geometry. . . 146 6.31 Comparison between the numerical and experimental permanent
de-flection of restrained plates, when applying a constant pressure-time history to all plate geometries at 25 and 50 psi. . . 147 6.32 Comparison between the numerical and experimental permanent
de-flection of non-restrained plates with a 0.1 dynamic coefficient, when applying a constant pressure-time history to all plate geometries at 25 and 50 psi. . . 148 6.33 Permanent deflection of restrained plates with an equal pressure-time
history applied to all plate geometries at (a) 25 psi and (b) 50 psi (NH - No Hole). . . 149 6.34 Permanent deflection of non-restrained plates with an equal
pressure-time history applied to all plate geometries at (a) 25 psi and (b) 50 psi (NH - No Hole). . . 150 6.35 Idealised geometry of a quarter section of the test rig[15]. . . 151 6.36 High pressure flowing out of idealised pressure tank[15]. . . 152 6.37 Experimental pressure-time curve for a restrained plate with circular
holes loaded nominally to 25 psi, compared to the Eulerian model prediction[15]. . . 152 6.38 Comparison of recorded pressure-time history from experiments and
FSI simulations[16]. . . 153 6.39 Pressure-time history from FSI simulations of the 25 psi nominal
pressure test compared with the measured results[16]. . . 154 7.1 Velocity profiles at differnet stages of response for a clamped plate. . . 158 7.2 Plate-with-hole geometry and large-deformation mode shape for (a)
rectangular hole and (b) rectangular hole with circular ends. . . 162 7.3 Mode shape of rigid-plastic plate with yield lines adopted for plate
geometry having rectangular holes with or without circular ends. . . . 164 7.4 Pressure-time history for plate with opening showing construction of
idealised triangular pulse load. . . 169 7.5 Comparison between analytical and experimental permanent
deflec-tion of restrained plates. . . 172
measurement at (a) mid-point, (b) diagonal from corners and (c) quarter sections. Results from analytical simulations are shown as lines and the experimental data are shown as error bars. . . 174 7.7 Final permanent deflection of restrained plate with 50 mm by 75
mm opening taking measurement at (a) mid-point, (b) diagonal from corners and (c) quarter sections. Results from analytical simulations are shown as lines and the experimental data are shown as error bars. . 174 7.8 Final permanent deflection of restrained plate with 75 mm by 100
mm opening taking measurement at (a) mid-point, (b) diagonal from corners and (c) quarter sections. Results from analytical simulations are shown as lines and the experimental data are shown as error bars. . 175 7.9 Final permanent deflection of restrained plate with 100 mm by 125
mm opening taking measurement at (a) mid-point, (b) diagonal from corners and (c) quarter sections. Results from analytical simulations are shown as lines and the experimental data are shown as error bars. . 175 7.10 Comparison between analytical and experimental permanent
deflec-tion of non-restrained plates. . . 177 7.11 Comparison between numerical and analytical permanent deflection of
restrained plates using a constant peak pressure for all plate designs. . 180 7.12 Comparison between numerical and analytical permanent deflection of
non-restrained plates using a constant peak pressure for all plate designs.180 7.13 Maximum response for SDOF system (undamped) subject to triangular
load pulses with different rise times[9]. . . 182 7.14 Load-deflection curve for quasi-static energy analysis showing
lin-earized function over range of data. This solution included bending energy as well as membrane energy terms for a square plate with no hole. The bending energy contribution over this large deflection range accounts for about 1% of the resistance. . . 183 A.1 Final permanent deflection of restrained plate with 50 mm by 75
mm opening taking measurement at (a) mid point, (b) diagonal from corners and (c) quarter sections. . . 204 A.2 Final permanent deflection of restrained plate with 75 mm opening
taking measurement at (a) mid-point, (b) diagonal from corners and (c) quarter sections. . . 204 A.3 Final permanent deflection of restrained plate with 75 mm by 100
mm opening taking measurement at (a) mid-point, (b) diagonal from corners and (c) quarter sections. . . 205 A.4 Final permanent deflection of restrained plate with 100 mm opening
taking measurement at (a) mid-point, (b) diagonal from corners and (c) quarter sections. . . 205 A.5 Final permanent deflection of restrained plate with 100 mm by 125
mm opening taking measurement at (a) mid-point, (b) diagonal from corners and (c) quarter sections. . . 206
A.6 Final permanent deflection of non-restrained plate with 50 mm by 75 mm opening taking measurement at (a) mid-point, (b) diagonal from corners and (c) quarter sections. . . 207 A.7 Final permanent deflection of non-restrained plate with 75 mm
open-ing takopen-ing measurement at (a) mid-point, (b) diagonal from corners and (c) quarter sections. . . 207 A.8 Final permanent deflection of non-restrained plate with 75 mm by 100
mm opening taking measurement at (a) mid-point, (b) diagonal from corners and (c) quarter sections. . . 208 A.9 Final permanent deflection of non-restrained plate with 100 mm
opening taking measurement at (a) mid-point, (b) diagonal from corners and (c) quarter sections. . . 208 A.10 Final permanent deflection of non-restrained plate with 100 mm by
125 mm opening taking measurement at (a) mid-point, (b) diagonal from corners and (c) quarter sections. . . 209
List of Tables
2.1 World statistics between 1990-2007[17]. . . 11
2.2 Influence of strain rate on material response, including testing methods and typical applications for each velocity regime[18]. . . 18
2.3 Various computer programs used to simulate blast-effects[19]. . . 27
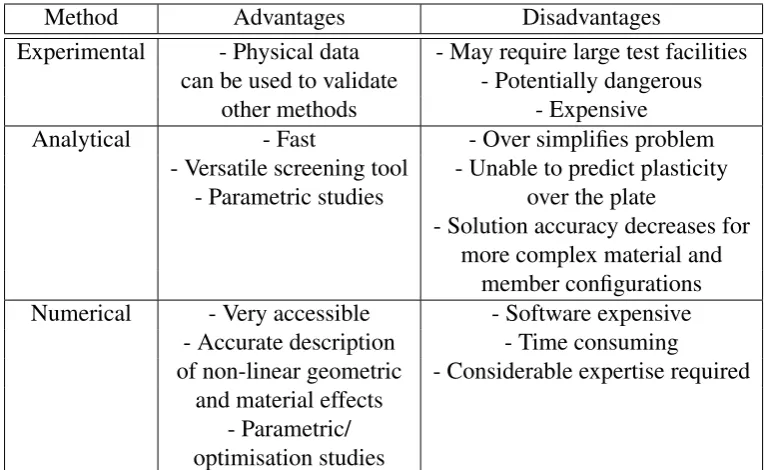
2.4 Advantages and disadvantages for the different methods of modelling structural response to blast. . . 29
2.5 Summary of deformation criteria for various structural components[20]. 35 2.6 Risk Matrix[21]. . . 37
3.1 Tensile testing experimental programme. . . 50
3.2 Material data for engineering strain-rate tests conducted at NTNU. . . 55
3.3 Material data for true strain-rate tests conducted at NTNU. . . 56
3.4 Material data for strain-rates tests conducted at UoL. . . 57
3.5 Average material properties obtained from static tensile tests. . . 59
4.1 Itineracy of equipment required for PPLR. . . 66
5.1 Scaling relationships. . . 87
5.2 Key pressure-time history parameters. . . 89
5.3 Results for the 0.5 m x 0.5 m restrained plates loaded nominally to 25 psi. . . 95
5.4 Results for the 0.5 m x 0.5 m restrained plates loaded nominally to 50 psi. . . 95
5.5 Results for the 0.5 m x 0.5 m non-restrained plates loaded nominally to 25 psi. . . 96
5.6 Results for the 0.5 m x 0.5 m non-restrained plates loaded nominally to 50 psi. . . 96
6.1 Material parameters for MJC constitutive relation and CL fracture criteria. . . 121
6.2 Details of mesh convergence study on restrained plate with 50 mm hole and 50 psi nominal test pressure. . . 124
6.3 Details of mesh convergence study on non-restrained plate with 100 by 125 mm hole and 50 psi nominal test pressure, without friction coefficient. . . 126
6.4 Details of mesh convergence study on non-restrained plate with 100 by 125 mm hole and 50 psi nominal test pressure, with a dynamic friction coefficient of 0.1. . . 127
6.5 Numerical simulations of 0.5 m x 0.5 m restrained plates loaded nominally to 25 psi. . . 128 6.6 Numerical simulations of 0.5 m x 0.5 m restrained plates loaded
nominally to 50 psi. . . 128 6.7 Numerical simulations of 0.5 m x 0.5 m non-restrained plates loaded
nominally to 25 psi with 0.1 dynamic friction coefficient. . . 137 6.8 Numerical simulations of 0.5 m x 0.5 m non-restrained plates loaded
nominally to 50 psi with 0.1 dynamic friction coefficient. . . 137 6.9 Equal pressure-time parameters applied to all plate geometries and
boundary conditions. . . 145 6.10 Numerical simulations of 0.5 m x 0.5 m restrained plates using a
constant pressure-time history with a peak pressure of 25 psi. . . 146 6.11 Numerical simulations of 0.5 m x 0.5 m restrained plates using a
constant pressure-time history with a peak pressure of 50 psi. . . 146 6.12 Numerical simulations of 0.5 m x 0.5 m non-restrained plates using a
constant pressure-time history with a peak pressure of 25 psi. . . 147 6.13 Numerical simulations of 0.5 m x 0.5 m non-restrained plates using a
constant pressure-time history with a peak pressure of 50 psi. . . 147 7.1 Material parameters for simplified analytical approach. . . 170 7.2 Simplified analytical model of 0.5 m x 0.5 m restrained plates loaded
nominally to 25 psi. . . 171 7.3 Simplified analytical model of 0.5 m x 0.5 m restrained plates loaded
nominally to 50 psi. . . 172 7.4 Simplified analytical model of 0.5 m x 0.5 m non-restrained plates
loaded nominally to 25 psi. . . 176 7.5 Simplified analytical model of 0.5 m x 0.5 m non-restrained plates
loaded nominally to 50 psi. . . 177 7.6 Simplified analytical model of 0.5 m x 0.5 m restrained plates loaded
at 25 psi. . . 178 7.7 Simplified analytical model of 0.5 m x 0.5 m restrained plates loaded
at 50 psi. . . 179 7.8 Simplified analytical model of 0.5 m x 0.5 m non-restrained plates
loaded at 25 psi. . . 179 7.9 Simplified analytical model of 0.5 m x 0.5 m non-restrained plates
loaded at 50 psi. . . 179
Nomenclature
Acronyms
Definition
ALARP As Low As Reasonably Practicable.
ALE Arbitrary Lagrangian Eulerian.
API American Petroleum Institute.
CFD Computational Fluid Dynamics.
CMM Coordinate Measuring Machine.
CSM Computational Solid Mechanics.
DC01 Docol form 01 mild steel.
DDESB Department of Defence Explosives Safety board.
DIC Digital Image Correlation.
DIF Dynamic Increase Factor.
DLA Ductility Level Analysis.
DLB Ductility Level Blast.
FABIG Fire And Blast Information Group.
FEM Finite Element Model.
FSI Fluid Structure Interaction.
HSE Health and Safety Executive.
HV Vickers Hardness.
ISO International Organisation for Standardisation.
JIP Joint Industry Project.
LVDT Linear Voltage Displacement Transducer.
PSI Pounds per Square Inch.
SCI The Steel Construction Institute.
SDOF Single Degree Of Freedom.
SHTB Split Hopkinson Tension Bar.
SIF Strength Increase Factor.
SLA Strength Level Analysis.
SLB Strength Level Blast.
SRI Selective Reduced Integration.
TNT Explosive (Trinitrotoluene).
UKOOA United Kingdom Offshore Operators Association.
UTS Ultimate Tensile Strength.
Symbols
Definition
A Yield stress parameter in Modified Johnson-Cook model.
a Typical dimension of a plate in a plane.
B Strain-hardening parameter in Modified Johnson-Cook model.
C Strain-rate sensitivity parameter in Modified Johnson-Cook model.
D Cowper-Symonds coefficient.
E Young’s modulus of elasticity.
H Storey height.
h Plate thickness.
n Strain-hardening parameter in Modified Johnson-Cook model.
q Cowper-Symonds coefficient.
q Reduction area.
T Relative fundamental period of vibration.
w Maximum transverse deflection of the plate.
Greek Symbols
Definition
β Geometric scale factor.
δ Relative sidesway deflection. ˙
ε Average strain rate.
µ Ductility ratio.
ρ Mass density.
θ Maximum member end rotation (degrees).
υ Poisson’s ratio.
Subscripts
Definition
Σ00 Dynamic flow stress in a large-scale model. σ00 Dynamic flow stress in a small-scale model.
A◦ Original area.
Aneck Area at fracture.
ef Elongation.
L◦ Original length.
Lf Final length.
Pmax Maximum pressure.
td Time duration of an explosion.
Td Depressurisation time.
Tr Time taken to achieve the maximum pressure.
Chapter 1
Introduction
To civilians, the wordexplosiongenerally evokes a destructive image, with thoughts of bombs, chemical plant accidents or other violent scenarios. In most cases explosions are not destructive at all, but are planned and controlled events. Such examples are explosion blasting in quarries, tunnelling, earth moving and controlled cratering. Less well-known uses of controlled explosions are for explosive forming of metals, explosive welding and demolition of buildings. This illustrates that the vast majority of explosions are controlled and benign.
The events that do capture the attention of society are accidental explosions or terrorist attacks, which can, and do, cause unplanned destruction, injury and death. Structural response to explosion loading is therefore of concern to many different industries, including transport, offshore, defence and nuclear.
The focus of this study is on accidental explosions that arise on offshore installations, which is an inherent risk when producing, processing, storing and transporting hydrocarbons. Before an explosion can occur a chain of events must unfold, namely the release of a hydrocarbon, the formation of a vapour cloud (caused by confinement) and finally an ignition source. Any break in this chain could prevent such a disaster. Due to the high costs associated with offshore facilities they are typically complex, and highly congested, making identification of leaks and preventing confinement extremely difficult. This coupled with many sources of ignition means that a leak is likely to lead to a hydrocarbon gas explosion and can result in significant levels of structural damage.
This was tragically illustrated in July 1988, with the Piper Alpha platform disaster[22] where the consequences of an ignition led to the complete loss of the
facility and the death of 167 personnel. As a direct result of this disaster several research initiatives were proposed and funded by government and industry. The aim of these projects was to gain a greater understanding of the loadings characteristics and the structural response of offshore structures subjected to hydrocarbon explosions and subsequent fires. Another requirement was to find suitable mitigation options for the offshore industry. Over £1billion has been spent in this area, however accidents continue to occur. Recent disasters include the Deep Water Horizon disaster (2010)[23] and the Amuay refinery in Venezuela (2012), which resulted in 69 personnel losing their lives. This highlights that there are still many uncertainties in our knowledge and that further understanding is required in order to reduce the consequences of such hydrocarbon explosions offshore.
One of the major uncertainties that still remain is the accurate evaluation of explosion loading. Large variations in the level of congestion, confinement, leak parameters, and position of the explosion make it extremely difficult to define nominal blast values to be used in design. Recent large-scale explosion tests[24] have shown that overpressures can be as high as 4 bar, much higher than previously considered and more importantly, designed for. Surprisingly, there are gaps in current knowledge offshore, relating to structural component robustness and resilience against blast loading, especially at these higher overpressures.
1.1
The generic problem
1.2. SCOPE 3
1.2
Scope
Improving the ability to predict the behaviour of plates subjected to dynamic loading allows for safer, lighter and more economical protective engineering design solutions. As a result, a considerable amount of research relating to plates subjected to blast loading has been carried out in the past. Topics of interest include the effects of boundary conditions, stiffening and quasi-static, dynamic and impulsive loading conditions. There is a large amount of information regarding the response of full plates subjected to extreme loading in the open literature, while the response of plates with openings has received far less. Large openings are known to decrease the ultimate strength of plates, but they are also known to lower overpressures, through venting. Due to the complexity, safety issues and cost in conducting large scale experiments, they are often left to government research establishments and much of the results are not published openly.
1.3
Aims and Objectives
The primary aim of this research was to gain a better understanding of the effects that openings have on the overall performance of thin plated structures when subjected to pulse pressure loading. The secondary aim of the study was to assess how in-plane displacements at the support can significantly change the response of such a structure. This required a number of objectives to be accomplished:
• To investigate the material behaviour of 1.1 mm thick mild steel plate under uniaxial tensile loading in the quasi-static to the dynamic strain range,
• To develop new novel laboratory scale test procedures to produce controlled, repeatable semi-confined loading conditions on plated specimens with and without openings using a differential pressure device,
• To investigate the overall performance of thin plated structures with and without openings using the differential pressure device whereby opening size/shape and the restraint at the boundary conditions will be assessed, and
1.3.1
Arrangement of thesis
This research used a range of techniques, namely material characterisation, experimen-tal component testing, finite element modelling and analytical modelling. Hence, this thesis has been arranged as follows:
Chapter 2: provides a review of relevant literature required to address the objectives of this research. This chapter covers key concepts which will provide the foundation for future chapters.
Chapter 3:investigates the stress-strain relationships for mild steel used within this study. This experimental work enabled suitable constitutive relations to be chosen in future chapters, which were capable of correlating stress, strain and strain rate.
Chapter 4:describes the development of novel laboratory scale test procedures capable of producing controlled, repeatable loading on plated structures using a differential device. Preliminary tests were conducted to determine the parameters and the test rig configuration.
Chapter 5:details the experimental component tests carried out which played a central role in this research project. Using the test configuration developed in Chapter 4, the rig was used to produce an extensive set of well-defined data that was essential for validation of numerical and analytical models.
Chapter 6:details the development of full 3D finite element models of pressure-loaded plates with and without openings. This involved calibrating the material properties against results from Chapter 3 and incorporating the recorded pressure-time histories from the component tests in Chapter 5. Additional modelling of the boundary conditions also considered frictional effects. The results are presented and validated against the component tests conducted in Chapter 5.
Chapter 7: presents an energy approach for predicting the large inelastic deformation in thin plates, with and without a central opening. The results are presented and also validated against the component tests from Chapter 5. This simplified approach demonstrates that adequate engineering estimates can be achieved, for such problems.
Chapter 2
Literature Review
A detailed literature review was conducted to gain an understanding of published works related to plates subjected to transient loading. This review begins with a broad overview of the subject and then narrows into studies directly related to the research topic.
2.1
Plates
Plates resist transverse loads by developing shear forces, bending and twisting moments. For isotropic plates these loads are generally carried in both directions with the influence of twisting rigidity being significant. This means that a plate is considerably stiffer than a beam of comparable span and thickness. Therefore plates can be lightweight yet still deliver a high load-carrying capacity.
This favourable strength to weight ratio leads to economical advantages and is why steel plates are extensively used in all fields of engineering for large-scale structures. Examples of such applications are containers, ships, bridges and offshore installations, and are shown in Figure 2.1.
Plates resist transverse loads by means of bending (flexural response). The flexural properties of a plate are heavily dependent on its thickness in relations to its other dimensions. Plates are therefore typically classified into three groups depending on the ratio between a typical dimension of a plate in a plane [a] and the plate thickness [h].
Figure 2.1: Examples of steel plates utilised in industry.
1. Thickplates tend to have ratio approximately:
a/h≤8 (2.1)
2. Membraneswith a ratio of:
a/h≥80 (2.2)
3. Thinplates with a ratio of:
8≤a/h≤80 (2.3)
This final category is the most extensively used in industry and is subdivided again depending on a ratio betweenw/h, where w is the maximum deflection of the plate.
1. The plate is regarded asstiff i.e. flexurally rigid when:
w/h≤0.2 (2.4)
2. The plate is regarded asflexiblewhen:
w/h≥0.3 (2.5)
2.2. OFFSHORE INSTALLATIONS 7
negligible[26]. Membranes carry transverse loads by axial tensile forces (including shear forces) acting in the middle surface of the plate. This is known as membrane forces. As mentioned above the final category is broken down into stiff and flexible thin plates. Stiff plates carry loads two dimensionally, mainly through bending and twisting moments and by transverse shear loads. Membrane forces are considered negligible. Flexible plates are a combination of stiff plates and membranes, carrying loads through internal moments, shear forces and membrane forces. When the maximum transverse deflection is considerably greater than the plate thickness (w/h>5) it is well established that membrane forces dominate and that the flexural resistance can be neglected. As such the stress is uniformly distributed over the plate thickness. This research focuses on plates that act as a membrane where the thickness is very small in relation to the other planar dimensions. These plates are extensively used in ship bulkheads and topside offshore installations.
2.2
Offshore installations
There are many types of offshore installations and further details along with their applicability can be found in reference 43. The focus of this study is to consider the effect openings have on the performance of thin plated structures found on offshore topsides and ship bulkheads, when subjected to dynamic loading.
2.2.1
Plate applications
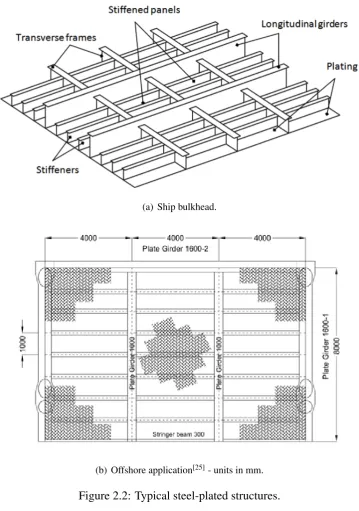
Thin plates are an integral part of ship structures and offshore oil platforms and plates usually span between primary structural members. Figure 2.2 shows typical configurations for such applications.
(a) Ship bulkhead.
[image:32.595.106.466.106.618.2](b) Offshore application[25]- units in mm.
Figure 2.2: Typical steel-plated structures.
2.2. OFFSHORE INSTALLATIONS 9
Plates with openings
The inclusion of an opening in a plated section is common practice for reducing weight, access for utilities or for general inspection, with typical scenarios shown in Figure 2.4.
(a) Ship bulkhead. (b) Offshore application.
Figure 2.4: Typical applications where plates with openings are used in (a) bulkheads[1] and (b) offshore structures.
Steel-plated boundary conditions
In continuous plated structures, the edges of plates are usually supported by beam members (e.g., stiffeners). Paik and Thayamballi[27]highlight that the bending rigidity of these boundary support members are normally quite large in comparison to the plate itself. Therefore when analysing such structures it can be assumed that the support members on all four sides remain in the same plane. When the plates are laid on top of the supporting beams continuous fillet welds are applied at the interfaces between deck bottom plates and top flanges of the beams. Ali[25] states that with these connections the boundary conditions of the deck plates can be regarded as fixed supports.
2.2.2
Offshore challenges
are over 7,000 offshore platforms around the world with the plants becoming more complex, larger, extracting deeper (in excess of 2500 m) and being placed in more extreme environments, where space is limited and very costly. Due to the high cost of offshore installations these are typically very congested combining living quarters, control rooms, escape routes, evacuation facilities, critical structural supports, and safety-critical items[28] shown in Figure 2.5. Offshore rigs are now based all over the world ranging from the North Sea (off the coast of the UK) to the Gulf of Mexico with a variety of structural solutions. Due to the variety of type, size, environment, function, man power and geometrical configuration along with material selection it is extremely difficult to provide specific design guidance.
Figure 2.5: Typical offshore installation layout.
As the extraction processes improves and the price of oil increases many offshore installations are being used well beyond their intended and more importantly their designed lifespan. Deterioration is therefore a factor which must be managed vigilantly.
2.2.3
Threat
What are the hazards?
2.2. OFFSHORE INSTALLATIONS 11
Table 2.1: World statistics between 1990-2007[17]. Explosion/Fire Structural Failure Collision/Vendor
41 11 31
What is the risk of an explosion?
[image:35.595.205.415.322.480.2]The probability may be small however the consequences of an explosion can be catastrophic both in terms of personnel and material losses. Thus the risk is quite high and comparable with other random events taken account in the design of offshore structures[30]. The probability of a hydrocarbon explosion occurring and the magnitude of the overpressure are highlighted in Figure 2.6.
Figure 2.6: Frequency of Exceedance-Pressure[2].
What are the consequences of an explosion?
As shown in Figure 2.6 the probability of such an event occurring is small however the implications are huge. This was tragically illustrated in the July 1988 with the Piper Alpha platform disaster (Figure 2.7), where a small explosion in a compressor module escalated into a large fire which ultimately led to the death of 167 personnel, the worst in the entire history of offshore operations.
Figure 2.7: Images from the Piper Alpha collapse.
safety on offshore structures. A time line showing the progress made through this work and the release of Technical Notes by the Fire and Blast Information Group (FABIG) is shown in Figure 2.8.
2.3. EXPLOSIONS 13
Figure 2.8: Timeline of Joint Industry Projects since Piper Alpha incident.
2.3
Explosions
A shock wave in gas (air) can be defined as a fully developed compres-sion wave of large amplitude, across which density and particle velocity change drastically[32](Figure 2.9(a)). Shock waves are usually caused from high explosives (e.g. TNT) or from an extremely energetic vapour cloud explosion.
A pressure wave can be defined as the air wave set in motion by an explosion[32] (Figure 2.9(b)).
Figure 2.9: Characteristic shapes of (a) Impulsive and (b) Pressure wave.
Figure 2.9 shows the idealised characteristic shapes for impulsive and pressure waves. In reality a typical hydrocarbon explosion pressure wave has a complex variation with respect to time involving many oscillations with varying frequencies.
2.3.1
Explosion mechanism
Due to the highly congested manner of offshore facilities a blast wave will interact with obstacles, such as equipment and piping. The Schelkin feedback mechanism (Figure 2.10) neatly characterises the influencing factors in a hydrocarbon explosion.
Other factors such as wind speed/direction, leak rate/duration/position and concentration ratio have a pivotal effect on the magnitude of an explosion. Such sensitivity to a large array of variables makes predicting the potential consequences extremely difficult.
2.3.2
Fluid structure interaction
2.3. EXPLOSIONS 15
Figure 2.10: The Schelkin Feedback Loop.
instances the structure will deform as the shock waves hits. Kambouchev et al.[33]
(2006) proved that actual impulse on a deformable structure is less than for the rigid wall case, making this assumption conservative.
2.3.3
Fragmentation
During an explosion event there is the potential for equipment to be damaged, causing flying debris. These fragments can cause great damage to structures when they strike at high speeds. UFC 3-340-02[20] divides fragments into two categories known as primary and secondary fragments. The effects of fragmentation are beyond the scope of this project.
2.3.4
Synergetic effects of blast and fragmentation
The combined effects of blast and fragmentation have been well documented in experiments[34][35]. Rakvag[3] highlights that there are three possible scenarios for this effect, shown in Figure 2.11 and described below:
1. Close Range:Blast arrives before fragments.
2. Medium range:Blast and fragments arrive simultaneously (approximately). 3. Long range:Blast arrives after fragments.
Figure 2.11: Synergetic effect of blast and fragmentation: Time of arrival for M107 155 mm artillery shell[3].
2.4
Blast resistant design
Mays and Smith[36]produced a list of key conditions which usually apply for designing against blast loading for buildings. These have been reproduced below, as they are still applicable for offshore installations, with additional information placed within brackets:
1. The incident will be an unusual event.
2. The threat will be specified in terms of an explosive charge weight at a stand-off, which can only be an estimate and already subject to a risk assessment (in the case of offshore this will be an overpressure load from a hydrocarbon explosion).
3. For economic design, some plastic deformation is normally permitted. The level of damage is specified in terms of the limiting member deflection or support rotations.
4. The strength of the materials will be enhanced because of high rate of strain to which they will be subjected.
5. The strengths of in situ materials often exceed the characteristic values.
2.4. BLAST RESISTANT DESIGN 17
2.4.1
Mitigation
The most common method used to mitigate the effects of a blast onshore is to increase the stand off distance between a flammable material and an ignition point. Another is to use concrete as a barrier due to its mass and ability to absorb large amounts of energy including fragments. However as discussed previously in Section 2.2.2 this is often impracticable for offshore facilities as space and weight are key factors in design. Therefore to mitigate blasts offshore structures usually employ the following:
1. Water deluge systems- these systems are flexible and relatively inexpensive to install and have shown to decrease the overpressure from a gas explosion[37]. However concerns over system detection of gas/fires along with the potential risk of ignition initiated by the water contacting electrical components are still prominent issues to be solved.
2. Blast and fire walls- increased energy absorption usually accomplished through plastic deformation and design guidance considering ductility ratios and maxi-mum support rotation[38].
3. Venting- carefully considered layout of equipment and venting arrangements can significantly reduce the magnitude of potential overpressures from an explosion.
2.4.2
Offshore material characteristics
For offshore blast resistant designs it is desirable for a structure to be lightweight and deform plastically. The structure must therefore combine strength with ductility. The yield strength of a steel material can actually be greater than the specified minimum values given in the codes and standards. A strength increase factor (SIF) is used to account for this in design and UFC-3-340-02[20] suggests using SIF = 1.1 for yield strengths lower than 345 MPa. Ductility is the ability of a metal to flow plastically before fracture. A high ductility indicates that a material is forgiving and likely to deform locally without fracture[39].
methods and their effects on a material. This is reproduced here for reference in Table 2.2. Typical overpressures from accidental explosions on topside structures are between 0.3 bar and 2 bar, with load durations generally between 50 ms to 200 ms[41]. However, research conducted by the Steel Construction Institute proved that these overpressures can be as high as 4 bar[24].
Table 2.2: Influence of strain rate on material response, including testing methods and typical applications for each velocity regime[18].
Velocity regime
Strain rate(s−1)
Testing method for the material
Effect on material
Application Low velocity
0-50 m/s
<10 Quasi-static: testing machines: - hydraulic - servo-hydraulic - screw-driven - primarily elastic - some local plasticity
- dropped weight - vehicle impact - ship collision - crashworthiness of containers for hazardous materials
Sub-ordnance 50-500 m/s
10−104 - pneumatic - hydraulic - Taylor tests - Split Hopkinson Tension bar (SHTB)
- primarily plastic
- design of nuclear containment - free falling bombs and missiles - fragment due to accidental explosions Ordnance
500-1300 m/s
103−104 - Taylor tests - SHTB
- viscous material - strength still significant
- military applications
- military projectiles like bullets, missiles - high kinetic energy penetrators with/ without explosives Ultra-ordnance 1300-3000 m/s
104−106 - plate impact - fluid behaviour in materials - pressures approach/exceed material strength - material density significant
- warhead fragments - rocket bursted penetrators
Hypervelocity 3000-12000 m/s
106−108 - plate impact - hydrodynamic material
- compressibility - vaporisation
2.5. VULNERABILITY OF PLATED STRUCTURES 19
[image:43.595.173.451.232.442.2]Under dynamic loading it is well known that materials in general achieve a strength increase. The response of mild steel under dynamic loading at high strain rates is significantly different from the response under static loading[42]. This phenomena is highlighted in Figure 2.12 showing that the yield strength can be more than doubled and the ultimate strength increased to up to 30 percent. Such attributes can be described as a dynamic increase factor (DIF).
Figure 2.12: Stress-strain curves for mild steel at various strains[4].
These factors must be incorporated into the design phase to be able to accurately understand how a structure will respond and to provide appropriate connection details for an allowable response. If possible the actual stress strain curve material data should be used.
2.5
Vulnerability of plated structures
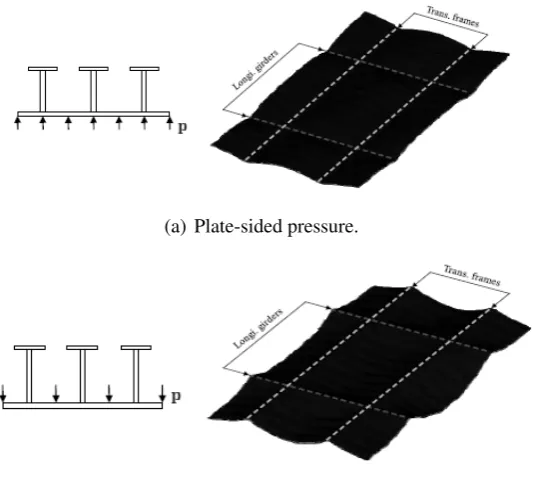
During an explosion, plates deform in the same direction of the pressure loading (Figure 2.13), implying that the rotational restraint along the support member boundaries are large. Thus, it may be assumed that the plate is clamped on all four edges[43]. The response of the plate is similar in both directions of loading.
(a) Plate-sided pressure.
[image:44.595.155.422.197.436.2](b) Stiffener-sided pressure.
Figure 2.13: Typical steel-plated structure under blast loading.
2.5.1
Components response
2.5. VULNERABILITY OF PLATED STRUCTURES 21
Figure 2.14: Effect of membrane action[5].
This membrane action causes very large forces, meaning the tensile members, the plate, compression members and the connections between all of these needs to be carefully checked in order to prevent potential failure. In light of this FABIG discuss this in detail in Technical notes 4[44] and 5[45]. Membrane action is well known to substantially enhance the load carrying capacity of plates, which can be advantageous. However, a negative consequence of this is the plate becomes stiffer, thus reducing the amount of energy it can absorb in bending, resulting in higher loads being transferred through to the primary structure.
2.5.2
Strengthening of offshore topsides structures
1. Addition of plates to the deck floors.
2. Tying decks together using vertical connections.
3. Filling voids between top module support frames and bottom of modulus.
All of these methods involve additional weight and stiffening of the structure, which will actually reduce the member’s ductility and ability to absorb energy. Further details of methods for improving the structural connections on topside structures can be found in reference 25.
2.5.3
Failure modes
Many deformation and fracture modes of structures have been observed experimentally over the years and comprehensively compiled in excellent reviews and books[46][47]. Menkes and Opat[6]were the first to establish the three basic failure modes for clamped beams when subjected to blast loadings. These failure modes are illustrated in Figure 2.15.
(a) Mode I: Large inelastic deformation.
(b) Mode II: Tensile tearing at the support.
[image:46.595.124.401.442.736.2](c) Mode III: Transverse shear loading.
2.6. STRUCTURAL RESPONSE MODELLING 23
Teeling and Nurick[48] later observed similar modes on fully clamped circular plates and Nurick and Shave[49] for fully clamped rectangular plates. Nurick and Shave’s[49] investigation on the thinning and subsequent tearing at the boundary conditions further divided these, fully listed below:
1. Mode I: Large ductile deformation - deflection increase with increasing impulse.
2. Mode II*: Partial tensile tearing and shear lift over supports midpoint deflection increase with increasing impulse.
3. Mode IIa: Complete tensile tearing with increasing deformation - midpoint deflection increase with increasing impulse.
4. Mode IIb: Complete tensile tearing with decreasing deformation - midpoint deflection increase with increasing impulse.
5. Mode III: Plate completely torn from the supports - negligible midpoint deflec-tion.
2.6
Structural response modelling
Structural response to explosion loading is investigated using several methodologies, namely experimental studies, theoretical modelling and numerical simulations. These can be used independently or in conjunction with one another. The choice depends on the level of accuracy desired, which is based on time, cost and expertise available.
2.6.1
Experimental methods
Physical explosion testing on large-scale structures can be dangerous and requires specific, large and expensive testing facilities. To be able to accurately describe an explosion event it is important that both the loading and the response of structures are measured in a controlled, repeatable and accurate manner. This can be very difficult when dealing with a blast event. There are several techniques used to do this:
1. Air pressure waves from TNT or shock tubes.
3. Under water explosives.
4. Pressure pulse created by a Pulse Pressure Loading Rig (PPLR).
Problems arise with the use of types 1,2 and 3 mainly with the repeatability of the loading. Each explosion will have heat and light losses unique to each experiment. The PPLR on the other hand can apply a pulse pressure load with finite rise time by creating a pressure differential between two chambers. This produces controlled and repeatable loading representative of typical overpressures from accidental explosions on topside structures.
Due to the complexity, safety issues and cost in conducting such experiments, tests are often left to government research establishments and much of the results are not published openly. The PPLR will be utilised in this research in order to provide valuable insights into the problem herein, and will be discussed in greater detail in Chapter 4.
2.6.2
Analytical modelling
Structural response modelling to blast loading has been studied extensively for many decades and can be broken down in exact and approximate solutions.
Exact theoretical solutions[26][50] can be mathematically laborious to derive of-ten involving the use of numerical methods. This can be time consuming and expensive with solutions limited in application to structures with infinitesimal displacements or elastic response. This is often unrealistic for the response of thin structures subjected to extreme transverse loading as considerable plasticity is expected.
Due to the severe limitations of exact solutions several approximate analytical methods were developed. Approximate methods are usually considered adequate for dynamic structural response due to many uncertainties of the spatial and temporal characteristic of dynamic impact loads and of the dynamic material properties. This permits rapid analysis with reasonable engineering accuracy for even complex structures. Several excellent reviews are available in literature[47], and the key details are briefly highlighted here.

![Figure 2.6: Frequency of Exceedance-Pressure[2].](https://thumb-us.123doks.com/thumbv2/123dok_us/8074943.227483/35.595.205.415.322.480/figure-frequency-of-exceedance-pressure.webp)
![Figure 2.12: Stress-strain curves for mild steel at various strains[4].](https://thumb-us.123doks.com/thumbv2/123dok_us/8074943.227483/43.595.173.451.232.442/figure-stress-strain-curves-mild-steel-various-strains.webp)
![Figure 2.15: Failure modes for a clamped beam subjected to blast loading[6].](https://thumb-us.123doks.com/thumbv2/123dok_us/8074943.227483/46.595.124.401.442.736/figure-failure-modes-clamped-beam-subjected-blast-loading.webp)