SCITECH
Volume 9, Issue 1RESEARCH ORGANISATION
August 5, 2017Journal of Research in Business, Economics and Management www.scitecresearch.com
Perceptions and Predictions of Service Quality-Customer
Satisfaction of Conventional and Islamic Banks in the GCC
Region
Mohammad T. Al-Deehani
1, Talla M. Aldeehani
2 1National Bank of Kuwait.2College of Business Administration, Kuwait University.
Abstract
The purpose of this paper is to investigate differences in the perceived relationship of service quality (SERVQUAL)-customer satisfaction between conventional and Islamic banks in the Gulf Council of Arab Countries (GCC) region. We solicited survey responses from bank clients in all six countries of the region. Data reliability tests were applied followed by factor analysis to shortlist individual items of SERVQUAL into few manageable constructs. Nonparametric ranking tests were used to identify levels of importance of constructs. A nonparametric multiple linear regression was employed to model causal effects. The results indicate that customers of the two types of banks perceive SERVQUAL drivers differently. The determinants of the overall satisfaction for the two types, are also different. Implications of the results and recommendations for further research are discussed.
Keywords:
SERVQUAL; Customer Satisfaction; Islamic Banking; GCC; Nonparametric Regression.
1.
Introduction
Similar to any business organization, commercial banks exist to maximize the value of their shareholders. To achieve their goals, they depend, mainly, on money lending and borrowing. Profit is the main driver for value maximization. Basically, banks realize profits from the positive difference between the interest they charge on the money they lend and the interest they pay on the money they borrow. As such, they strive to attract two types of customers: lenders and borrowers. Fundamentally, customers’ attraction is correlated with how much customers are satisfied with the service quality (SERVQUAL) they get from the bank.
SERVQUAL is based on the notion that the quality of service provided by a company should only be perceived and dealt with from a customer perspective. An immense research exists on SERVQUAL modeling and customer satisfaction. The state of knowledge today indicates that a perfect model does not exist. A viable customer-perceived model is rather dependent on the nature of the business and the culture it belongs to. There is numerous research that lends evidence and support to this conclusion. The latest literature reviews made by Sangeetha and Mahalingam (2011) and Al-Jazzazi and Sultan (2015) provide such evidence and explicitly identify a gap in the literature in relation to Islamic bank (IB) versus conventional bank (CB) SERVQUAL-customer satisfaction modeling. Indeed, understanding the unique characteristics of IB compared to CB should add to the current state of knowledge.
to two important questions that have not been explored before. The two questions are: If IB is different from CB, then (1) do they differ in the SERVQUAL-customer satisfaction relationship? And (2) if they do, then what is the proper model for each type?
We strive to answer these questions by reviewing the literature on service quality-customer relationship with the objective to extract the proper items comprising each dimension for each bank type along with hypotheses development. This is done in the next section of the paper which should help us model the relationship for each bank type in the methodology section. This is followed by a section dealing with the proper tests estimations and results discussions. We end the paper with a conclusion, implications and recommendations for further research.
2.
Literature Review
As mentioned earlier, the literature on the effect of service quality on customer satisfaction and ultimately on the value of the company is rich. This is a relationship that is widely accepted in the literature. In fact, a theory was developed recognizing the relationship of customer satisfaction, loyalty and eventually profitability. This is discussed in Heskett et al (1994 and 2008) and Storbacka et al (1994). Hallowell, R. (1996), Anderson and Mazvancheryl (2004) and Fornell (2006) provided additional support to this theory for retail banking.
The latest review on this subject, focusing on the banking industry, was done by Al-Jazzazi and Sultan (2015). A more detailed, focused and recovering discussion of the literature on service quality models for the banking industry can be found in Sangeetha and Mahalingam (2011). The term “service-quality” or SERVQUAL is used in research to capture the level of customer perceived satisfaction on the service quality provided by companies. In their “meta-analysis” approach of customer satisfaction in the banking sector, Ladeira et al (2016) have analyzed over 800 relationships identified by 210 research papers to come up with ten dimensions influencing customer satisfaction and concluding that the study has limited power to reject null hypotheses.
The first to recognize service quality as a function of the difference between customer perception and actual performance was Parasuraman et al (1985) opening the door for a new applied studies on the subject. The SERVQUAL acronym was introduced by Parasuraman et al (1988) when it was used as a multi-item Scale to measure the perception consumer customers’ satisfaction towards the service quality they are getting from companies. A 22-item scale was developed to assess customer perception of service quality in retail companies. Since then, researchers have picked up the new acronym to investigate the relationship between the perceived service quality and customer satisfaction. Parasuraman et al (1988) was cited by more than 26 thousand related research (see google scholar1) indicating the literature richness of this narrow subject.
Numerous applied research has strived to model the SERVQUAL-customer satisfaction relationship based on the proposed multiple-item scales. As of today, researchers have failed to develop a unified and generic model as the number of items representing service quality varied across business lines, cultures and economies. The same applies to the banking industry. In their review of service quality models in banking, Sangeetha and Mahalingam (2011) concluded that, although the different research has exhibited some similarities in recognizing the items comprising the various dimensions of SERVQUAL, a universal model cannot be extracted.
As for conventional banking, Levesque and McDougall (1996) investigated the determinants of customer satisfaction in retail banking and found that there are five service quality dimensions critical to customer satisfaction. These are getting it right the first time, competitive interest rates, service problems and recovery ability. Ndubisi and Wah (2005) identified different dimensions for Malaysian banks. They identified competence, communication, conflict handling, trust, and relationship quality as determinant dimensions for bank customer satisfaction. Jamal and Naser (2002) reported that core and relational dimensions of service quality are associated with customer satisfaction. Al‐Hawari and Ward (2006) investigated the effect of automated and IT service quality on the financial performance of Australian banks and found that customer satisfaction is closely related to the quality of automated services. Similar findings were reported by Ganguli (2011).
Monica (2010) developed a framework to model SERVQUAL for public and private banks in India. She found that SERVQUAL is a determinant of customer satisfaction. However determining dimensions were found to be different for the two types. Shanka (2012) investigated the relationship between SERVQUAL, customer satisfaction and loyalty in the Ethiopian banking sector and found a positive association and causal effect.
As for Islamic banks, many researchers have investigated the relationship between SERVQUAL and customer satisfaction. Amin and Isa (2008), for example, typically, used the dimension reduction factor analysis procedure to determine five SERVQUAL dimensions affecting the level of satisfaction in Malaysian Islamic banks.Jayaraman et al (2010) followed a similar approach for the same market but came up with different dimensions that have a significant impact on satisfaction.
The GCC market, a geographical region with similar economies, financial markets, cultures and a sizeable number of Islamic and conventional banks was targeted by many researchers. There was some applied research that targeted the same subject for individual countries of this region. These include Almossawi (2001) for Bahrain, Kassim and Abdulla (2006) for Qatar, Al-Wugayan et al (2008) and Al‐Eisa and Alhemoud (2009) for Kuwait.
An earlier attempt to compare between Islamic and conventional banks in the GCC region, in terms of bank selection motives, was made by Al‐Ajmi et al (2009) in Bahrain. This was followed by a study conducted by Sayani, H. and Miniaoui, H. (2013) to investigate the same for the United Arab Emirates. Again, using the same approach of factor analysis, different determinants were identified.
An attempt was made by Naser et al (2013) to investigate SERVQUAL-satisfaction in an Islamic bank in Kuwait. A more recent study was conducted by Lone et al (2017), comparing Islamic and conventional banks in terms of the of customer satisfaction without tackling the relationship of SERVQUAL-customer satisfaction. Using the more popular procedures of simple t-test and ANOVA, their main finding was that customers of both bank types are equally satisfied.
From the review of the relevant literature, we conclude that:
i) Most of the research used a survey-type method to collect data of individual items representing the service quality perceived by customers.
ii) The number of individual items of bank service quality identified by the literature varied for all the research reviewed.
iii) Most of the research used the factor analysis approach to regroup the individual items to a reduced number of constructs.
iv) Although there are some similarities in the new constructs, it was not possible to come up with a universal and more generic model of SERVQUAL-customer satisfaction.
v) We still do not understand the difference between Islamic banks and conventional banks in terms of REVQUAL-customer satisfaction. However, since Islamic banks and conventional banks differ fundamentally, we believe this relationship will also differ.
2.1 Why Banks in the GCC Region
Our choice for the GCC region to conduct this study is based on the following justifications:
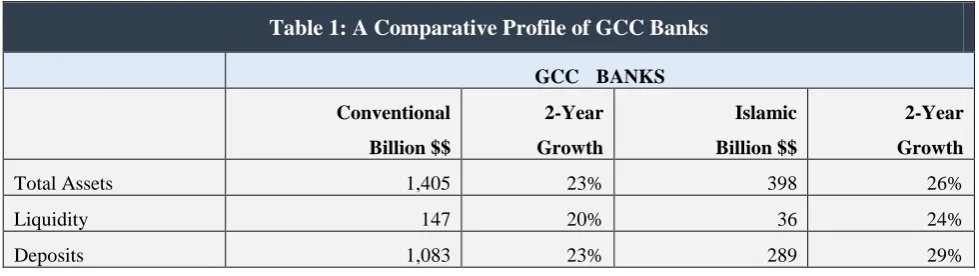
i) This is the only geographical region (six countries) hosting a respectable mix of conventional and Islamic banks. Based on the financial report on GCC banks of the Institute of Banking Studies in Kuwait (2015), there are 50 conventional banks with $1,405 billion in assets and 22 Islamic banks with $398 billion in assets operating in the region.
ii) Region countries share similar cultural, language, religion, market and economic environments.
iii) This is the region that initiated Islamic banking by launching Dubai Islamic Bank and Kuwait Financial Bank in the mid-seventies of the previous century.
iv) Fundamental financial data on both types are readily available from respectable research sources like the Institute of Banking Studies in Kuwait.
v) Many applied and comparative studies on conventional versus Islamic banking were conducted within individual countries of the region. The literature, however, lacks the same at the region aggregate level especially on the subject of SERVQUAL-customer satisfaction. To the best of our knowledge, this attempt is the first.
Table 1 highlights some major aggregate financial indicators for conventional and Islamic banks in the region as of the end of 2014.
Table 1: A Comparative Profile of GCC Banks
GCC BANKS
Conventional
Billion $$
2-Year
Growth
Islamic
Billion $$
2-Year
Growth
Total Assets 1,405 23% 398 26%
Liquidity 147 20% 36 24%
Lending* 859 24% 295 28%
Equity 187 18% 54 17%
Profit 25 32% 6 27%
Source: Institute of Banking Studies, Kuwait (2015)
* Classified as account receivables for Islamic banks
Financial numbers indicate the relative strength and presence of conventional banks compared to Islamic banks. This is understandable as Islamic banks are outnumbered by conventional banking which was established earlier in the region. However, the growth rates of all financial indicators show that Islamic banking is catching up.
3.
Methodology
Based on the concluding remarks made at the end of the literature review, the following research hypotheses can be developed:
i) The number of individual items representing SERVQUAL for all GCC banks, Islamic banks only and conventional banks only is different.
ii) The importance of SERVQUAL constructs for all GCC banks, Islamic banks and conventional banks is different. iii) SERVQUAL Constructs determining the level of customer satisfaction for all GCC banks, Islamic banks and
conventional banks are different.
Typical to most of the research on this topic, we use a 5-point Likert scale survey ranging from 1 for “strongly disagree” to 5 for “strongly agree” to collect bank client responses. In addition to the questions on service quality, the survey contains two demographical question on the type of bank the customer is dealing with and the country. Twelve detailed service quality questions were carefully designed. These items include:
i) Teller has a pleasant personality.
ii) Teller provides the service quality required.
iii) Teller delivers the service on time. iv) I get a quality ATM/ITM from the bank.
v) The bank provides a quality mobile banking service. vi) The bank provides a quality online banking service.
vii) The bank provides a quality credit card service. viii) The bank provides a quality debit card service.
ix) The bank provides quality lending services.
x) The bank provides quality account management services. xi) The bank provides quality reward programs.
xii) Overall, the bank provides quality banking services.
This list is a result of the literature discussion and debate efforts conducted with bankers, bank employees and customers on the services that are more noticeable to regular bank clients.
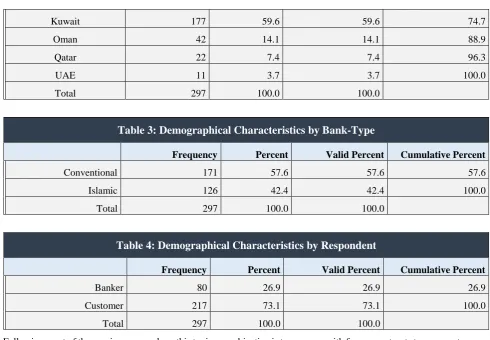
The survey was constructed using SurveyMonkey (https://www.surveymonkey.com/user/sign-in/) application which proved to be very handy in communicating the survey in the form of an online link to professional groups in the different countries of the region. We ended up with 297 complete responses from bank clients and bankers in all countries in the region for the both types. Here we present, in tables 2, 3 and 4, the demographical characteristics of the responses by countries, bank and respondent respectively. The term customer applies to bank clients and employees.
Table 2: Demographical Characteristics by Country
Frequency Percent Valid Percent Cumulative Percent
Bahrain 19 6.4 6.4 6.4
Kuwait 177 59.6 59.6 74.7
Oman 42 14.1 14.1 88.9
Qatar 22 7.4 7.4 96.3
UAE 11 3.7 3.7 100.0
Total 297 100.0 100.0
Table 3: Demographical Characteristics by Bank-Type
Frequency Percent Valid Percent Cumulative Percent
Conventional 171 57.6 57.6 57.6
Islamic 126 42.4 42.4 100.0
Total 297 100.0 100.0
Table 4: Demographical Characteristics by Respondent
Frequency Percent Valid Percent Cumulative Percent
Banker 80 26.9 26.9 26.9
Customer 217 73.1 73.1 100.0
Total 297 100.0 100.0
Following most of the previous research on this topic, our objective is to come up with fewer constructs to represent groups of items that are consistent with each other. The constructs will then be analyzed in terms of statistical significance using nonparametric ranking. Furthermore, the causal relationship will, ultimately, be investigated.
4.
Testing & Estimation
4.1 Testing
Testing the reliability of the individual items included in the questionnaire is the proper start with this type of nonparametric research. This is a test of harmony between individual items to form one factor (construct). We use Cronbach’s alpha consistency model for this purpose. If data is reliable then, we move ahead and perform a data reduction procedure with factor analysis using varimax rotation method. Reliability tests were also applied to the individual items within each group. A summary of these tests is presented in Table 5 below.
Table 5: Summary Results of Reliability Tests and Factor Analysis – All Banks
Constructs
Individual
Items
Reliability
Coefficient Variance Explained Factor Loadings
Operations 77.2% 53.10%
Credit Cards 0.658
Debit Cards 0.663
Loans 0.735
Accounts 0.689
Rewards 0.752
Teller 78.9% 70.89%
Personality 0.799
Speed 0.788
IT 72.8% 64.97%
ATM/ITM 0.769
Mobile Banking 0.770
Online Banking 0.802
Overall 83.5%
Based on all the responses, table 5 indicates that, overall, the items included in the survey are reliable at a high 83.5% level. The table also shows that the factor analysis procedure has produced three groups. Each group has different individual items but consistent among each other. Based on nature of the individual items of the groups, we named them: operations, teller and IT. The reliability of the individual items within each group is also respectably high. Their reliability figures are 77.2% for operations, 78.9% for teller and 72.8% for IT. The table also shows two important results in the last two columns. The first is the variance explained for each group by its own individual items and the second is the loadings of each individual item which will be handy in constructing the new variables (constructs). The variability explained figures for all the groups are respectably over 50% which indicates the importance and belonging of the individual items to the new groups.
We now perform some data transformation to create the new constructs. We apply the transformation equation used by Aldeehani and Bouresli (2017) to create new variables. The equation is of the form
̂ ∑
∑ , ………..………..…. (1)
Where, ̂ is the predicted value of item k observation i, is the loading of item i, which represent the item weight and is the original response i of item k. An example of calculating the denominator for “operations” construct using the group loadings is as follows:
∑
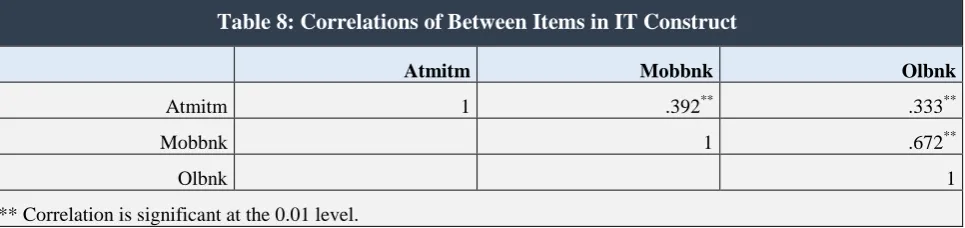
The divisors for “teller” and “IT” constructs were calculated in the same manner resulting 2.413 and 2.271 respectively. By applying equation 1, we now have three new constructs given the names of the groups: operations, teller and IT respectively. Correlations between the individual items within each construct are presented in table 6, 7 and 8.
Table 6: Correlations of Between Items in Operations Construct
Crcard Dbcard Loans Accnts Rewards
Crcard 1 .563** .335** .364** .421**
Dbcard 1 .407** .461** .288**
Loans 1 .536** .344**
Accnts 1 .396**
Rewards 1
**. Correlation is significant at the 0.01 level.
Table 7: Correlations Of Between Items in Teller Construct
Prsnlty Srvce Ontime
Prsnlty 1 .556** .569**
Srvce 1 .564**
Ontime 1
The significant figures of correlations between the individual items of the each group indicate the proper groupings of these items. The correlations between the newly created constructs are also high as presented in table 9.
Table 9: Correlations Between the New Constructs
Operations
Teller
IT
Operations
1
.494
**.509
**Teller
1
.336
**It
1
** Correlation is significant at the 0.01 level.
We now perform the nonparametric, Kruskal-Wallis procedure to test the significance of ranking between the three constructs by bank type and by country. The results of this ranking test by bank type are presented in table 10 below.
Table 10: Kruskal-Wallis Ranking Test by Bank Type
Bank Type N
Mean
Rank
Operations Conventional 170 135.81
Islamic 124 163.52
Total 294
Rank test χ2=7.62, df=1, Sig.=.006
Teller Conventional 169 140.75
Islamic 125 156.63
Total 294
Rank test χ2=2.65, df=1, Sig.=.104
IT Conventional 171 128.10
Islamic 125 176.41
Total 296
Rank test χ2=23.38, df=1, Sig.=.000
Ranking of operations construct by bank type appears to be significant as indicates by the figure of the chai squared which is 23.38 and significant at the 1% level. Ranking of the teller construct is not significant as indicated by its chai squared score. The ranking of the IT construct is significant at the 1% level again. These results mean that banks’ clients in the GCC region perceive the service quality of operations provided to them from Islamic banks to be better than that provided by conventional banks as indicated by the rank score of 163.52 compared to 135.81 for conventional banks. The same conclusion can be drawn with respect to their perception of IT service quality provided. The ranking test indicates a perceived better service provided by Islamic banks with a ranking score of 176.41 compared to 128.10 for conventional banks. The test for teller services does not indicate any significant ranking between the two types of banks which means
Table 8: Correlations of Between Items in IT Construct
Atmitm Mobbnk Olbnk
Atmitm 1 .392** .333**
Mobbnk 1 .672**
Olbnk 1
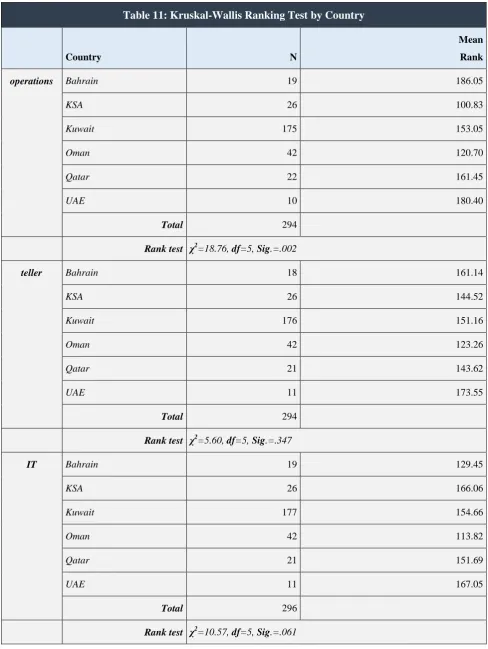
that bank clients perceive that teller services of the two types of banks are, statistically, not different. This is evident as the ranking scores were close for both types. Table 11 exhibits the resulting ranking test for the same constructs by countries.
Table 11: Kruskal-Wallis Ranking Test by Country
Country N
Mean
Rank
operations Bahrain 19 186.05
KSA 26 100.83
Kuwait 175 153.05
Oman 42 120.70
Qatar 22 161.45
UAE 10 180.40
Total 294
Rank test χ2=18.76, df=5, Sig.=.002
teller Bahrain 18 161.14
KSA 26 144.52
Kuwait 176 151.16
Oman 42 123.26
Qatar 21 143.62
UAE 11 173.55
Total 294
Rank test χ2=5.60, df=5, Sig.=.347
IT Bahrain 19 129.45
KSA 26 166.06
Kuwait 177 154.66
Oman 42 113.82
Qatar 21 151.69
UAE 11 167.05
Total 296
According to these results, bank customers perceive that Bahraini banks provide the best operations service quality in the GCC region followed by UAE banks, Qatari banks, Kuwaiti banks, Omani banks and lastly; Saudi banks. This conclusion is based on the χ2
statistic of 18.76 which is significant at the 1% level and the Kruskal-Wallis ranking scores. On the other hand, customers perceive no significant ranking differences in terms of the service quality provided to them from tellers. As of IT service quality, customer perception is insignificant at the 5% level but significant at the 10% level putting UAE banks at the top followed by Saudi banks, Kuwaiti banks, Qatari banks, Bahraini banks and lastly; Omani banks.
4.2 Causal Model
To investigate causality, we employ a nonparametric local linear regression model as reported by Shao (2003). The model is given by
( ) ……….. (2)
( | ) ………..……… (3)
Where is the dependent variable (overall) representing the overall customer satisfaction responses, ( ) is an unknown mean function of the covariates (operations, teller and IT), is an error term, Equations (2) and (3) imply that
( | ) ( ) ………..……….. (4)
A local linear model regression model, as reported by Fan and Gijbels (1996), solves the minimization problem for each x variable in the form of
∑ * ( )+ ( )……….. (5)
Where ( ).
The formation of results of the optimization equation (5) is similar to that of the ordinary least square method except for the interpretation of the constant and the slope. is the constant which is a conditional mean at x point. , on the other hand, is the slop parameter which is the derivative of the mean function in terms of x. In table 12, we present the results of estimating the nonparametric regression.
Table 12: Nonparametric Regression*- All Banks
Observed
Estimate
Bootstrap
Std. Err. z P>|z| [95% Conf. Interval]
Mean:
overall 3.885564 .0546362 71.12 0.000 3.836 4.031
Effect:
operations .5118695 .079226 6.46 0.000 .351 .635
teller .3537961 .0715816 4.94 0.000 .231 .477
IT .1387596 .0593881 2.34 0.019 .028 .228
* R2 = 0.6857, N=283
The output of the nonparametric regression estimation presented in table 12 includes various important results. First, we notice the R2 score of 0.6857 which means that the three covariates: operations, teller and IT do explain 68.57% of the variation in the dependent variable: overall. The significantly observed estimate of the conditional mean is 3.89 can also be noticed. The significance of z-tests indicated by the p-values for all independent variables provides a strong evidence of the causal relationship. The resulting positive coefficients of the perceived service quality of operations, teller and IT provided by the banks do explain the variation of the overall customer satisfaction.
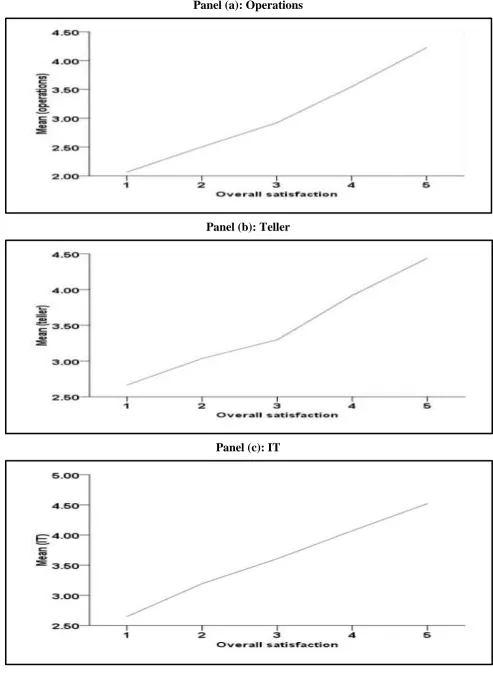
Figure 1: All Banks: SERVQUAL-Satisfaction Relation
Panel (a): Operations
Panel (b): Teller
Panels (a), (b) and (c) of figure 1 indicate a positive and smooth relationship between customer satisfaction and the three SERVQUAL explanatory variable. The smooth slope in the relationship is an obvious sign of the significant effect. According to this analysis, we, now, know what affects customer satisfaction in bank services quality within the GCC region based on the perceptions of the customers. What makes this study more interesting is to investigate the factors that affect satisfaction in each bank type. This kind of investigation required splitting the survey data between the two bank types and factoring the individual items of service quality to create totally new construct for each bank type. Following the same procedures we did earlier, we come up with summary results of reliability tests and factor analysis for conventional banks as illustrated in table 13.
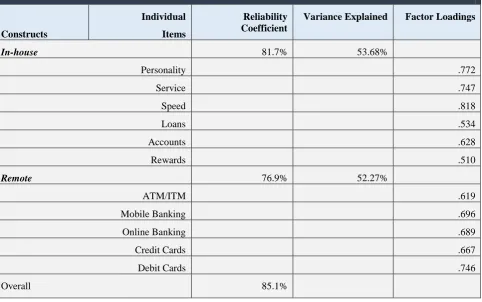
Table 13: Summary Results of Reliability Tests and Factor Analysis – Conventional Banks
Constructs
Individual
Items
Reliability Coefficient
Variance Explained Factor Loadings
In-house 81.7% 53.68%
Personality .772
Service .747
Speed .818
Loans .534
Accounts .628
Rewards .510
Remote 76.9% 52.27%
ATM/ITM .619
Mobile Banking .696
Online Banking .689
Credit Cards .667
Debit Cards .746
Overall 85.1%
The results of the factor analysis procedure for conventional banks in table 13 exhibits the identification of two new groups for the individual items. The first group comprises of 6 individual service quality items. These items are personality, service, speed, loans, accounts and rewards. The second group comprises of 5 individual service quality items. These are ATM/ITM, mobile banking, online banking, credit cards and debit cards. Based on the nature of this grouping, we assign the new construct name: “In-house” for the first group as all the services are typically provided within the premises of the bank. We also assign a new construct name: “Remote” for the second group as all the services are provided outside the bank buildings.
An overall score of 85.1% indicates that the survey response enjoys high reliability. The reliability tests for the individual items of the new constructs are also high. The loadings of each group seem appropriate as all are above 0.50. These loadings are used for data transformation to create the new explanatory variables which will also be named “In-house” and “Remote” representing the two groups.
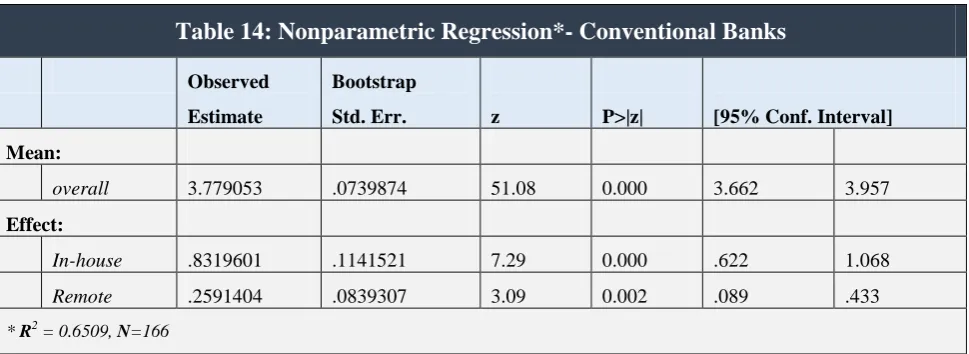
Table 14: Nonparametric Regression*- Conventional Banks
Observed
Estimate
Bootstrap
Std. Err. z P>|z| [95% Conf. Interval]
Mean:
overall 3.779053 .0739874 51.08 0.000 3.662 3.957
Effect:
In-house .8319601 .1141521 7.29 0.000 .622 1.068
Remote .2591404 .0839307 3.09 0.002 .089 .433
* R2 = 0.6509, N=166
Table 14 indicates that there is a positive and statistically significant effect of In-house and Remote variables on the overall satisfaction. An R2 of 0.6509 shows that 65% of the variation in overall satisfaction is explained by these two explanatory variables.
The relationship between the overall satisfaction (dependent) and the new independent construct: In-house and remote for conventional banks in the GCC region are depicted in figure 2.
Figure2: Conventional Banks: SERVQUAL-Satisfaction Relation
Panel (A): In-House
Again, the panels (a) and (b) of figure 2 indicate a positive and smooth relationship between customer satisfaction and the new SERVQUAL explanatory variable. The smooth slope in the relationship is an obvious sign of the significant effect. Repeating the analysis procedures for Islamic bank, we get the results of the reliability tests and factor analysis in table 15 and the results of the nonparametric regression in table 16.
Table 15: Summary Results of Reliability Tests and Factor Analysis – Islamic Banks
Constructs
Individual
Items
Reliability Coefficient
Variance Explained Factor Loadings
IT 76.4% 68.04%
ATM/ITM .684
Mobile Banking .874
Online Banking .855
Teller 80.0% 72.18%
Personality .868
Service .865
Speed .767
Operations 72.5% 48.53%
Credit Cards .604
Debit Cards 577
Loans .756
Accounts .726
Rewards .599
Overall 77.5%
From table 15, we observe that factor analysis suggested three groups. Based on the nature of the individual items of each group, we assigned three names: “IT”, “Teller” and “operations” for groups one, two and three respectively. Again, reliability and variability explained statistics appeared strong. As before, the loadings for each individual service quality item are used to create the new constructs “IT”, “Teller” and “operations” which will be used as explanatory variables. The results of regressing “overall” on “IT”, “Teller” and “operations” are depicted in table 15 below.
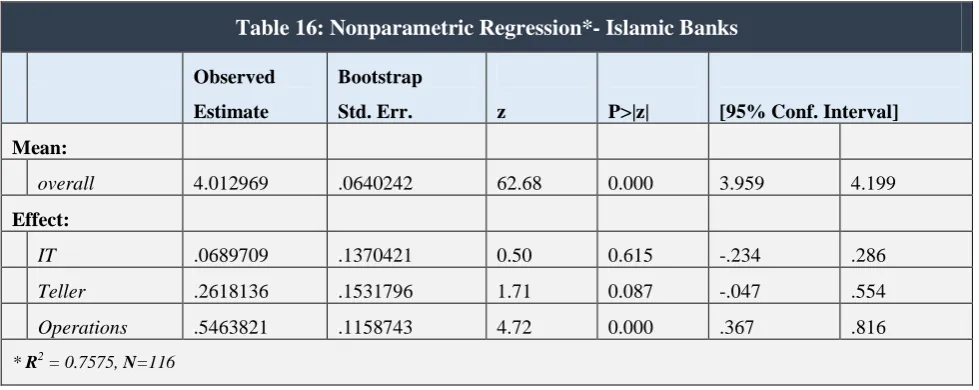
Table 16: Nonparametric Regression*- Islamic Banks
Observed
Estimate
Bootstrap
Std. Err. z P>|z| [95% Conf. Interval]
Mean:
overall 4.012969 .0640242 62.68 0.000 3.959 4.199
Effect:
IT .0689709 .1370421 0.50 0.615 -.234 .286
Teller .2618136 .1531796 1.71 0.087 -.047 .554
Operations .5463821 .1158743 4.72 0.000 .367 .816
* R2 = 0.7575, N=116
The relationship between the overall satisfaction (dependent) and the new independent construct: IT, Teller and operations for Islamic banks in the GCC region are depicted in figure 2.
Figure3: Conventional Banks: SERVQUAL-Satisfaction Relation
Panel (a):
IT
Panel (b):
Teller
Panel (c):
Operations
The results of estimating the nonparametric model for Islamic banks tell a different story. The insignificant effect of the first two constructs (IT and Teller) are clearly irregular and bumpy. Panels (a) and (b) depicts this relationship. Panel (c) however reflects the only smooth relationship between the overall satisfaction and operations construct.
4.3 Summary of the research results
i) Aggregate factor analysis separated the customer-perceived individual banks’ service quality into three constructs (groups): operations, teller and IT. The perception of the bank clients in the GCC region is that Islamic banks provide better quality in operations, teller and IT services. Bahrain turned out to be on top of operations’ service quality and UAE is on top of teller and IT service quality.
ii) When separating banks according to their types, the groupings turned out to be the same, in terms of the number and the contents of the constructs for Islamic banks and different, in terms of the number of groups and the contents of each construct, for conventional banks. The new constructs for conventional banks are in-house services and remote services.
iii) Our nonparametric regression procedure provided support for a causal relationship between the overall satisfaction and the proposed explanatory variables. It was found that the overall customer satisfaction for all the banks is significantly determined by the perceived quality of the services provided in terms of operations, teller and IT.
iv) Out of the three proposed explanatory variables, only operations variable was found to significantly affect overall satisfaction for Islamic banks as perceived by their clients.
v) The new constructs of in-house and remote were found to be significant determinants of overall satisfaction for conventional banks.
5. Conclusion
The aim of this study is to provide a new contribution to the literature, which is already rich, on the relationship of service quality-customer satisfaction. The significance of our contribution is that it investigates the subject in terms of conventional banking versus Islamic banking in a region lacking such a research.
The focus of our research is on the banking industry of the GCC region because of obvious justifications. We were able to solicit responses from clients of 72 banks on specific questions with regard to the services that are more noticeable to regular bank clients. Using a typical factoring procedure, our results identified three groups of SERVQUAL: operations, teller and IT services perceived by banks’ customers for all the banks in the region. Bank clients of Bahrain exhibited the highest customer satisfaction in operations. Bank clients of UAE exhibited the highest satisfaction in teller and IT services. The three groups of services proved to be significant determinants of overall bank customer satisfaction. When conventional banks were separated from Islamic banks, the grouping of conventional banks differed in number and nature from that of all banks. The new two groups; In-house and remote services were also found to be significant determinants of overall customer satisfaction. For Islamic banks, the number and nature of the groups remained the same as for all the banks. However, only the group of operations services was found to explain variation in the customer satisfaction.
Our findings confirm the argument that the determinants of customer satisfaction can be different within the same industry. We claim that we are the first to differentiate between conventional and Islamic banking in terms of this subject but the conclusion remains the same: There is no universal model of the relationship between SERVQUAL and customer satisfaction.
As value is associated with client satisfaction, a practical implication of the findings of this paper is that bank managers should pay more attention to the details of the factors proved to predict the level of customer satisfaction. Our results suggest that managers of conventional banks should take a closer look on how in-house and remote services should be delivered to clients to affect their perception of the quality of service they are getting. For Islamic banks managers, the critical variable is how the core operation should be delivered to clients.
References
[1] Al‐Ajmi, J., Abo Hussain, H. and Al‐Saleh, N. (2009), "Clients of conventional and Islamic banks in Bahrain: How they choose which bank to patronize", International Journal of Social Economics, Vol. 36 No 11, pp. 1086-1112.
[2] Aldeehani, T. and Bouresli, A. (2017), “Stakeholders’ perceptions and predictions of stock exchange demutualization: the case of Kuwait stock exchange”, International Journal of Economics and Financial Issues, Vol. 7 No. pp. 3, 1-9.
[3] Al‐Eisa, A. and Alhemoud, A. (2009), "Using a multiple‐attribute approach for measuring customer satisfaction with retail banking services in Kuwait", International Journal of Bank Marketing, Vol. 27 No. 4, pp. 294-314. [4] Al‐Hawari, M. and Ward, T. (2006), "The effect of automated service quality on Australian banks' financial
performance and the mediating role of customer satisfaction", Marketing Intelligence & Planning, Vol. 24 No 2, pp. 127-147.
[5] Al-Jazzazi, A. and Sultan, P. (2015), “Banking Service Quality in the Middle Eastern and GCC Countries: Understanding the Future Research Directions”, Asian Journal of Business Research, Speical issue, 2015, 37-49. [6] Al-Wugayan, A., Pleshko, L. and Baqer, S. (2008), “An investigation of the relationships among consumer satisfaction, loyalty, and market share in Kuwaiti loan services”, Journal of Financial Services Marketing, Vol. 13 No. 2, pp. 95–106.
[7] Almossawi, M. (2001) "Bank selection criteria employed by college students in Bahrain: an empirical analysis", International Journal of Bank Marketing, Vol. 19 No. 3, pp. 115-125.
[8] Amin, M. and Isa, Z. (2008) "An examination of the relationship between service quality perception and customer satisfaction: A SEM approach towards Malaysian Islamic banking", International Journal of Islamic and Middle Eastern Finance and Management”, Vol. 1 No. 3, pp. 191-209.
[9] Anderson E., Fornell, C. and Mazvancheryl, S. (2004), “Customer Satisfaction and Shareholder Value”, Journal of Marketing, Vol. 68 No. 4, pp. 172-185.
[10] Fornell, C., Mithas, S., Morgeson III, F. and Krishnan, M. (2006), “Customer Satisfaction and Stock Prices High Returns, Low Risk. Journal of Marketing”, Vol. 70 No. 1, pp. 3-14.
[11] Fan, J. and Gijbels, I. (1996), “Local Polynomial Modelling and its Applications”, London: Chapman & Hall. [12] Ganguli, Sh. and Roy, S. K. (2011), "Generic technology‐based service quality dimensions in banking: Impact on
customer satisfaction and loyalty", International Journal of Bank Marketing, Vol. 29 No. 2, pp. 168-189. [13] Hallowell, R. (1996), “The relationships of customer satisfaction, customer loyalty, and profitability: an
empirical study”, International Journal of Service Industry Management, Vol. 7 No. 4, pp. 27-42.
to Work”, Harvard Business Review, March-April, pp. 164-174.
[15] Heskett, J., Jones, T., Loveman, G., Sasser JR, W and Schlesinger, L. (2008), “Putting the Service-Profit Chain to Work”, Harvard Business Review, July–August 2008, pp. 118-129.
[16] Jamal, A. and Naser, N. (2002) "Customer satisfaction and retail banking: an assessment of some of the key antecedents of customer satisfaction in retail banking", International Journal of Bank Marketing, Vol. 20 No. 4, pp. 146-160.
[17] Jayaraman, M., Shankar, Ch. And Wai, M. (2010), “Service Quality Delivery and Its Impact on Customer Satisfaction in the Banking Sector in Malaysia”, International Journal of Innovation, Management and Technology, Vol. 1 No. 4, pp. 398-404.
[18] Kassim, N., and Abdulla, A. (2006), "The influence of attraction on internet banking: an extension to the trust‐ relationship commitment model", International Journal of Bank Marketing, Vol. 24 No. 6, pp.424-442.
[19] Ladeira, W. and Santini, F., Sampaio, C., Perin, M. and Araújo, C. (2016), "A meta-analysis of satisfaction in the banking sector", International Journal of Bank Marketing, Vol. 34 No. 6, pp. 798-820, https://doi.org/10.1108/IJBM-10-2015-0166
[20] Levesque, T, and McDougall G. (1996), “Determinants of customer satisfaction in retail banking”, International Journal of Bank Marketing, Vol. 14No. 7, pp. 12-20.
[21] Lone, F., Aldawood, E. and Bhat, U., (2017), “Comparative Analysis of Customer Satisfaction Towards Islamic and Conventional Banking: An Empirical Study from Saudi Arabia”, International Review of Management and Marketing, Vol. 7 No. 1, pp. 273-280
[22] Naser, K., Athmar Al Salem, A. and Nuseibeh, R. (2013), “Customers Awareness and Satisfaction of Islamic Banking Products and Services: Evidence from the Kuwait Finance House (Note 1)”, International Journal of Marketing Studies, Vol. 5 No. 6, pp. 185-199.
[23] Ndubisi, N. and Wah, C. K. (2005), "Factorial and discriminant analyses of the underpinnings of relationship marketing and customer satisfaction", International Journal of Bank Marketing, Vol. 23 No. 7, pp. 542-557. [24] Monica, M. (2010), “An integrated framework for service quality, customer satisfaction and behavioral
responses in Indian Banking Industry - A comparison of public and private sector banks”, Journal of Services Research, Vol. 10 No. 1, pp. 157-172.
[25] Parasuraman, A, Ziethaml, V. and Berry, L.L. “(1985), A conceptual model of service quality and its implications for future research”, Journal of Marketing, Vol. 49 No. 3, pp. 41-50.
[26] Parasuraman, A, Ziethaml, V. and Berry, L.L. (1988), “SERVQUAL: A Multiple- Item Scale for Measuring Consumer Perceptions of Service Quality”, Journal of Retailing, Vol. 62 No. 1, pp. 12-40.
[27] Sangeetha, J. and Mahalingam, S. (2011), “Service quality models in banking: a review, International”, Journal of Islamic and Middle Eastern Finance and Management, Vol. 4 No. 1, pp. 83-103.
[28] Sayani, H. and Miniaoui, H. (2013), "Determinants of bank selection in the United Arab Emirates", International Journal of Bank Marketing, Vol. 31 No. 3, pp. 206-228.
[29] Shao, J. (2003) Mathematical Statistics, 2nd ed. New York: Springer.
[30] Shanka, M. S. (2012), “Bank Service Quality, Customer Satisfaction and Loyalty in Ethiopian Banking Sector”, Journal of Business Administration and Management Sciences Research, Vol. 1 No. 1, pp. 001-009.