Thesis by
David G. Agresti ,
In Partial Fulfillment of the Requirements For the Degree of
Doctor of Philosophy
California Institute of Technology Pasadena, California
1967
ii
ACKNOWLEDGMENTS
Many people have contributed to the progress of this work. In particular, the author would like to thank:
Dr. Egbert Kankeleit, who originally conceived and designed the experiments and provided needed guidance throughout all phases of the research.
Dr. BtJrje Persson, whose close collaboration made the completion of these studies possible.
Dr. Felix Boehm for his interest and support of these studies.
Dr. Rudolf Mtlssbauer for many helpful discussions on the solid- state aspects of the problem.
Dr. Edwin Seltzer for many illuminating discussions on nuclear theory and calculations of relevant nuclear parameters.
Mr. H. E. Henrikson for his help with the design of the experiment.
Dr. P. Duwez for his advice on metallurgical problems. Dr. R. Willens for suggestions related to the levitation-melting technique.
Mr. Vagn Stephenson and Mr. Ellsworth ''Woody" Kiersey for their help in making parts of the apparatus.
Mr. Granville "Glenn" Swanson for help with electronics. Finally, Miss Jerre Levy Basch, with whom the author has had many pleasant discussions on the final wording of this thesis.
The author gratefully acknowledges financial aid from the California Institute of Technology, the U. S. Atomic Energy
ABSTRACT
The MtJssbauer technique has been used to study the nuclear hyperfine interactions and. lifetimes in
w
182 (2+ state) andw
183 (3/2- and 5/2- states) with the following results:g(5/2-)/g(2+) = 1.40 ± 0.04; g(3/2-) = -0.07 ± 0.07; Q(5/2-)/Q(2+) = 0.94 + 0.04; T
112(3/2-) = 0.184± 0.005 nsec; T112(5/2-) ;:_ 0.7 nsec. These quantities are discussed in terms of a rotation-particle inter- ·
t . ·
w
183 d t C . l" l" F th d ac 10n m ue o orio is coup mg. rom e measurequantities and additional information on y-ray transition intensities magnetic single-particle matrix elements are derived. It is inferred from these that the two effective g-factors, resulting from the
Nilsson-model calculation of the single-particle matrix elements for the spin operators
sz
and'S'
+' are not equal, consistent with a proposal of Bochnacki and Ogaza.The internal magnetic fields at the tungsten nudeus were determined for substitutional solid solutions of tungsten in iron,
cobalt, and nickel. With g(2+) = 0.24 the results are:
IHeff(W-Fe)I= 715 ± 10 kG; lHeff(W-Co)j = 360 ± 10 kG; IHefiW-Ni)l = 90 ± 25 kG. The electric field gradients at the tungsten nucleus were determined for
ws
2 and WO~~· With Q(2+)=
-1.81 b the results are:forUr. 2 18 2
WS
2, eq = -(1.86 + 0.05) 10 V /cm ; for W03, eq = (1.54 ± 0.04)10 V/cm and ri = 0.63 ± 0.02.
have been detected in a number of compounds and alloys and have
been interpreted to imply that the mean square radius of the Ft195
nucleus in the first- excited state is smaller than in the ground
From Jerre:
David does physics from morning till night--From 8 in the evening till dawn's early light. Energy spectra confuse and
perplex--No time for love and no time for sex. Tungsten 182 and 183
Interest him more than music or me. Magnetic dipoles, hyperfine interaction Act upon Dave like magnetic attraction. Typical people make love in the spring. Typical robins and sparrows will sing. Typical daisies and roses will bloom,
But if you know David, you shouldn't assume That he is aware that it's spring and it's May.
His thesis is due and he works night and day. However, I'm sure when he's post-PhD,
TABLE OF CONTENTS
PART TITLE PAGE
I. INTRODUCTION 1
2 6 6 7 7 9 II.
m.
1) Origin of the Spectra
2) Interpretation of ~he Spectra a) Line broadening
b) Centroid shift
c) Magnetic hyperfine interaction d) Electric quadrupole interaction EXPERTh1ENT
1) Sources and Detectors 2) Absorbers
3) Drive and Data Storage 4) Special Equipment RESULTS
1) Magnetic Hyperfine Interaction
a) (2+ -
o+)
100-keV transition in w182 b) (5/2- - 1/2-) 99-keV transition inw
183c) (3/2- - 1/ 2-) 99-keV transition in Pt195
16
18 21 24 24 33 36 37 38 392) Isomeric Shift 40
a)
w182 and w
183 40b) pt195, 99-keV 41
3) Electric Quadrupole Interaction 41 a) (2+ - o+) 100-keV transition in
w
182 42 b) (5/2- - 1/2-) 99-keV transition inw
183 43PART
N.
TITLE PAGE
4) Line Widths 44
a)
w
182, 100-keV 44b)
w
183, 99-keV 44c) Pl195, 99-keV 45
5) Special Case: 47-keV Transition in w183 45 DISCUSSION
1) Magnetic Fields
2) Nuclear Parameters for the 5/2- and 3/2-States in
w
1833) Magnetic Moment of the 3/2- State in pt195
77 78
81 85
FIGURE
I. 1
I. 2
II. 1
II. 2 II. 3
m.1
m.2
m.3
m.4
m.5
III. 6m.7
ID.8m.9
m.10 IV.1 IV. 2LIST OF FIGURES
Level Schemes for
w
182,w
183, and Pt195 Dipole and Quadrupole Radiation PatternsScintillation Spectra of Ta182, Ta 183, .and Au195 Source Holder
Cryostat and Drive System
Velocity Spectra for Ta182 vs. W-Fe
Spectra for Ta 182 vs. W-Co W-Ni and W
'
'
Spectra for Ta183 vs. W-Fe 195
Spectra for Au vs. Ft-Fe 195
Spectra for Au vs. Pt-Co, Pt-Ni, and pt Isomeric Shifts in pt
182
Spectra for Ta vs. WS
2 and WO 3 182
Spectra for Ta vs. Commercial WS2 183
Spectra for Ta vs. WS
2 and W03
Width-thickness Plot for 47-keV Transition of
w
183 Internal Fields versus Host Magnetic MomentComparison of Electric Quadrupole Parameters . for
w
183LIST OF TABLES
TABLE PAGE
m.1 Parameters for Magnetic Hyperfine Interaction 67
m.2 Results for Magnetic Hyperfine Interaction in W 69
m.3 Results for Magnetic Hyperfine Interaction in Pt 71
ill.4 Parameters for Electric Quadrupole Interaction 73
m.5 Results for Electric Quadrupole Interaction in W 75
IV.1 Magnetic Parameters for
w
183 91IV. 2 Effective g-factors for W . 183 , Yb 171 , and Tm 169 93
L
INTRODUCTIONThis thesis describes experiments performed over the past
year and a half in which fundamental use has been made of a
dis-covery made in 1957 by R. L. Mtlssbauer. l) Jn essence Mtlssbauer' s
discovery demonstrated for the first time that certain y-rays emitted from radioactive nuclei in solid matter have an
energy resolution very nearly equal to that corresponding by the
un-certainty principle to the lifetime of the nuclear state from which the
y-rays were emitted. This discovery meant an enormous
improve-ment in the sharpness of such y-rays, and several new avenues of
research were opened up.
The experiments described in this thesis2) utilized these
very narrow y-rays in order to investigate nuclear hyperfine
inter-actions in a number of materials. Structure in the energy spectrum
of these Y- rays, slight broadening, and small energy shifts, all
previously obscured because of the poor resolution, could now be
readily observed, and valuable information was gained about the
nucleus and its interaction with its environment.
1) Origin of the Spectra
Previous to Mtlssbauer's work, the emission of y-rays
from nuclei was considered to be a process that could be understood without reference to the properties of the solid in which the nucleus
was imbedded. That is, the energy spectrum of the y-rays was
supposed to depend only on the temperature of the material from which they were emitted but not on the fact that the emitting nuclei
amount, E 2 /2Mc2, where E is the energy of the y-ray and M is
0 0
the mass of the recoiling nucleus. The energy spectrum emitted ·
from a collection
ot
nuclei at temperature, T, is centered on thisvalue, and has a Gaussian shape with width, 20' = 2E JkT/Mc2 • 0
If the nuclei are in a solid, the above conclusion holds only
if the recoiling nucleus has sufficient energy to be dislodged from
its lattice site. If not, lattice vibrations will be induced, and the
shape of the emission spectrum will depend on the shape of the
phonon spectrum of the host solid. If the free-atom recoil energy
is less than the mean phonon energy, the possibility arises that a
certain significant fraction, the recoil-free fraction f, of y-ray emissions will not excite any phonon at all and will thus carry the
full energy difference between the two nuclear levels involved in the
transition. If both of these levels are degenerate, and the width of
the energy spectrum is due to the finite lifetime, 'I", of the upper
state, then the emission spectrum will be given by the Breit-Wigner
formula (Lorentzian line shape),
p(e) o: 1 (I. 1)
4 2 '
[ 1 + - 2 (e - E ) ]
r
owhere
r
= 1r / -r =o.693" /T
112 , (I. 2)
and E
0 is the transition energy. If one or both of the levels is shifted or is split into a number of sublevels by interaction of the
nucleus with its surroundings, the emission spectrum will take the
form of a sum over Lorentzian line shapes, with the relative
contri-bution of each Lorentzian depending on the relative emission
proba-bilities for the different energies of the y-rays connecting the
p'(e)
cx:
.
l
jh(j)
[l +
_!__
2 (e - E(j) ) 2
] r(j)
• (I. 3)
The parameters, E, h, and
r,
appearing in Formula I. 3 containvaluable information about the nucleus and its environment, and the
great value and interest in the Mtlssbauer effect arises because
these quantities can be obtained from experiment. The energy
spectrum for absorption of y-rays by nuclei in a solid without
energy transfer to the lattice has exactly the same form as the
emission spectrum, Equation L 1 or L 3, as appropriate.
The thing that makes the Mtlssbauer effect so beautiful and
so useful is that the emission (or absorption) spectrum may be
modulated in energy by the experimenter as he desires. He does
this by moving the source of y-rays in a controlled and
pre-determined fashion; for example, if the source is moved in the
direction of emission of y-rays with velocity, v, then the emission
spectrum is shifted toward higher energies by an amount, vEJc.
He then records the number of y-rays that pass thru the absorber
for various velocities of the source both toward (v > 0) and receding from (v < 0) the absorber. The counting rate will fall when there is large absorption (v ~ 0) and rise when there is no absorption
(v >>
er
/E0). In particular, if the absorption spectrum, Pa (e), is given by Equation L 3 and the emission spectrum, ps(e), by Equation
I. 1, then the experimental, or transmission, spectrum will be vE
P(v) =
J
de • p (e + ~ ) p' (e)s
c
a
(E (j) - E ) ] 2 •
a o
By analyzing his data in an appropriate manner, the experimenter
will be able to obtain all the
r
a (j) and the Ea (j) to within an additive constant and all the h(j). Of course, the resolution will be too badto obtain these quantities with any precision unless
r
+r
<s a"'
JE (i) - E (j)I for all i and
a
a
j. However, the resolution can be much worse than this and one can still obtain accurate values for the peakpositions provided a way can be found to relate the various E (j), a such as assuming magnetic dipole or electric quadrupole hyperfine
interaction.
There are two important restrictions on the transition that
may be studied by this method, and these limit the number to
extremely few cases, considering the total number of nuclear
transitions. First, since an absorber is involved, the lower level
must be reasonably long lived. In practice this means the ground
state of a stable nuclide. Also, the absolute maximum change in
counting rate is the recoil-free fraction of the source f s' so that f
must be at least a percent or two for an effect to be observable.
Tllis limits the transitions to energies of around 150 keV or less.
The cross section, cr
0, for absorption by the resonant isotope of y-rays having the proper energy is
21 . + 1
1 ex E 2 2Igd + 1
0
1 1 + a.
1
(I. 5)
1 +
~ •In this formula, I ex and I g d are the excited- and ground-state spins,
resp. , a. is the total electron conversion coefficient, and ~ includes all other processes available for de-excitation of the excited level,
such as cascade via an intermediate level. For the absorber the
1
t
mN
=
f 0a cro
A
a.
(I. 6)Here, A is the molecular weight of each molecule of the absorber, a is the fraction, by weight, of resonant isotopes, and N
0 is Avogadro's number.
2) Interpretation of the Spectra
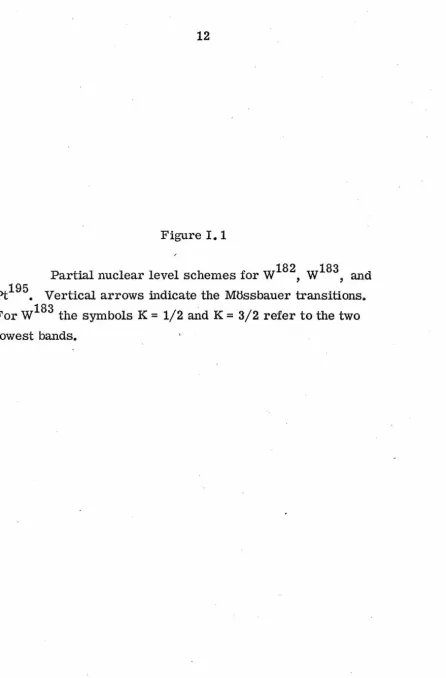
For the experiments reported on in this thesis we have
chosen 5 transitions in 3 nuclei; the nuclear level schemes are
shown in Figure I. 1. In order to obtain information about the nucleus
and its environment, we have studied the shape of transmission
spectra taken with various sources and absorbers. · Four mechanisms
that affect the shape of the observed velocity spectra have been
important for the present work. These are:
a) Line broadening. Each component line of the
spectrum is expected to have a minimum width of 2rc/E
0• This is never realized in practice. First of all, the generally
non-negligible thickness, t, of the absorber results in a broadening
according to Visscher's formula by an amount
.6v
= 0.135 2rc tEo tm • (I. 7)
However, for t
.:S
5t , the distortion from Lorentzian line shape mis not significant. Unresolved hyperfine splitting is also generally
present and contributes to line broadening but the shape is
frequently unaffected for practical purposes. Instabilities in the
can sometimes also cause line broadening . A special
effect, which we have had to consider in the experiment on the 47-keV level in
w
183, is a broadening that occurs when the absorber is a powder and the size of the grains is _:::~
tm. More will be said about this in Section m. 5.b) Centroid shift. This may be caused in several ways, such as by second-order Doppler shift or by gravitational effects. Only the isomeric, or chemical, shift is important for us here. From the formula,
we see that for an isomeric shift to result, two conditions must be met: 1) the mean- square nuclear radii R in the excited and ground states must be different; and 2) the electronic charge density
\ *
(0)j
2 at the site of the nucleus must be different in the source and the absorber. With this type of interaction, every component line . of the spectrum is shifted by exactly the same amount as given byEquation I. 8 •.
c) Magnetic hyperfine interaction. This is the inter-action between the nuclear magnetic moment,
µ,
and the effective->
magnetic field, H, at the nucleus, which may arise from the
electrons in the solid or be externally applied by the experimenter. It has the Hamiltonian,
-+ -+ -+ -+
and the eigenvalues,
(I. 10)
where g is the nuclear g-factor, µn the nuclear magneton, and m
=
I, I - 1, ••• , -I, is the magnetic quantum number. The inter-action results in a splitting of the nuclear levels if If
0 andresolved lines in the observed velocity spectrum if 2r
.:S
gµ H. n Resolved lines result because the energy difference between the excited state and the ground state is no longer unique, but has the discrete set of values,E I = E - g' µ Hm I + gµ Hm '
mm o n . n . (I. 11)
where the primes refer to the excited state and m and m' run over all possible values.
Each of the (21 + 1)
x
(21' + 1) ·lines in the magnetic hyper-fine spectrum has a corresponding relative intensity that may be determined from the theory of ~adiative transitions. If the twostates with spins I and I' are connected by radiation of multipolarity, L, then a photon has the probability,
. I I' L 2 L ·
p mm'(e) 0: { m -m'
~m} z~
,(e),of being emitted or absorbed at any angle, e, relative to the
_,
quantization axis (direction of H) in the transition between the substates, (I, m) and (I', m'). In the formula, { } is Wigner's 3j symbol, and Z has the ·following dependence on e:
z~
(a)=
1 - cos2e (I. 13a)(I. 13b)
2 2 4
z
0(a)
= 2cosa
7 2cosa
(I. 13c)2 1 2 4 4
z
±l(a)
=
3 -
cose
+3
cosa
(I. 13d)2 1 1 4
z
2 (8) = - - - cos 8± 3 3 (I. 13e)
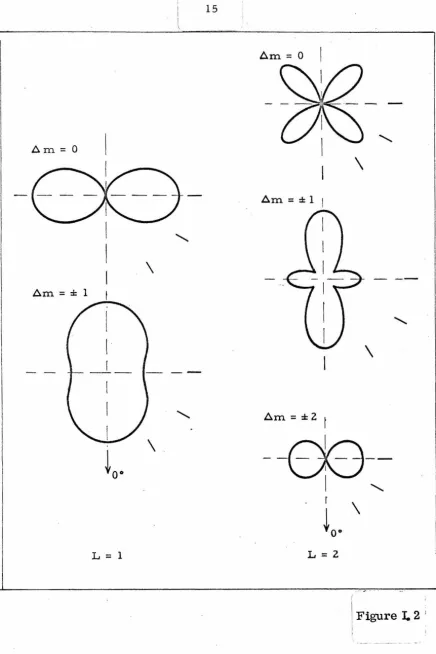
These are the radiation patterns appropriate for dipole and quadrupole
radiation, and have been drawn in Figure I. 2 for convenience.
By using a ferromagnetic source or absorber and an
external field of suffucient strength to polarize them, the
experi-menter can control the direction of the photon relative to the
quantization axis. For example, application of a strong longitudinal
field fixes 8 =
o
0, while a field applied transverse to the photondirection requires that 8 = 90°. Single crystal sources or
absorbers also restrict the value of 8. If an unpolarized powder
or polycrystalline source. or absorber is used in which the grains
are randomly oriented, then all values of
e
are possible, andFormula (I. 12) reduces to
I I' L ·2
p mm' oc: { m -m' t.m} • (I. 14)
d) Electric quadrupole interaction. This is the
inter-action between the nuclear electric qUa.drupole moment, Q .. , and
... lJ
nucleus, which is due to a nonspherical distribution of electric
charge surrounding the nucleus. It has the Hamiltonian,
J-l
= -i
I
Qij (V iEj)nuc· ij(I. 15)
The electric field gradient is a second rank tensor, but can always
be brought to diagonal form by choosing the proper set of three mutually perpendicular axes, fixed relative to the crystalline axes,
to correspond to the ij of (I. 15); furthermore, because of Laplace's equation,
r:
V .. = 0, only two of the V.. are independent. It isi l l l l
customary to define
eq = V
zz
, the magnitude of the electric field gradient,and Tl
=
v - v
xx
YY , the asymmetry parameter,vzz
where the axes have been chosen so that
IV I
>IV
I
>IV
I
zz -
yy -xx '
in which case, 0 < ri .:;;; 1. With these definitions and the conventional definition of the nuclear electric quadrupole moment eQ, the
Hamiltonian takes the form,
A A A
where I
±
= I x -+ i l y •If f1 = 0 the eigenvalues and eigenstates are obtained by
inspection from Equation I. 16. Each substate (except the one with
m = 0) is doubly degenerate and is specified by + m. However, when
ri
'f
O, Ji.Q does not commute with :J.i.M' the magnetic quantum .numbers are no longer valid quantum numbers for the substates, and
one must solve the secular equation for J-l.Q separately for each
different value of I. Jn the present experiments, only the
2+ level of
w
182~d
the 5/2-level ofw
183 showed measurable electric quadrupole interaction. The solutions for the secularequations for these two values of spin are presented in Table
m.
4.The relative intensities of the transitions that result in these two
Figure I. 1
Partial nuclear level schemes for
w
182,w
183, and
3-2
-
5-z
3-z
--i:----.--210 130 99 Ta1s3
~-~
9-2 L-2 5-z
3-z
i-2 5.0d 309 207 99 47 0
K
=
.!. 2Au19s
192d
Tal82
~- ~15d
4+----~ 329
z+
!
100o+
0wiaz
412 7
-2
5-2
6
2 2 2 9r
2t
*
.w1sa
K = ~
!
,
-
--.
--
-
--
-
-
--/ '
Figure I. 2
L
Dipole and quadrupole radiation patterns Z
Am= O
Am=O
\
Am=± l I
\
Am
=
:I: 1 f\
Am= :1: 2 t
--00--1 '
r \
i
0 • [image:25.553.58.495.24.679.2]L
=
l L=2II. EXPERIMENT
This chapter will describe the equipment and the materials
used in the performance of the Mtlssbauer experiment. There are
certain general aspects that practically all Mtlssbauer experiments
have in common. These are:
1) A source of y-radiation, generally produced by
bom-bardment of stable nuclei with energetic particles, such as neutrons,
protons, electrons, etc. The source may be used in the reactor
during or just after production, or at a later date.
2) A detector, sensitive to the y-rays of interest and
equipped with a discriminator for selecting pulses due to those
y-rays.
3) An absorber or a scatterer, placed in the path of the
y-rays. When Mtlssbauer absorption takes place, the counting rate
decreases in the detector discriminator if an absorber is used since
the absorbed photons are removed from the beam and increases with
a scatterer, because the detector is excited by photons emitted from the absorbing nuclei in the scatterer.
4) A drive, which moves the source or the absorber in a
controlled and predictable fashion.
5) Recording equipment, which keeps a record of the
number of pulses ( y-rays) appearing in the detector discriminator
when the source or absorber is moving at a certain velocity. This
record is the velocity spectrum (Figures m.1-5, 7-9) and is analyzed numerically to obtain the information sought from the
All of these features are present in the experiments
described in this thesis. However, in our experiments, only
absorbers have been used, and the drive motion has been imparted
to the source. Other equipment used in our experiments include a
specially constructed cryostat for cooling the source and the
absorber and magnets for polarizing the absorbers.
1) Sources and Detectors
As mentioned in the introduction (cf. Figure I. 1),
we are concerned here with five transitions in the three nuclei
182 183 195 . .
W , W , and pt • Extensive experiments were performed
in only four of these, however, since the velocity spectrum for the
fifth, the 130-keV of Ft195, could barely be distinguished from the
background after 40 hours of counting.
Sources for the
w
182 andw
183 measurements weremade by irradiating tantalum metal in a neutron flux of 3.3 • 1014
n/ cm 2 sec at the :Materials Testing Reactor in Arco, Idaho. Since
irradiation of natural Ta produces both Ta 182 and Ta 183, and since
the 100-keV line from the decay of Ta 182 and the 99-keV line from
the Ta 183 decay cannot be separated by scintillation spectrometers
(cf. Figure II. 1), precautions had to be taken to avoid a
simultane-ous measurement of recoiless absorption in
w
182 andw
183• For thew
182 experiments a 10-mil wire of Ta was used as sourcesince this was available from previous experiments on Ta182 with
the bent-crystal monochrometer at Caltech and since the Ta183
(5.0 days) had had sufficient time to decay completely. The
For the
w
183 experiments the sources were 4-mil Ta foilsespecially irradiated for the present experiments. After arrival
from the reactor they were checked with a lithium-drifted germanium
detector to determine the relative intensities of the 99 and 100-keV
y radiation (from Ta 183 and Ta 182, resp.). Since some of the
higher energy peaks of Ta 183 were easily resolvable from those
of Ta 182, and since the intensity ratios of these peaks to the 99 and
100-keV peaks, resp., have been previously determined, 3) the
relative intensities of the 99 and the 100-keV peaks could be
calcu-lated. It was found that only about 0.015 y-ray of 100-keV energy
(Ta182) was emitted for every 99-keV y-ray (Ta183) at the time the
source was removed from the reactor. However, the absorption
coefficient (cf. Equation L 6) for resonant absorption by unenriched
tungsten absorbers is 7.3 times3a) as great for the 100-keV y-ray
as for the 99-keV y-ray, and enrichment of the absorbers in
w
183was necessa:ry to reduce the
w
182 contribution to the velocityspectra to a negligible amount. Because of the short lifetime of
Ta 183 the time during which the source could be used was limited
to about two weeks after removal from the reactor, since at the end
of this time the
w
182 contribution had grown to nearly 2% of theeffect.
The source for the Pt195 experiments was commercially
prepared and was 2 mCi of Au195 activity diffused into a 1-mil pt
foil.
A sodium iodide scintillation detector (1-1/2"
x
1") and a double-delay-line amplifier were used to detect the y-rays at ahigh counting rate. Since the detector was mounted close to the
source and a superconducting solenoid (see Section II. 4) was used
compensate for the strong stray field ( F:;1 O. 5 kG) produced by the
solenoid in order to avoid the use of a light guide which would have
decreased the resolution of the scintillation detector. This was accomplished simply by surrounding the photomultiplier with a
µ-metal mantle and a compensating coil. Adequate compensation
could be provided, and almost the same resolution was obtained
as in the absence of the stray field. The window of the
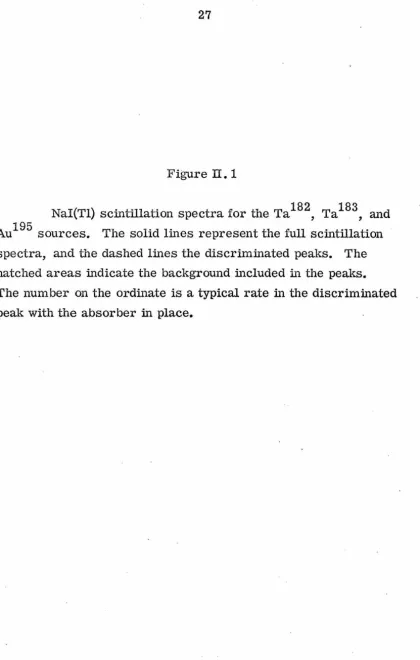
single-channel analyzer, set for the relevant photopeak, contained about
50% background from other lines for the 100-keV transition in
w
182and about 80%, 85%, and 35% for the 99-keV (W183), 46.5-keV
(w183), and
99~keV
(Ft195) transitions, respectively (see FigureII. 1). The 47-keV line was enhanced by the use of a critical
absorber of 180 mg/cm2 Tb
407" The precise position of the
47-ke V photopeak was determined by recording the difference between
pulse-height spectra obtained with and without recoiless absorption,
i. e. , with the source stationary and with the source oscillating with
high velocity.
All source material was mounted in a holder like the one
shown in Figure II. 2. The tubular end of the holder fits firmly
onto a rod that extends from the drive (as in Figure II. 3). Working
with solid or powdered source material is made much easier with
this design, since the material can be placed into the cap and the_ body
screwed down tightly. When sufficient precautions are taken, the outside of the holder does not become contaminated and the material
2) Absorbers
182 183 .
For the W and W experrments the absorber
material used included w metal, the compounds wo3, ws2, and
alloys of W with Fe, Co, and Ni. As pointed out in the previous
section it proved necessary to use enriched materials for all the
experiments performed with the 99-keV radiation of w183• The
enriched tungsten was obtained as w183
9
3,(82.5%w1
83, 6.4% w 182 ),
and thus all the absorbers for the w183 experiments had to be
produced with the oxide as starting material. Since the nuclear moments of the 99-keV state were obtained as ratios to the
moments of the 100-keV state, the absorbers for the w182
experiments had to be made in the same way, but with unenr:iched
WO 3 as starting material.
Absorbers of tungsten metal powder used tungsten
produced by the reduction of wo3 in a hydrogen atmosphere at
850°c. Tungsten sulfide, ws
2, was made by fusing a stoichio-metric mixture of tungsten (produced as above) and sulphur in a
pure nitrogen atmosphere in a sealed quartz tube at 900°C.
Experiments on w182 were also done with commercially obtained
Wand ws2• The velocity spectra obtained for the two types of
tungsten showed no significant difference, but the spectra for the
tWo types of ws2 were in total disagreement, in spite. of the fact that their x- ray diffraction patterns were identical. (Compare Figures ID. 7 and 8 and see Section ill. 3a for further discussion. )
The alloy absorbers for both w182 and w 183 contained
1.8 at.% tungsten dissolved in ultrapure iron, cobalt, and nickel,
except for the tungsten-iron absorbers used for the measurements
(It was verified by Mtlssbauer experiments in
w
182 that the effectivefields were the same for the two concentrations of tungsten. ) The
alloys were prepared by pressing tungsten powder (enriched for
experiments on the 99-keV level, natural for
w
182) into a small cavity in a pellet of the host material. By the use of thehigh-frequency field of a 5-kW ·induction furnace the pellet was levitated on a water-cooled silver boat and melted in an argon atmosphere.
Then the melt was kept for around 5 minutes at a few hundred degrees
above the melting point to homogenize it. The alloy was shaped by
repeated rolling and tempering in hydrogen to obtain disc- shaped ·
absorbers, which were used mainly for measurements with
trans-verse applied fields. For measurements without applied
field and with longitudinal field the absorbers were usually prepared by grinding the tempered alloy on a fine india stone and dispersing
the powder (average grain size: 3.5µ) in molten wax. However, this
was not possible for the absorbers used with the 99-keV radiation of
w
183, since one of the disadvantages of making absorber materialstarting from enriched material is that it is prohibitively expensive
to obtain large amounts of the material. It was thus difficult to
grind the
w
183-Fe alloy with the smali amount of material available,and it was therefore necessary to use the disc- shaped absorber for
the experiment with no applied field. Only partial polarization was
achieved however, as is evident from the velocity spectrum (Figure
m.
3). Several experiments were also done with tungsten-iron alloy produced by another technique. It was prepared by arc- melting in an argon atmosphere and carefully annealing in hydrogen and resulted inThe pt195 experiments used absorbers of pt metal, the
commercially obtained compounds Pt 0, pt
o
2, pt
c1
2, pt Cl4, and alloys of Pt with Al, Au, Fe, Co, and Ni. Most of the alloyabsorbers were prepared similarly to the W-alloy absorbers by
high-frequency melting, rolling, and tempering. A pt-Fe alloy
was prepared by arc-melting and carefully annealing for several
days, but no change in the velocity spectra was observed for the
· two absorber preparations.
All of the alloys for both the W and the Pt experiments
were carefully checked by x-r.ay analysis, and it was verified that
they were all solid solutions except for the Pt-Al alloy. In this
case the x- ray analysis indicated intermetallic- compound formation,
which is to be expected since a solid solution at room temperature
can be acquired only by extremely rapid quenching. 5) ,
The absorbers were generally in one of three forms: solid
plates or discs, powder dispersed in wax and shaped in a pill press
to form a pellet, or powder held fixed in a plastic container.
Tungsten and all the compounds were powdered absorbers, while
Pt and the alloys were generally plates. Various reasons dictated
the choice of the form of the absorber. For example, Pt is supplied
as a foil; flat plates were used for the alloys with Fe, Co, and Ni
to facilitate transverse polarization; on the other hand, for
measure-ments without applied field powdered absorbers were used since this ensures that the orientation of domains is random. For convenience
all powdered absorbers were in the form of wax pellets except those
. 183 183 183
for the 99-keV experiments on W • The W
o
3 and the W powders were held rigid in disc- shaped plastic containers ratherthan being mixed with wax for economic reasons. After the
experi-ments were performed the powders were recovered for use in making
WS
3) Drive and Data Storage
The motion of the source was provided by synchronizing
the motion of a transducer with a multichannel analyzer operating in
the multiscalar mode, as has been described in detail
elsewhere~)
The transducer provided a velocity of triangular waveform to within0.3%, as determined from the error signal. The electromechanical
drive was calibrated by mea,suring the velocity spectrum of a
single-line Co57 source versus an absorber of Fe57 in Armco iron. An
additional confirmation of the linearity of the velocity waveform was provided by taking calibration spectra at several different settings
of the peak-to-peak velocity. Calibration spectra were measured
with the source at 300, 77, and 4.2°K and the absorber at r.oom
temperature. The relative positions of the lines were those of
Preston et al., 7) which were used as the standard, to better than
0.4%. The data stored in the analyzer were punched onto paper tape,
which was then converted into IBM cards for use with the computer
program that analyzed the data.
4) Special Equipment
Because of the high energies of the transitions .
investi-gated, cooling of both the source and absorber is required to obtain
a measureable resonant absorption except for the 47-keV experi-ments. Most of the experiments were therefore performed at
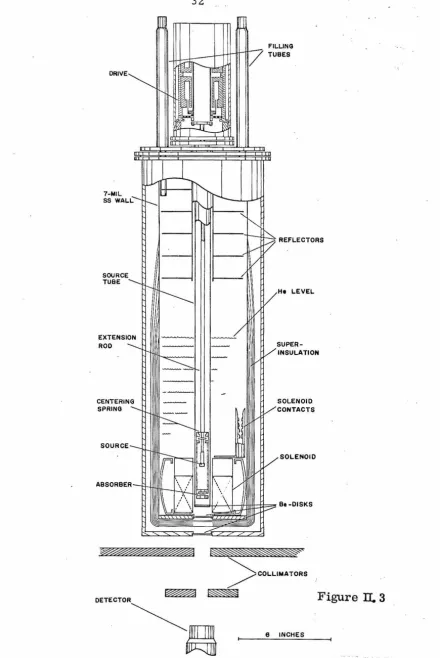
liquic'.l-helium temperature in a cryostat as shown in Figure II. 3. The
cryostat consists basically of two coaxial cylindrical containers
( -7 -6 )
separated by an evacuated volume 10 - 10 torr. The outer
container is made from an aluminum tube and the inner one from
thin (7-mil) stainless- steel sheet. The inner one is wrapped with
alternating with layers of 1/2-mil aluminum foil. Each layer of
aluminum foil is separately connected to the inner container above
the helium level so that the outer foils are connected to the upper
warmer part of the contairier. With this arrangement the heat
content of the outgoing gas is efficiently used. At the top of the
cryostat is placed a set of thin stainless-steel plates, which serve
the double purpose of radiation shields and separators for a number
of gas layers, thereby reducing the convection. These reflector
plates and the filling tubes are mounted to the plate covering the
top of the cryostat. A center hole in this assembly allows the
extended part of the drive system, containing the source and the
absorber, to be easily inserted into the cryostat. The transducer
itself rests on the top plate outside the cryostat. The construction
of the cryostat is simple and inexpensive, and a helium consumption
of about 0.13 -t/h is generally achieved.
The transducer, the source, and the absorber are
enclosed in a container that is easily removed from the cryostat.
The lower extended part, the source tube, is made of thin-:walled
(10-mil) stainless steel. It is surrounded by the liquid helium, but
is closed on the lower end by a thin beryllium disc which serves as
a window for the y-rays and allows the container to be evacuated
and filled with an exchange gas for heat transfer. The drive motion
is transmitted to the source by an extension rod (1/ 4" dia., 6-mil
wall stainless- steel tube) which is centered by a spiral- shaped
phosphor- bronze spring in the absorber holder, which is held firmly
in place in the source tube by a stiff spring. By lifting off the cover
to the drive container and pushing the exposed center tube of the
drive (containing the drive coils) do:.wnward, the absorber holder is
A small carbon resistor mounted on the extension rod is used to
monitor the temperature of the source and the absorber. The ease
with which the source and absorber may be removed from the
. cryostat, changed and re-inserted allows the use of strong sources. For the magnetization of the absorber in a direction
transverse to the y-ray beam, a C-shaped permanent magnet is
used and is mounted to the outside of the source tube. It provides
a field of about 2. 5 kG in the plane of a disc- shaped absorber.
Longitudinal magnetic fields of up to 50 kG at the absorber are
supplied by a superconducting solenoid. Current leads to the coil
and the heater for the superconducting switch are passed through
a long thin-walled stainless- steel tube and end in four annular
contact surfaces that mate with the solenoid contacts. It is
important to avoid contamination of the contacts with films uf
solid air or ice since the increased contact resistance causes
unnecessary heating which results in excessive helium loss during
the charging of the coil. Current to the coil up to 30 amperes is
supplied by a simple transistor circuit powered by storage batteries.
The velocity spectra for the experiments with the
100-keV radiation of
w
182 (Figure ID. 1) demonstrate that thepolari-zation of the absorber was just as expected: longitudinal,
trans-verse, or random, as appropriate. We were thus assured that
complete polarization or randomness was obtained in the absorbers
used for the 99-.keV experiments in
w
183 and Pt195 even though we were not able to verify this fact directly because of the poorFigure II. 1
Nal(Tl) scintillation spectra for the Ta 182, Ta 183, and
Au195 sources. The solid lines represent the full scintillation
spectra, and the dashed lines the discriminated peaks. The
hatched areas indicate the background included in the peaks.
The number on the ordinate is a typical rate in the discriminated
Ta1az Ta1as Au195 u <ll (/)
[image:38.550.103.498.32.689.2]-"' 0
... x 0 N u Q) (/)
-"' 0
... x I.I) N u Q) (/)
-"' 0...
....-x ray
x ray
\
47keV
""'
~x ray
0 100 200 keV
y-ray Energy
Figure II. 2
Source holder. The source material is placed in the cap and the body is screwed down with wrenches fitted to the
flats. The body is. bored out to be fitted onto the drive extension
Figure II. 3
Schematic diagram of the cryostat and the drive system
DRIVE
7-MIL SS WAL.L
SOURCE TUBE
EXTENSION ROD
CENTERING SPRING
~
REFLECTORS
He L.EVEL.
SUPER-INSULATION
SOLENOID CONTACTS
SOLENOID
Be -DISKS
~
> COLLIMATOR$
~ Figure IL 3
''''c''"~
[image:42.552.70.511.30.689.2]III. RESULTS
Shown in Figures III. 1-5, 7-9 are examples of velocity
spectra illustrating the various experimental situations encountered.
Partially resolved magnetic hyperfine spectra have been obtained
for the 100-keV transition in
w
182, the 99-keV inw
183, and the 99-keV in Pt195 (Figures III. 1-5), and have been used to obtain Refffor W and Pt in Fe, Co, and Ni. The magnetic moments of the
99-keV levels in
w
183 and Ft195 have also been derived. Spectra withstructure originating in electric quadrupole hyperfine interactions
(Figures III. 7-9) have been used to obtain the ratio of electric
quadrupole moments Q(2+)/Q(5/2-) for
w
182 andw
183 and also the gradient of the electric field eq forws2
and eq and the asymmetryparameter Tl for
wor
An isomeric shift has been identified for the first time in Pt19 (cf. Figures III. 4-6) and has yielded infor-mation about the first-excited and ground-state radii. An estimate has been made for the lifetime of the 99-keV state ofw
183, butbecause unresolved broadening is present in the corresponding
spectra, the error is quite large. The 47-keV transition of
w
183 is so broad that structure cannot be resolved. We have treated thiscase specially (cf. Figure III. 10) in order to obtain a value for the magnetic moment and the lifetime of the 47-keV state.
The spectra have been analyzed on the Caltech IBM 7094 computer by fitting them with the least-squares method to a sum of
Lorentzian-shaped lines (Equation I. 4). The interpretation of the spectra is based on Section 2 of the Introduction, and the application
to each particular case will be made as we discuss the analysis of
are: background B; slope of the background S; total dip of the
spectrum (% effect) H; peak width w; center shift (Pt195 only) c;
parameters used in specifying the peak positions e(j) when magnetic
dipole or electric quadrupole interactions are present; and additional
parameters used when it is desired to vary the relative intensities
h(j) of the component peaks in the:fitting procedure. The formula
we used in fitting the spectra was based on Equation L 4, · and has
the form
6 S H N
R(v) = B • 10 { 1 + - • v - - \
102 102
_l
J=l
h(j) } (III. 1)
1 + 42 [ v - c - e(j)] 2
w
where v is the instantaneous velocity of the source, R is the counting
rate in the detector, and N is the number of component peaks. The
formula represents the sum of a slanted baseline and a number of
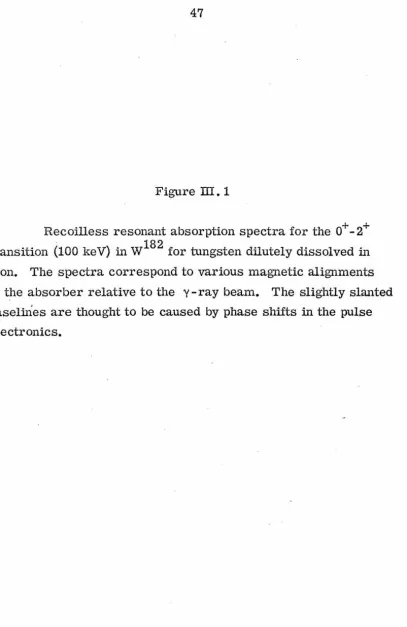
Lorentzian peaks. The slanted baselines are thought to be caused by
phase shifts in the pulse electronics. A spectrum was taken with a
nonresonant absorber to verify that the baseline was linear. The h(j)
are normalized by requiring ~ h(j) = 1.
Sometimes, and particularly for the Pt-Fe spectra of Ft195,
a considerably improved determination of essential parameters can
be achieved by a combined fitting procedure in which several different
spectra are analyzed together ·in one single least-squares procedure. A parameter in the function assigned to fit any one of the spectra
might also be used in the functions for other spectra. An example
of this is the line width corrected for absorber thickness. Therefore
spectra measured under different but complementary conditions
(e.g., applied magnetic fields) and fitted together usually determine
mdividually. If a combined fit of several spectra is possible,
systematic errors might be revealed if present in one spectrum
but not in the others.
1) Magnetic Hyperfine Interaction
For three transitions partially resolved magnetic
hyperfine interaction was observed: the (2+ -0+) 100-keV of
w
182,- -) 183 ( - -) 195
the (5/ 2 -1/ 2 99-keV of W , and the 3/2 -1/2 99..,keV of Pt •
These spectra are shown in Figures ill. 1-5. In each case the heavy
solid line that runs through the experimental points is the fitted
spectrum, and the lighter, smaller curves are the Lorentzian peaks
that contribute to the resultant spectrum. The positions of the
component peaks and their relative intensities are determined in
accordance with the rules described in Section I. 2c.
Formula (I. 11) gives the general relation used in
fitting the peak positions; it is used in the following form:
E mm , = E o + gµ H n [ m - (g'/g)m'
J •
(ill. 2)In this formula E
0 represents the experimental centroid shift of the
spectrum, gµ. H is the splitting of the sublevels of the ground state,
n
and g, / g is the ratio of the g-factor of the excited state to that of the
ground state. Thus if I
I
0 (as inw
183 and Pt195), the magneticparameters to be varied in the fit are gµn Hand g'/g. However
if I= 0 (as in
w
182), then ·E = E - g'µ H m'
and the variable magnetic parameter is g'µn H only.
The relative intensities of the component peaks depend on
the spins of the ground and the excited state, I and I', respectively,
on the multipolarity of the radiat_ion, L, and on the polarization of
the absorber. For "No Hext" (as used to designate the spectrum in
the figures) formula (I. 14) holds. For
"
II
Hext" or"1
Hext" formula (I. 12) must be evaluated. Table III. 1 gives the relativepeak intensities obtained in this manner. Since the polarization of
the absorber was known, the peak intensities were not allowed to
vary from the values listed in the table.
a) (2+ - o+) 100-keV transition in
w
182• The best resolvedof the spectra obtained in this work are those of Figure
m.
1. Theseare spectra measured with a Ta182 source and tungsten-iron absorbers
in various field configurations. The quality of the fit in each case
demonstrates that for
"I
I
Hext" and"l
Hext" complete alignment was'-~~hieved and for "No Hext" the alignment was completely random.
These spectra were also subjected to a combined fit (Results in
Table
m.
2) by restricting the magnetic parameter g' µ H as welln
as the widths of the individual Lorentzians to the same values for all
spectra. S_mall corrections for the effect. of the external fields on the splittings (for
II
Hext) and for the differences in the effective absorber thicknesses due to different spectrum shapes were taken into account. The combined fit gave results and errors not signtlicantly differentfrom the individual fits and thus served as further confirmation that
the absorber polarization was as intended.
The internal field at the tungsten nucleus was determined
by adopting the value g(2+) = 0.24 for the g-factor of the ·2+ state, an average of several recent measurements, S) and consistent with the
In Figure III. 2 are shown spectra taken with absorbers of tungsten dilutely dissolved in cobalt and nickel. Since systematic
errors affecting the polarization of the absorbers were found not to
be present for the experiments on W dissolved in Fe, the
measure-ments were performed only with transverse applied field. The peak
heights were taken in the fit to be those appropriate to the transverse
polarization. To obtain Heff a value was adopted for g(2+), as above.
A check on the reliability of the fitted spectra when they are
composed of a number of Lorentzian peaks is provided by comparing
the width of each component peak with the width of an absorber
with-out hyperfine interaction, in this case tungsten. By referring to
Table
m.
2, we see that the width of the component peaks in themagnetic hyperfine spectra agree well with that measured for a pure
tungsten absorber, after correction for absorber thickness.
b) (5/2- - 1/2-) 99-keV transition in
w
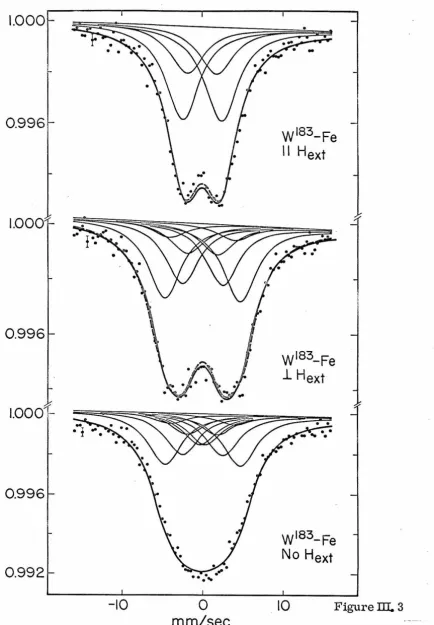
183• The observedmagnetic hyperfine patterns, shown in Figure III. 3 for a Ta 183 source and enriched tungsten-iron absorbers in the various field
configurations were subjected to a combined fit similar to that for 182
the Ta spectra. However, since a disc- shaped solid absorber
was used for the measurement without any applied field and an
experi-ment with Ta 182 and a solid absorber of similar shape indicated a
partial magnetic alignment, a combined fit was also performed
excluding this Ta 183 measurement. (The results of these fits are
included in Table
m.
2. ) For both types of combined fit, a determi-. nation of both the internal field and the g-factor of the 5/2- state wasattempted, but due to the strong correlation between the two
parameters the fits were very little affected by a change in the value
determined from the Ta 183 measurements alone. Therefore, the
internal field was fixed at the value determined from the Ta 182
measurements, and as a consequence the value obtained for g(5/2-).
+ . 182
depends on the adopted g-factor of the 2 state mW • Our results
have been computed on the basis of the combined fit that excluded the
no-field measurement, because the partial magnetic alignment of the
absorber in the absence of an applied field resulted in a poorer fit
when this measurement was included. The ratio g(5/2-)/ g(2+) = 1.40
+ 0.04 is constant to well within the error for g(2+) within 0.2 < g(2+)
< 0.3 and can be used to evaluate g(5/2-) when g(2+) has been consistently determined.
It is possible to fit the present measurements also with
a negative g-factor for the excited state, as well as the positive value we have been considering so far. The fit is, however, not so good as with the positive value, and the width of the fitted Lorentzians agrees not so well with the width determined for a tungsten absorber (refer
to Table
m.
2). A negative g-factor can therefore be ruled out.c) (3/2- - 1/2-) 99-keV transition in Pt195• The
magnetic hyperfine patterns obtained for different field configurations
and alloys of Pt with Fe, Co, and Ni are shown in Figures
m.
4 and 5.The spectra show little structure, and the individual peaks are not resolved. But an isomeric shift is clearly observed for the alloys
and will be discussed in the next section. The relative intensities of
the peaks in the fits were taken to be those appropriate for a pure Ml
transition. lO), ll) Fits to the individual spectra revealed a strong
correlation among four parameters, namely excited- state g-factor g
was the ref ore not possible. However, the situation was found to
improve markedly when a simultaneous fit was performed to the
spectra for all three field configurations. The parameters g 312, Heff' isomeric shift (I. S.), and width corrected ~or the difference
in the absorber thickness were constrained to be the same for the
six sets of data we had to fit. As a consequence the strong
correlations among the four parameters, i. e. , the corresponding
off-diagonal elements of the error correlation matrix, were reduced
up to 50%, and unique and rather precise values can be quoted for
these parameters. The results are presented in Table III. 3. The
. result
~or
g312 is based on the value g112 = 1.21204. 12
)
As a check on the internal consistency among the
individual measurements, drastically changed weights were assigned
to them, and the simultaneous fits were repeated. The spread of the
parameter values that resulted was compatible with the standard
deviations. In fitting individual spectra minima for Q2 could some-times be obtained for different sets of parameters. With this in
mind we repeated the simultaneous fit searching for other minima,
L
but none was found.
Figure III. 5 shows spectra from measurements with
transverse applied field on Pt-Co and Pt-Ni absorbers. By
constraining g
312 to the value obtained from the fit to the Pt-Fe data, Heff could be determined for the other alloys. The results
for the fits are presented in Table III. 3.
2) Isomeric Shifts
a)
w
182 andw
183• No evidence for an isomeric shift has been found in the measurements reported here (upper limit:195
b) pt , 99-keV. Isomeric shifts are clearly
observed for Pt in Fe, Co, and Ni (see Figures III. 4 and 5). In
addition to these alloys, shifts were measured also for 20 at. % Pt
in Au and O. 7 at.% Pt in Al. The shifts are plotted in Figure
m.
6versus the electronegativity of the host metal. Isomeric shifts have
also been observed in some compounds of Ft; namely, PtO (-0.34
± 0.11 mm/s), Ft0
2(-0.40 ± 0.08 mm/s), PtC12(-0.1
±
0.2 mm/s),and FtC14(-0.3 ± 0.3 mm/s).
From Figure ill. 6 it is seen that the isomeric shift
for the alloys decreases linea:i;ly with decreasing electronegativity13)
of the host element. (Pt-Al should be disregarded since it was not a solid solution. Refer to Section II. 2). This trend is opposite to that
197 13a) .
observed for Au by Barret et al. If we adopt the lme of reasoning
that decreased electronegativity of the host material results in an
increased electron density at the impurity nucleus, it follows that
the mean square radius of the Pt195 nucleus in the first-excited state
is smaller than that in the ground state.
3) Electric Quadrupole Interaction
Only the (2+ - o+) 100-keV transition of
w
182 and the(5/2- - 1/2-) 99-keV transition of
w
183 yielded measurable electricquadrupole interaction. The observed spectra are shown in Figures
ill. 7 - 9. The positions of the component peaks in these spectra are
gl.ven generally by Equation I. 16, since the ground states are unsplit
by the quadrupole interaction. For I= 2 and I= 5/2 Table ill. 4 gives
the energy levels E resulting from the electric quadrupole interaction,
the substates
w,
and the relative transition intensities T from theground state expected for a polycrystalline absorber with randomly
splitting factor, and it was varied in the fitting of the spectra. For
fitting
wo
3 spectra, ri was also variable. In several cases therelative peak heights given in the table did not provide a good fit,
and were therefore allowed to vary.
a) (2+ - O+) 100-keV transition in
w
182• The observed electric quadrupole patterns for the 100-keV transition in w182 are. shown in Figures ill. 7 and 8. The analysis (results in Table ID. 5)
of the tungsten disulfide spectra was performed with TJ = 0 since
ws
2 is axially symmetric. l4) It was found that fixing the relative peak intensities at 2:2:1 (cf. Tablem.
4) did not give a good fit. They were therefore allowed to vary, and the fit improved. Theanalysis of the velocity spectrum for the interaction energy e 2 qQ
was found however, to be insensitive to the relative intensities.
Spectra were taken with absorbers of commercially
obtained and laboratory prepared (see Section Il. 2) WS
2• The peak heights fit tQ the spectrum for the commercially obtained
ws
2 deviated more strongly from the expected 2:2:1 ratio than the home
prepared material, and the deviations of the peak heights for the two preparations were of opposite sign. X-ray and spectroscopic
analysis showed no difference between the two materials. In view
of the exceptionally high magnetic susceptibility of tungsten disulfide,
the measurements on the commercial material were repeated at 1.5°K with the absorber in a magnetic field of 50 kG to check on a possible magnetic interaction. No change in the anomalous spectrum
was observed. At 77°K a quadrupole pattern with peak intensities in
the expected ratio of 2:2:1 was obtained (Figure
m.
8), whichIn view of the difficulties encountered in the study of
the quadrupole interactions in tungsten disulfide, a similar study
of tungstic oxide was performed to obtain an independent
determi-nation of the ratio of the quadrupole moments for w182 and w183•
The symmetry at the site of the tungsten nucleus in tungstic oxide
is known to be low and implies a non-axially symmetric electric
field gradient, i. e. 11
f
0, at the tungsten nucleus. As isdemon-strated in Table III. 5 and Figure III. 7, a reasonable fit to the
measured velocity spectrum for the transition in w182 requires
a large asymmetry parameter, contradicting previous results. 16)
b) (5/2- - 1/2-) 99-keV transition in w183• The
velocity spectrum obtained for a Ta 183. source and an absorber of
enriched tungsten disulfide shows very little structure, as seen
from Figure III. 9. Therefore, the analysis of this spectrum is
not very sensitive to the relative intensities of the peaks. Since
the compound was prepared by the same technique as that for the
w182 measurement, the relative intensities of the lines were
inferred from that measurement and were kept fixed in the
least-squares fitting procedure. The parameters e2qQ for w182 and
w183 in ws2 could therefore be directly compared and the ratio Q(2+)/Q(5/2-) obtained. In fitting the velocity spectrum obtained
with the wo
3 absorber, 11 was fixed and set equal to the value determined from the w182 experiment. The resulting ratio of the
quadrupole moments is in good agreement with that determined from the tungsten disulfide experiments.
195
c) Pt , 99-keV. An attempt was made to observe
Absorbers of ptC1
2, ptC14, PtO, and pt02 were used but no statistically significant quadrupole interaction was seen.
4) Line Widths
Each spectrum fitted is assumed to be one Lorentzian dip or a com position of several, all of the same width. For each transition studied the widths of component peaks of the composite spectra were not significantly different from the width obtained for the unsplit absorber when the broadening effects due to absorber thickness were taken into account. Because these widths matched the width of the unsplit absorber, our confidence in the correctness of the fits was increased. Factors contributing to the widths of the peaks are discussed in Section I. 2a.
a)
w
182, 100-keV. The widths obtained from the · · t th (2+ o+) t ·t· ·w
182 · d various exper1men s on e - rans1 10n m are m goo agreement with the width observed using a tungsten metal absorber. The mean of the experiments, corrected for absorber thickness is 2.30 ± 0.06 mm/sec. A smaller value for this width, 2.0 ± 0.2 mm/ sec, has been quoted elsewhere. l 7) The discrepancy might be due to source broadening and to some extent to noise produced by the boiling liquid.183 182 .
b) W , 99-keV. As for W , there is good agreement among the widths determined for the (5/2- - 1/2-) transition in
w
183• These widths do not, however, correspond to the natural width,the spectrum shape was practically Lorentzian; hence the analysis
of the
w
183 (99-keV) spectra in terms of Lorentzian components isjustified. One can estimate the lifetime of the 5/2- state if one corrects for the source broadening by assuming it to be caused by
distributed electric field gradients. Then the width is 3.9 + 0.4
mm/sec, which corresponds to the half-life T
112(5/2-) = O. 72 ± 0.07 nsec.
195
c) Pt , 99-keV. The width, corrected for thickness
broadening, taking an average over several of the experiments is
18.0 ± 0.3 mm/sec, which implies an lower limit for the lifetime of
this state of T
112 > 0.154 nsec. This agrees with the electronically measured lifetime of T
112
~
0.16 nsec. 18)5) Special Case: 47-keV transition in
w
183A determination of the lifetime and the magnetic
moment of the 3/2- state in
w
183 was attempted. The dependenceof the absorption spectrum on the thickness of tungsten metal and
tungsten--iron alloy absorbers was studied. For absorbers of uniform
thickness, the half width of the nearly Lorentzian velocity spectrum
is expected to depend
!~nearly
on the thickness of the absorber 19), and the width corresponding to zero thickness can be determined by linearextrapolation, as demonstrated in Figure
m.
10. Fine powder(average grain size ~ 0.5 and s=:::1 0.02 recoilless resonant absorption
lengths for Wand W-Fe, respectively) dispersed in wax was, however, used for the absorbers. It was found for the tungsten measurements
that the widths measured are affected by the absorber granularity to
natural line width. The effects of absorber granularity have been
treated in detail elsewhere. 20) The correction to the extrapolated
width is approximately proportional to the grain size measured in
units of the recoilless resonant absorption length (t of Equation I. 6). m
In Figure
m.
10 estimations of this correction to the tungstenmeasurements are indicated, from which it is inferred that the
corresponding· correction to the tungsten- iron measurements is
negligible due to the much smaller grain size.
To avoid granularity effects, and since sufficiently thin
tungsten metal foils could not be obtained, solid absorbers of
tungsten-nickel alloy were used for the determination of the natural
line width of the 46.5-keV transition. Line broadening due to
magnetic interaction is negligible. From a combined least-squares
fit to the observed velocity spectra for six absorber thicknesses,
restricting the fitted widths to be proportional to the thickness of
the absorber, the width for zero absorber thickness was determined
to be 32.0
.±
0.8 mm/sec, which corresponds to the half-lifeT
112(3/2-)
=
0.184 + 0.005 nsec. Similarly, the vel9city spectra obtained for tungsten-iron absorbers were fitted in one least-squaresprocedure. The value 32.0 ± 0.8 mm/sec was taken for the width
corresponding to zero absorber thickness, and the ground- state
splitting was fixed to a value in accordance with the measured
internal field. The magnetic moment of the 3/2- state was then determined by the fit: g(3/2-)
=
-0.07 ± 0.07 or g(3/2-)=
0.2 ± 0.2.Only negative values for g(3/2-) are, however, consistent with other
experimental quantities (cf. Section IV. 2) • A fit to the W-Fe data
with variable width for zero absorber thickness was also possible
and gave values in agreement with the above, but with somewhat larger
Figure ID.1
Recoilless resonant absorption spectra for the
o+ -
2+transition (100 keV) in
w
182 for tungsten dilutely dissolved iniron. The spectra correspond to various magnetic alignments
of the absorber relative to the y-ray beam. The slightly slanted
[image:57.553.73.480.46.672.2]1.00
0.99
1.00
0.99
1.00
0.99
-10
0
mm/sec
.
.
• •
w1s2_Fe
11
Hext
w1s2_Fe
l
Hext
•
w1s2_Fe
No Hext
10
Figure III. 2
Recoilless resonant absorption spectra for the o+ -2+
transition in
w
182 for absorbers of tungsten dilutely dissolvedin cobalt and nickel and of tungsten metal powder. The
ferromagnetic absorbers were magnetized in a direction
transverse to the y-ray beam. The slightly asymmetric
velocity pattern for W-Co may indicate presence of quadrupole
interaction. A somewhat better fit to the spectrum was
obtained assuming combined magnetic and quadrupole
inter-action. The quadrupole interaction may be appreciable, but
it turns out that the value determined for the internal magnetic
0.995
1.000
1.000
rnm/sec
0
•
o.980 -
---::~---=jo~---'-
-5
mm/sec
w1s2_Ni
.L
Hext
w1s2
5
.
Figure ID. 3
Recoilless resonant absorption spectra for the 1/2
-5/2- transition (99 keV) in
w
183• A disk-shaped absorber of enriched tungsten dilutely dissolved in iron was used. The solid curves are the fitted functions for the three spectrasimultaneous fitted by the least- squares method. The dashed
curves correspond to the fit to the two spectra measured with