This is a repository copy of
Management Objectives for Local Rail Services.
.
White Rose Research Online URL for this paper:
http://eprints.whiterose.ac.uk/2399/
Monograph:
Hartley, T.M. and Nash, C.A. (1980) Management Objectives for Local Rail Services.
Working Paper. Institute of Transport Studies, University of Leeds , Leeds, UK.
Working Paper 132
[email protected] https://eprints.whiterose.ac.uk/ Reuse
See Attached Takedown
If you consider content in White Rose Research Online to be in breach of UK law, please notify us by
White Rose Research Online
http://eprints.whiterose.ac.uk/
Institute of Transport Studies
University of Leeds
This is an ITS Working Paper produced and published by the University of
Leeds. ITS Working Papers are intended to provide information and encourage
discussion on a topic in advance of formal publication. They represent only the
views of the authors, and do not necessarily reflect the views or approval of the
sponsors.
White Rose Repository URL for this paper:
http://eprints.whiterose.ac.uk/
2399/
Published paper
Hartley, T.M. and Nash, C.A. (1980)
Management Objectives for Local Rail
Services.
Institute of Transport Studies, University of Leeds, Working Paper 132
MANAGEMENT OBJECTIVES FOR
LOCAL RAIL SERVICES
by
T.
M. Hartley and C. A. Nash
Working Papers are inffsndsd to promid8 information and smourags dtscus&on on a topic in advams of formal publication. They reprsssnff onZg the dews of the authors and do not nsceesariZg repscf the a h OF appromaZ of the sponsers.
Working Paper
132
1980
MANAGEMENT OBJECTIVES FOR LOCAL RAIL SERVICES
by
ABSTRACT
HARTLEY, T.M. and C.A. NASH (1980) Management o b j e c t i v e s f o r l o c a l r a i l s e r v i c e s . Leeds: Univ. Leeds, I n s t . Transp. Stud., Work. Paper 132
Using h i e r a r c h i c a l l o g i t modal s p l i t models, and t r i p data from West Yorkshire, t h e e f f e c t s of pursuing a number of d i f f e r e n t o p e r a t i n g s t r a t e g i e s f o r l o c a l r a i l s e r v i c e s were analysed. These were judged a g a i n s t two p o s s i b l e management o b j e c t i v e s which railway o p e r a t o r s might be s e t , t o f i n d which p o l i c i e s b e s t served each o b j e c t i v e .
The more pragmatic o b j e c t i v e of maximising r a i l passenger-
km. t u r n e d out t o give s i m i l a r p o l i c y implications t o an o b j e c t i v e of maximising s o c i a l b e n e f i t . These w e r e d t h a t both o b j e c t i v e s could b e s t be s a t i s f i e d by a combination of lower f a r e s and replacement of l i g h t l y loaded s e r v i c e s by express bus. Conclusions on frequencies were l e s s c l e a r c u t , but it appeared t h a t very high e l a s t i c i t i e s would be required t o j u s t i f y peak frequencies above t h e minimum necessary t o cope with t h e t r a f f i c . The major d i f f e r e n c e between t h e o b j e c t i v e s came i n t h e treatment of off-peak r a i l f a r e s , where reductions could b r i n g l a r g e r i n c r e a s e s i n passenger kilometres but s i m i l a r o r smaller s o c i a l b e n e f i t s p e r pound t o peak reductions.
CONTENTS
Abstract
1. Introduction
2. The Modelling Approach
3.
Resource requirements4.
Cost, revenue and benefit estimation5.
Policies tested and their evaluationa) Changes in rail fares
b) Changes involving Metrocard
c) Changes in rail service frequencies d) Replacing lightly loaded services
with Express Bus Services
6.
General implications of results7.
Comparisons with results for other services8.
ConclusionsReferences
Acknowledgements
MANAGEMENT OBJECTIVES FOR LOCAL R A I L SERVICES
1. INTRODUCTION
A s p a r t of an SSRC-sponsored p r o j e c t on management o b j e c t i v e s and
methods of f i n a n c e f o r r a i l t r a n s p o r t , a d e t a i l e d study has been made
of t h e e f f e c t s of following a range of d i f f e r e n t p o l i c y o p t i o n s f o r
l o c a l r a i l s e r v i c e s , taking West Yorkshire a s a case study a r e a . Most
a t t e n t i o n was paid t o t h e s e s e r v i c e s ( r a t h e r than t o I n t e r C i t y and
London and t h e South E a s t ) f o r two main reasons :-
1) The ready a v a i l a b i l i t y of data f o r a l l modes of t r a n s p o r t i n West Yorkshire, p r i m a r i l y from t h e WYTCONSULT surveys of 1975.
This has permitted a more d e t a i l e d measurement of t h e s o c i a l
c o s t s and b e n e f i t s of d i f f e r e n t p o l i c i e s f o r t h e s e s e r v i c e s
t h a n f o r t h e o t h e r s e r v i c e groups.
2 ) The r e l a t i v e l a c k of knowledge of p r i c e and q u a l i t y e l a s t i c i t i e s
of demand f o r l o c a l p r o v i n c i a l s e r v i c e s . By c o n t r a s t , a
considerable amount of work has been undertaken r e c e n t l y on
I n t e r C i t y and London and South East s e r v i c e s , which has
provided parameters which can be incorporated i n t o models of
t h e s e s e c t o r s .
It should be noted t h a t we were concerned t o t e s t t h e consequences
of a l t e r n a t i v e simple o b j e c t i v e s using conventional techniques a p p l i e d
t o t h e s e s e r v i c e s purely a s a case study. The important p o l i t i c a l ,
s o c i a l and i n s t i t i t u t i o n a l f a c t o r s which determine a c t u a l p o l i c y making
a r e not considered i n t h i s paper, which i s not intended t o comment
d i r e c t l y on t h e p o s i t i o n i n West Yorkshire. I n any event, our d a t a and
conclusions r e l a t e t o t h e p o s i t i o n i n 1975, p r i o r t o t h e signing of t h e
Section 20 agreement under which t h e P.T.E. i s now r e s p o n s i b l e f o r f a r e s and s e r v i c e l e v e l s on t h e s e s e r v i c e s .
2. THE MODELLING APPROACH
Given t h e importance of n o n - l i n e a r i t i e s and i n d i v i s i b i l i e s i n t h e
c o s t and demand f u n c t i o n s faced by r a i l o p e r a t o r s , it was not considered
f e a s i b l e t o produce a single-mathematical model which could be optimised
with respect t o t h e d i f f e r e n t o b j e c t i v e s s e l e c t e d . I n s t e a d , t h e
s e r v i c e l e v e l s f o r t h e s e r v i c e s under consideration, and t o c o s t
s e p a r a t e l y t h e s p e c i f i c changes i n s e r v i c e l e v e l s and t r a f f i c implied
by each policy.
For t h e l o c a l s e r v i c e s , d i f f e r e n t techniques were employed f o r
f o r e c a s t i n g peak (predominantly journey t o work) and off-peak t r i p s .
For t h e peak t r i p s ,
a
d e t a i l e d a n a l y s i s of t h e s p l i t of t r i p s between modes was considered necessary, because it was assumed t h a t mostchanges i n r a i l t r a f f i c would be d i v e r t e d to/from o t h e r modes. Also
t h i s was necessary t o examine changes i n s o c i a l c o s t s due t o congestion.
Data were a v a i l a b l e from t h e WYTCONSULT surveys on peak c a r , bus and
r a i l t r i p s a t an aggregate zonal l e v e l , which were used t o c a l i b r a t e
models o f mode choice i n t h e county. D e t a i l s o f t h e d a t a and model
s t r u c t u r e s e l e c t e d a r e given i n Hartley and Ortuzar, 1980, but
b a s i c a l l y t h e model followed a h i e r a r c h i c a l l o g i t s t r u c t u r e . I n t h i s ,
t r i p s were f i r s t s p l i t between bus and r a i l . A b i n a r y l o g i t form of model was used i n each of t h e s e two s t a g e s t o c a l i b r a t e models from
t h e survey r e s u l t s . T r i p c h a r a c t e r i s t i c s were represented by g e n e r a l i s e d
c o s t , which f o r c a r included network time, perceived operating c o s t
divided by average occupancy and parking charges. For p u b l i c t r a n s p o r t
t h e components were f a r e s , in-vehicle time, and walking and waiting
time (both weighted r e l a t i v e t o in-vehicle t i m e ) .
It was found t h a t t h e d i f f e r e n c e i n g e n e r a l i s e d c o s t s gave t h e b e s t
model fit f o r s h o r t t r i p s , and t h e r a t i o of g e n e r a l i s e d c o s t s was b e s t
f o r long t r i p s , (Hartley, 1979b). T r i p making data was a l s o disaggregated
by household c a r ownership, i n t o 0, 1 and 2+ c a r s per household with t h e dividion by d i s t a n c e , t h i s gave s i x s e p a r a t e data s e t s , f o r each of
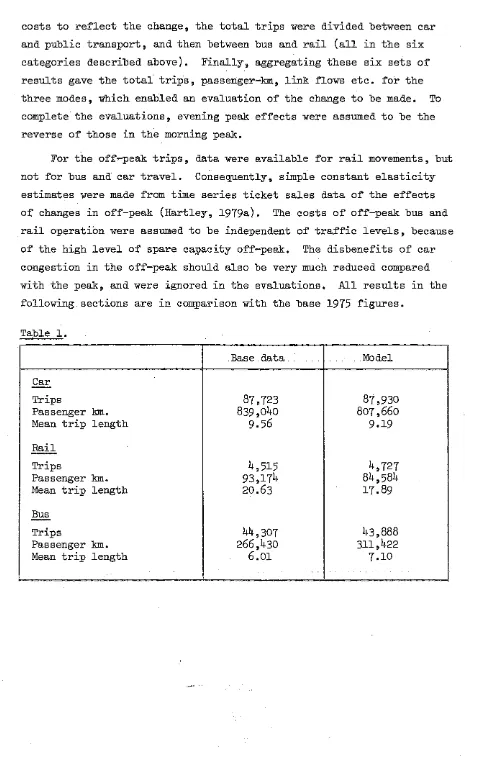
which, models were c a l i b r a t e d using t h e WYTCONSULT data. The goodness
of fit of t h e r e s u l t i n g s e t of models i s i l l u s t r a t e d i n Table 1. It w i l l be seen t h a t t r i p t o t a l s by mode a r e c l o s e l y reproduced, b u t t h a t
t h e r e i s some tendency f o r t h e models t o over-allocate longer t r i p s t o
bus and s h o r t e r t r i p s t o r a i l and c a r . Nevertheless, it was f e l t t o be
s u f f i c i e n t l y a c c u r a t e f o r t h e s o r t of broad s t r a t e g i c i s s u e s with which
we were concerned.
To i n v e s t i g a t e t h e e f f e c t s of changing t h e r a i l o p e r a t i o n (e.g. by
a l t e r i n g f a r e s o r f r e q u e n c i e s ) , it was assumed t h a t t o t a l peak t r i p s
c o s t s t o r e f l e c t t h e change, t h e t o t a l t r i p s were divided between c a r
and public t r a n s p o r t , and then between bus and r a i l ( a l l i n t h e s i x
c a t e g o r i e s described above). F i n a l l y , aggregating t h e s e s i x s e t s of
r e s u l t s gave t h e t o t a l t r i p s , passenger-km, l i n k flows e t c . f o r t h e
t h r e e modes, which enabled an evaluation of t h e change t o be made. To
complete t h e e v a l u a t i o n s , evening peak e f f e c t s were assumed t o be t h e
r e v e r s e of t h o s e i n t h e morning peak.
For t h e off-peak t r i p s , data were a v a i l a b l e f o r r a i l movements, but
not f o r bus and c a r t r a v e l . Consequently, simple constant e l a s t i c i t y
estimates were made from time s e r i e s t i c k e t s a l e s d a t a of t h e e f f e c t s
O$ changes i n off-peak (Hartley, 1979a). The c o s t s of off-peak bus and
r a i l operation were assumed t o be independent of t r a f f i c l e v e l s , because
of t h e high l e v e l of spare c a p a c i t y off-peak. The d i s b e n e f i t s of c a r
congestion i n t h e off-peak should a l s o be very much reduced compared
with t h e peak, and were ignored i n t h e evaluations. A l l r e s u l t s i n t h e
following s e c t i o n s a r e i n comparison with t h e base 1975 f i g u r e s .
Table 1.
T
Trips
Passenger km.
Mean t r i p l e n g t h
R a i l
-
T r i p s
Passenger km.
Mean t r i p length
Bus
-
T r i p s
Passenger km.
Mean t r i p l e n g t h
[image:9.595.66.554.64.829.2]3. RESOURCE REQUIREMENTS
As a preliminary t o c a l c u l a t i n g t h e c o s t changes i n each of t h e
options examined, it was necessary t o work out t h e changes i n resources
used t o operate t h e r e v i s e d s e r v i c e s . A l l t h e l o c a l r a i l s e r v i c e s were operated by d i e s e l multiple-unit s e t s ( 2 o r more c a r s t o g e t h e r ) , and t h e
number of c a r s i n use during t h e peak determined t h e f l e e t s i z e . This
had t o be i n f l a t e d by 25% t o allow f o r c a r s undergoing maintenance and
r e p a i r .
For t h e s e peak s e r v i c e s , t h e model output f o r t h e r a i l s e r v i c e s
was i n t h e form of d i r e c t i o n a l l i n k flows over segments of r o u t e . The
f i r s t requirement was t o f i n d how passengers over common s t r e t c h e s of
r o u t e were d i s t r i b u t e d between Local and I n t e r c i t y t r a i n s , and a l s o
between d i f f e r e n t l o c a l t r a i n s , f o r estimating t r a i n loadings and
a l l o c a t i n g revenue. The only sources of d a t a t o permit t h i s a l l o c a t i o n
were t h e Passenger Train Surveys (P.T.S.) c a r r i e d out by B r i t i s h Rail.
These l i s t e d t r a i n boardings, a l i g h t i n g s and c a p a c i t i e s a t each
s t a t i o n . The d a t a s e t c l o s e s t i n time t o t h e WYTCONSULT R a i l Survey
(June 1975) was t h a t f o r November 1976, and f o r t h a t reason, t h e r e may
be some discrepancies i n t h e a l l o c a t i o n s .
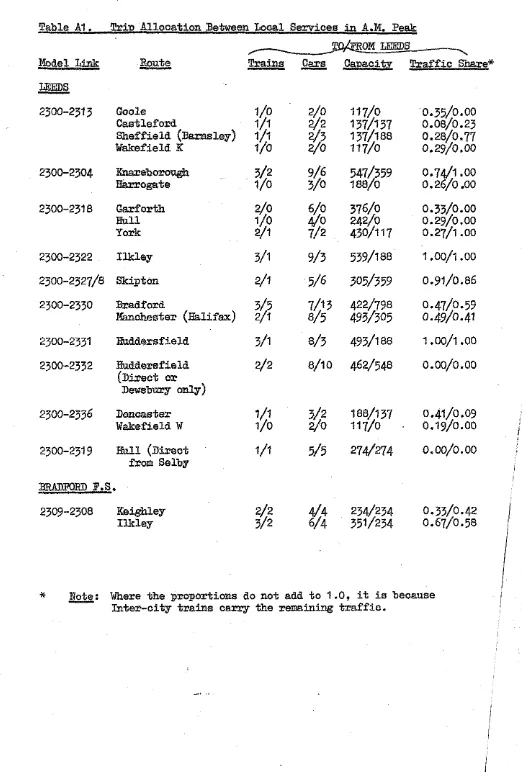
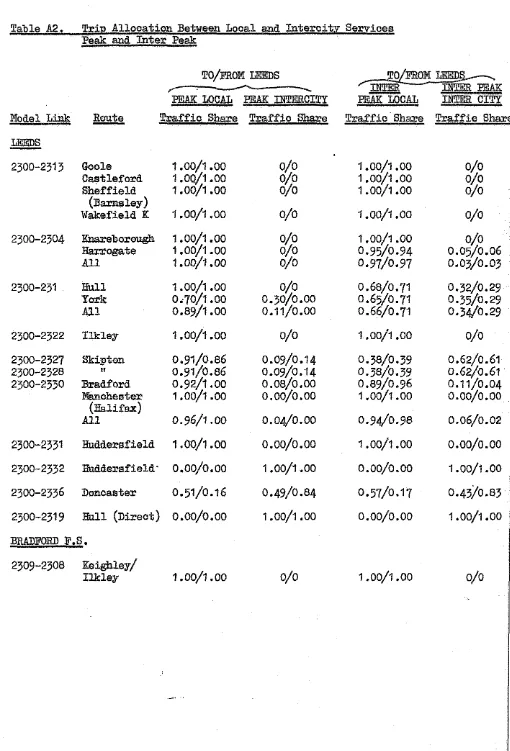
I n t h e morning peak, t h e h e a v i e s t loads a r e found i n t h e l i n k s
n e a r e s t t o Leeds and Bradford s t a t i o n s . The f i g u r e s output by t h e model
f o r t h e s e l i n k s were divided between t h e t r a i n s t o compare l o a d s and
c a p a c i t i e s , using f a c t o r s derived from t h e P.T.S. counts. The c a p a c i t y
operated and t h e t r a f f i c shares observed by P.T.S. between s e r v i c e s on
each r o u t e i n t h e morning peak a r e shown i n t h e Appendix, Table
Al.
Thecorresponding s p l i t between l o c a l and I n t e r c i t y t r a i n s i s given i n
Table A2 which a l s o shows t h e inter-peak proportions.
It was more involved t o a l l o c a t e passenger-km between l o c a l and
I n t e r c i t y t r a i n s . For each j o i n t r o u t e , a l l t h e l i n k s had t o be
i d e n t i f i e d , t h e t r a f f i c proportions applied t o t h e t o t a l s , and t h e
r e s u l t s m u l t i p l i e d by t h e l i n k l e n g t h t o give l o c a l and I n t e r c i t y
passenger-km. This procedure was used t o s e p a r a t e t r i p s and
passenger-km f o r t h e modelled base p o s i t i o n r e s u l t s , but f o r a l l t h e
options analysed, t h e changes i n t r a f f i c were assumed t o t a k e place on
t h e l o c a l s e r v i c e s , where a l l t h e supply changes were made. Therefore
changes i n l o c a l t r a f f i c were c a l c u l a t e d by f i n d i n g t h e d i f f e r e n c e s i n
t o t a l f i g u r e s f o r each run. It was then only necessary t o s p l i t up t h e
f i g u r e s according t o t h e f a c t o r s i n Table
Al.,
i n order t o check ont h e c a p a c i t y of l o c a l s e r v i c e s . A maximum l o a d f a c t o r of 80% was used f o r a l l l o c a l r a i l t r a i n s , w i t h c a r s being added o r removed according
t o t h e t r a f f i c l e v e l s , so a s t o maintain t h i s l o a d f a c t o r .
It was assumed i n t h e inter-peak period t h a t l o a d f a c t o r s would be
low enough t o allow any t r a f f i c increase t o be c a t e r e d f o r w i t h i n t h e
current capacity. Reductions i n inter-peak t r a f f i c did not save s t o c k ,
a s t h e f l e e t s i z e was determined by t h e peak.
Where s e r v i c e frequencies were a l t e r e d , schedules were drawn up
manually t o e s t i m a t e t h e number of s e t s of stock needed.*
I n considering reduced frequencies, t h e p o s s i b i l i t y of s i n g l i n g
t r a c k a r i s e s , but f o r t h e cases examined i n t h e study, t h i s was not
f e a s i b l e because of o t h e r t r a f f i c . Where r a i l passenger s e r v i c e s were
abandoned, it was assumed t h a t t r a c k and s i g n a l l i n g savings would only
be p o s s i b l e on one r o u t e with n e g l i g i b l e f r e i g h t t r a f f i c , and t h a t
elsewhere t h e i n f r a s t r u c t u r e would be required f o r f r e i g h t t r a f f i c .
In p r a c t i c a l terms, t h e p o s i t i o n i s more involved t h a n t h i s
because of t h e way t r a c k c o s t s a r e a l l o c a t e d t o t r a f f i c s . Where PTE
passenger s e r v i c e s and f r e i g h t s h a r e t r a c k c a p a c i t y , t h e m a j o r i t y o f
t h e t r a c k c o s t i s a t t r i b u t e d t o t h e passenger s e r v i c e s , with f r e i g h t
only being r e s p o n s i b l e f o r t h o s e c o s t s which would cease t o be i n c u r r e d
i f it were withdrawn.
I f t h e passenger s e r v i c e i s removed from t h e r o u t e , t h e n t h e f u l l
c o s t of t h e t r a c k f a l l s on t h e f r e i g h t operation. This could make t h e
f r e i g h t s e r v i c e s unviable, with t h e r e s u l t t h a t
a l l t r a f f i c on t h e r o u t e
could cease and t h e f u l l c o s t of t r a c k provision and maintenance would be saved, but with t h e l o s s of some f r e i g h t revenue.Even i f withdrawing t h e P.T.E. s e r v i c e s did not t r i g g e r o f f t h i s chain of e v e n t s , from t h e P.T.E. viewpoint t h e r e would be an immediate
t r a c k c o s t saving when t h e a l l o c a t i o n of c o s t s changed from t h e P.T.E.
t o t h e f r e i g h t s e r v i c e s . S i m i l a r r e a l l o c a t i o n s may be t r i g g e r e d o f f by
a change i n passenger frequencies, where a reduction may i n c r e a s e t h e
proportion of t r a c k and s i g n a l l i n g c o s t s which would be avoided by t h e
simultaneous removal of f r e i g h t s e r v i c e s and v i c e versa. So t h e c o s t
f i g u r e s i n t h e t a b l e s should be i n t e r p r e t e d a s changes i n c o s t s experienced
by t h e railways a s a whole, r a t h e r than from t h e narrower i n t e r e s t of
t h e P.T.E., o r even an i n d i v i d u a l B.R. business s e c t o r . It i s a l s o t h e case t h a t changes i n c o n t r i b u t o r y revenue a r e not passed on t o t h e
P.T.E., although t h i s f i g u r e i s small i n t h e c o s t s examined.
A f u r t h e r complication a r i s e s i n one of t h e r o u t e s which goes o u t s i d e t h e county boundary i n t o a non-P.T.E. a r e a . Here, t h e j o i n t t r a c k c o s t s
f o r t h e s e c t i o n o u t s i d e t h e metropolitan county f a l l again on t h e
passenger s e r v i c e s before f r e i g h t , but t h i s time a s p a r t of t h e Public
Service Obligation from t h e Department of Transport. So, again, from
t h e pointi of view of t h e passenger business, withdrawing such a s e r v i c e
would save t r a c k c o s t s , which would be r e - a l l o c a t e d t o f r e i g h t .
4.
COST, REVENUE: AND BENEFIT ESTDUTIONThe changes i n c o s t s of operating t h e r a i l s e r v i c e s under each
p o l i c y were c a l c u l a t e d i n d e t a i l when t h e changes i n resourcerequirements
had been found, a s described i n t h e l a s t s e c t i o n , using ' t y p i c a l ' u n i t
c o s t s supplied by B.R. From t h e t o t a l c a r s f i g u r e were c a l c u l a t e d f u l l replacement c o s t d e p r e c i a t i o n , c a p i t a l charges ( a t 10% i n t e r e s t f o r
a 30 year l i f e ) and time-dependent maintenance and cleaning c o s t s .
Multiplying t r a i n l e n g t h s by r o u t e mileage and d a i l y frequency gave
d a i l y car-miles, from which d i s t a n c e - r e l a t e d maintenance c o s t s and f u e l
usage were found. Train crew needs were r e l a t e d t o peak t r a i n s i n
s e r v i c e , assuming two crews would be needed f o r each peak t r a i n , and a
pay t r a i n guard on every two c a r s where s t a t i o n s were u n s t a f f e d .
It should be s t r e s s e d t h a t t h e s e c o s t estimates a r e very much
long-run upper bounds. I n t h e short-run, c o s t changes from reductions
i n s e r v i c e s a r e l i k e l y t o be very much lower. Moreover, t o t h e Bxtent
t h a t l i k e - f o r - l i k e replacement w i t h e x i s t i n g l e v e l s f o r f u e l and
maintenance c o s t i s assumed, even i n t h e long-run lower c o s t s may be
p o s s i b l e by use of cheap, lightweight v e h i c l e s . Also
7%
would now bea more a p p r o p r i a t e i n t e r e s t r a t e t h a n t h e 10% upon which t h e s e f i g u r e s
a r e based. Together, t h e s e f a c t o r s may reduce f u t u r e c o s t s by up t o
30%, and t h u s make maintenance and/or i n c r e a s e of frequencies a much
h g i n a l terminal costs at staffed and unstaffed stations were
assumed to be zero.
Only in the options where stations were completely
closed were costs assumed to be escapable.
These covered station
operating and maintenance, but not accounting charges for amortisation
of buildings and depreciation of plant.
Disposal values were not
taken into account.
Fixed m u a l costs for track were used, together
with incremental wear and tear costs for service level charges.
Signalling
maintenance and operation costs were assumed only to be influenced by
line closures, after allowance had been made for
any
freight trains
remaining on the lines.
Management and administration costs were
assumed to consist of a fixed sum, and a variable portion equal to
10%of the costs of train services, terminals, track and signalling.
All
unit costs were reduced to per kilometre or per day figures (assuming
300 da~rs
operation per mum).
Bus operating costs were calculated more simply as a fixed cost
per bus per day (for either peak-only operation or all
dayservice),
and
a variable cost per bus mile, and were based on the Bradford Bus
Study
(R.
Yravers Morgan,
1976).
The figures for bus Brips and bus
passenger-km were not disaggregdted by route, but it was assumed that
the number of peak buses in service would be closely related to the
number of peak bus trips, so that a
change
of 50 peak trips would, on
auerage, cause a
change
of
1
bus in the fleet requirement.
This may be
optimis'cio, for those cases where the change in traffic is in fact spread
over several routes.
In the inter-peak, it was assumed that traffic
did not affect costs, except where new services were added.
Revenue for the rail services was calculated from the allocations
of passengers and passenger-km discussed
inthe last section, and linear
fare scales based on distance travelled, which gave good approximations
to the Bullseye weekly season ticket
and
the standard fare.
For each
origin-destination pair, the laver of the two fares was found and all
peak passengers were assumed to pay the lower fare; off-peak passengers
were assumed to travel at standard rates.
A sirnilas procedure was
month.
Againpeak passengers were allocated to the lower cost fare
system.
This
mayhave exaggerated the use of season tickets, as their
use is only economic for regular travel, but no data were available on
the split as between season
and
standard tickets for peak trips*.
The
total revenue of bus and rail was found by multiplying trip numbers
and
distances by the relevant fare scales, and adding the results.
Peak passengers changing mode to or from bus in the policy evaluations
were assumed to use metrocard.
One further aspect of rail receipts is the problem of contributory
revenue, i.e. the effect on long distance rail trips from changes
in
the local network.
In West Yorkshire (excludbg ~eeds)
some
15%
of
originating rail passengers changed trains during their journey (Usually
at ~eeds).
To estimate the impact of the options tested, access data
for Inter City rail journeys from Leeds to London was drawn from a
study by Moss
and Leake (1976).
Taking those journeys which started
on the local rail network, the effect of the
ohange inthe local service
in
relation to the total journey (local plus Inter city) was estimated.
Inter city fares
and journey time elasticities of 0.7 derived from other
studies, were used to predict the change
inInter city jourmeys resulting
from the local service alterations.
Trips between Leeds
and London
account for approximately half of all Inter city trips made from West
Yorkshire.
Thus, this is very
muoh
a minimum estimate, but the magnitudes
are so small that a doubling or trebling of the figure would not affect
the conclusions.
The
ohan@;e
inrail usersf
benefit was calculated by the conventional
"rule of a half" measure for each origm/destination pair in the trip
matrix as follows, and then summed to give the total effect:
Benefit
=&%&I
+
%)(c,
-
c2)
where
&I,%
=number of trips before and after change.
I
CI,C2
=generalised cost before am3 after change.
I
*
In theory this split should be dealt with as a third level in the
hierarchical modal split model, but usage data would
beneeded to
calibrate such an extension to the model.
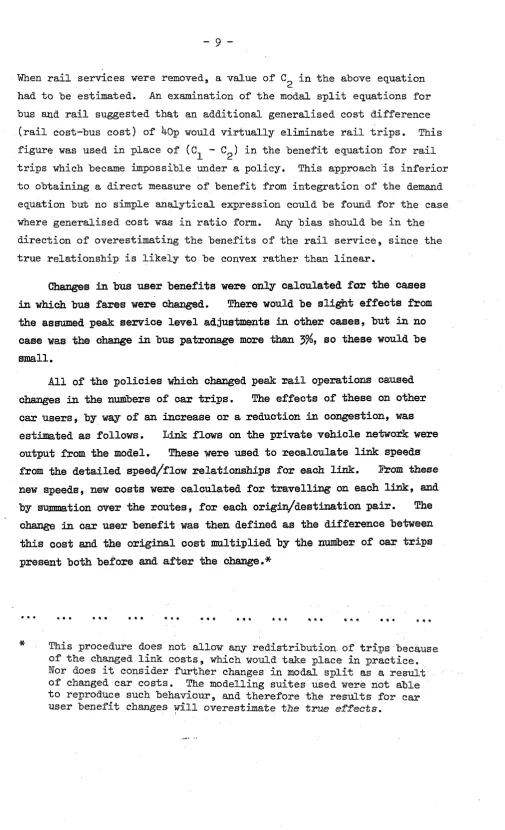
When r a i l s e r v i c e s were removed, a value of C i n t h e above equation 2
had t o be estimated. An examination of t h e modal s p l i t equations f o r
bus and r a i l suggested t h a t an a d d i t i o n a l g e n e r a l i s e d c o s t d i f f e r e n c e
( r a i l cost-bus c o s t ) of 40p would v i r t u a l l y e l i m i n a t e r a i l t r i p s . This
f i g u r e was used i n p l a c e of ( C
-
C ) i n t h e b e n e f i t equation f o r r a i l1 2
t r i p s which became impossible under a policy. This approach i s i n f e r i o r
t o obtaining a d i r e c t measure of b e n e f i t from i n t e g r a t i o n of t h e demand
equation but no simple a n a l y t i c a l expression could be found f o r t h e case
where g e n e r a l i s e d c o s t was i n r a t i o form. Any b i a s should be i n t h e
d i r e c t i o n of overestimating t h e b e n e f i t s of t h e r a i l s e r v i c e , s i n c e t h e
t r u e r e l a t i o n s h i p i s l i k e l y t o be convex r a t h e r than l i n e a r .
Changes i
n
bus user benefits were only calculated for the cases
in
which bus fares were &angad. There would be slight effects from
the assumed peak: service level adjustments in other oases, but in no
case was the change
inbus patronage more
thw3%,
so these would be
small.
All of the policies which changed peak rail operations caused
changes
inthe numbers of oar trips.
The effects of these on other
car
users, by way of
an increase or a reduction in oongestion, was
estimated as follows.
Link
flows on the private vehicle network were
output from the model.
These were used to recalculate link speeds
from
the detailed speed/flow relationships for each link.
*om
these
new speeds, new costs were oaloulated for travelling on each link,
and
by summation over the routes, for each origin/destination pair.
The
change
in oar user benefit was then defined as the difference between
this cost
and the original cost multiplied by the number of oar trips
present both before
and
after the change.*
*
This procedure does not allow any r e d i s t r i b u t i o n of t r i p s because [image:15.599.71.577.12.844.2]F i n a l l y , t h e change i n p e t r o l t a x revenue due t o changes i n
c a r passenger-kilometres was c a l c u l a t e d . To t h e extent t h a t t h i s
t a x i s matched by e x t e r n a l c o s t s ( o t h e r than congestion, which was
evaluated s e p a r a t e l y , a s described above), t h i s w i l l a l s o be an
over-statement. One a l s o has t o t a k e i n t o account t h e f a c t t h a t
changes i n public t r a n s p o r t revenue a r e not n e t a d d i t i o n s t o t h e
public purse. To t h e extent t h a t revenue i s d i v e r t e d from taxed
c o m o d i t i e s , t h e r e i s a l o s s of t a x revenue elsewhere. This was
estimated a t 10% of t h e change i n public t r a n s p o r t revenue.
Neither t h e congestion e f f e c t nor t h e change i n p e t r o l t a x was
included i n t h e inter-peak e v a l u a t i o n , s i n c e we did not have information
with which t o f o r e c a s t t h e proportion of t r a f f i c switching modes.
A s i m i l a r problem a r i s e s with bus t r a v e l . Because of a l a c k of knowledge of t h e c r o s s - e l a s t i c i t i e s of b u s - r a i l s u b s t i t u t i o n i n t h e inter-peak
period, two extreme values were worked o u t . The f i r s t with no
b u s - r a i l s u b s t i t u t i o n , t h e second with f u l l s u b s t i t u t i o n , t o give
upper and lower bounds on t h e e f f e c t . Results i n t h e s e cases a r e shown
a s ranges, r a t h e r t h a n s i n g l e values.
Net s o c i a l b e n e f i t i s c a l c u l a t e d a s t h e sum of changes i n r a i l and
bus operators revenue, plus t h e n e t change i n t a x r e c e i p t s , plus t h e
sum of changes i n r a i l , bus and c a r user b e n e f i t l e s s t h e sum of changes
i n r a i l and bus o p e r a t o r s ' c o s t s .
5.
POLICIESTESTED
AND
!CHJZlR EVALUA!CION(a) m
e
s
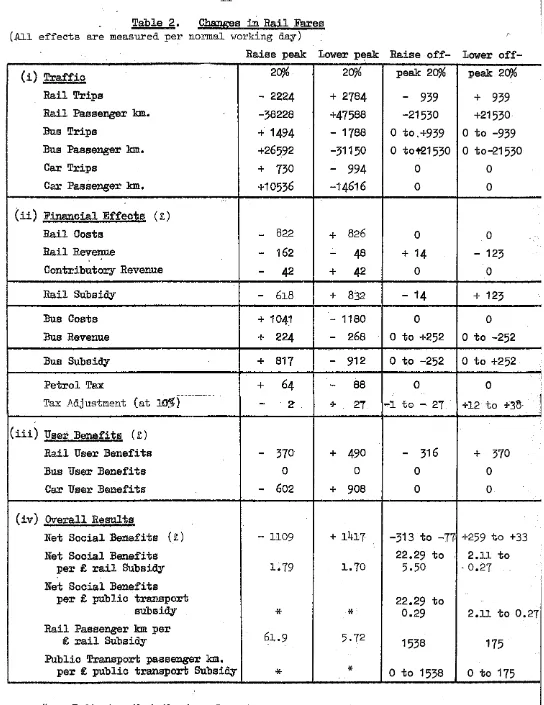
in Rail Fares
The first set of policies exmined involved raising or lowering
I
-
11-
I
Table
2.
C h a m s
in
Rail Fares
(All effects are measured per normal working
day)Raise peak Laver peak Raise off- Lower off-
Rail Passenger
km.
Bus Passenger km.
Rail Costs
Rail Revenue
Petrol Tax
Rail User Benefits
Bus User Benefits
(iv) Overall Results
Net Social Benefita
( E )Net Social Benefits
per
Erail Subsidy
Net Social Benefits
per
%.public transport
Rail Passenger
km
per
e
rail Subsidy
Public l'ransport passenger
bm. [image:17.595.52.596.34.739.2]Changes
inpeak rail fares have a considerable impact on cost when
train lengths are adjusted, although this is more than offset by changes
i
n
bus operating costs.
Browd
two-thirds of the traffic diverts to
or
from bus, which has a higher marginal peak operating cost per
passenger kilometre.
The remaining traffic diverts to/from car,
involving considerable changes
incar user benefit through the effect
on
congestion.
(The WYTCONSUIIP Home Interview
survey found that
42%
of journeys to work by rail were made by persons with
a
car available
1for that journey).
I Overall, lower peak r a i l f a r e s involve n e t s o c i a l b e n e f i t s of
1
around £1.70 per
E
subsidy (and v i c e v e r s a ) ; changes i n peak r a i l faresgain o r l o s e around 50-60 passenger kilometres p e r £ subsidy, so t h a t
n e t s o c i a l b e n e f i t p e r passenger kilometre i s around 3p.
Turning t o off-peak f a r e s , r a i s i n g t h e s e involves l o s s e s of
passenger kilometres and net s o c i a l b e n e f i t per 2 subsidy saved.
Lowering off-peak f a r e s would produce n e t s o c i a l b e n e f i t s , although
t h e s e would be i n s i g n i f i c a n t i f t h e extreme case h e l d t h a t a l l t h e t r a f f i c a t t r a c t e d was d i v e r t e d from bus, but no reductions i n bus
s e r v i c e l e v e l s followed. If most t r a f f i c were new t o public t r a n s p o r t , t h e n e t b e n e f i t p e r
E
subsidy would be s i m i l a r f o r lowering off-peako r peak r a i l f a r e s .
The question must arise as to whether the benefits of cutting
peak rail fares are predomhantly the result of bus fares for commuters
being too low, due to the existence of the 'Metrocard' which substantially
undercuts rail fares for longer journeys.
The next set of options
examines this issue.
(b) cbames involvim Metrocard
Three options m e
considered here.
The first is to abolish
metrocard
inthe peak altogether; the second to permit its use on
rail at no extra
chargeand
the third to retain it, and raise both
Rail Passenger
km.
Bus Passenger
km.
Rail Revenue
Rail User Benefits
Bus User Benefits
(iv) Overall Results
Net Social Benefits
(£1
Bet Social Benefits
per
%,rail Subsidy
Rail Passenger km per
%rail Subsidy
-
Both t h e f i r s t options involve a r i s e i n t h e r a i l subsidy; t h e
f i r s t , because t h e cost of c a t e r i n g f o r a d d i t i o n a l peak t r a f f i c exceeds
t h e i n c r e a s e i n revenue; t h e second, a very much g r e a t e r i n c r e a s e s i n c e
t h e r e i s a l o s s of revenue. This i s more t h a n o f f s e t by u s e r b e n e f i t s
and a reduction i n bus operating c o s t s , however, t o l e a v e very much g r e a t e r
n e t s o c i a l b e n e f i t f o r t h e p o l i c y of allowing metrocard on r a i l t h a n f o r
i t s a b o l i t i o n . By c o n t r a s t , r e t a i n i n g metrocard and r a i s i n g both bus
and r a i l f a r e s involves a l o s s of n e t b e n e f i t s , although a s u b s t a n t i a l
reduction i n p u b l i c t r a n s p o r t subsidy. The r i s e i n bus passenger km. under t h i s p o l i c y a r i s e s because some longer t r i p s t r a n s f e r from r a i l a s t h e
absolute d i f f e r e n c e i n f a r e s i n c r e a s e s . On t h e o t h e r hand t h e r e i s a
t r a n s f e r of s h o r t e r t r i p s from bus t o c a r reducing t h e t o t a l number of
bus t r i p s .
( c ) Changes i n R a i l Service Frequencies
ye were hampered i n t h i s p a r t of our work by t h e l a c k of evidence
on r a i l frequency e l a s t i c i t y . The only major change i n West Yorkshire
i n t h e period under consideration was a 33% i n c r e a s e i n s e r v i c e on one
high frequency r o u t e . Unfortunately, t h i s came i n a t a time of t r a f f i c
r e c e s s i o n , but may have l e d t o t h e s t a b i l i s a t i o n of t r a f f i c on t h i s
r o u t e , w h i l s t elsewhere t r a f f i c f e l l by some 10%. More r e c e n t l y a low
frequency r o u t e has experienceda more than doubling of frequency, r a i s i n g
t r a f f i c l e v e l s by some 80%.
Within t h e peak model, frequencies a r e represented s o l e l y a s changes
i n waiting time, which have a s u b s t a n t i a l impact on mode s p l i t . But
f o r r e l a t i v e l y low frequency s e r v i c e s , t o assume waiting times t o be
h a l f t h e headway may o v e r s t a t e t h e i r s i g n i f i c a n c e .
The changes we considered took two of t h e higher-frequency r o u t e s ;
on one we doubled frequency from
4
t o8
per hour e i t h e r f o r t h e peak o r all-day; on t h e second, we reduced frequencies by one t h i r d from 3 t o 2f o r t h e peak o r a l l day. I n t h e former case, t h e i n c r e a s e i n frequency
would have s t r a i n e d l i n e c a p a c i t y t o i t s l i m i t s and might t h e r e f o r e
have imposed c e r t a i n a d d i t i o n a l t r a c k and s i g n a l l i n g c o s t s not evaluated
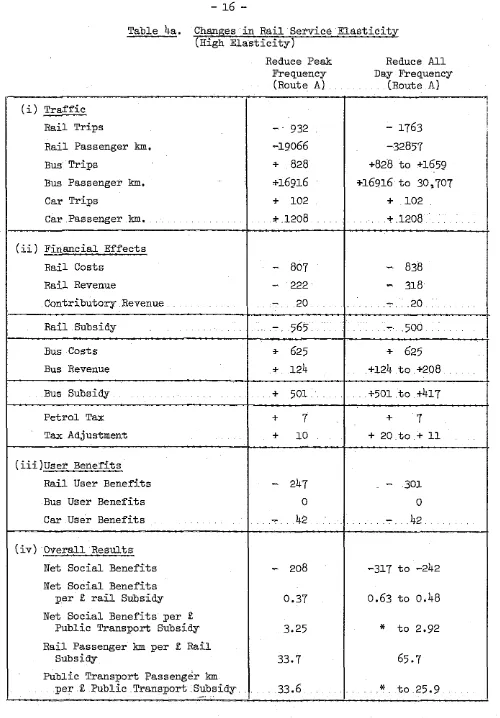
here. The implied frequency e l a s t i c i t i e s were 0.25 f o r t h e frequency
i n c r e a s e but n e a r l y 3 f o r t h e decrease. The l a t t e r r e s u l t seemed g r o s s l y
exaggerated, and we t h e r e f o r e a d j u s t e d t h e waiting time algorithm t o
produce an e l a s t i c i t y of 0.4. These r e s u l t s a r e shown i n Table
4;
(i) !l'raffio R a i l Trips
Rail F'asaenger
km.
Bus Trips
Bus Passenger
km.
Car
TripsI Cknge.8 in Rail Service Ereauenq
(Low
~lasticit~)
1
Reduce Peak Reduce A l l Double Peak Double A l l b q u e n c y Day Ereqwncy Erequency Frequency
I
(Route A ) (Haute A ) (Houte B] d JC a z Passenger km.
+
746
1
+
746
-1 846I I
(ii) Finaacial Effects Rail Costs
R a i l Rwenue
, .
Bus Revenue
Bus
Subsidy+
108Petrol Tax +
4
Tax
Adjustment
h i ) User Benefits
Rail User Benefits
-
32
Bus User Benefits 0 0 0 0
Cas
User Benefits-
4-
4
+
766
+
166( i v )
Overall Results Net Social BenefitsNet Social Benefits per £ r a i l Subsidy
Net Social Benefits per % public transport
subsidy
++
Y0.09
I
*
R a i l Passenger
km
perE r a i l Subsidy
1
5.49
1
11.76
/
17.08
1
16.411
Public Trmspoxt passenger
km.
per £ public transport; Subsidy
2-00
.96
to9.34
8.74
.6.33
to9.86
i
Table ha. Changes i n R a i l Service E l a s t i c i t y (High E l a s t i c i t y )
Reduce Peak Frequency
(Route
A)
Reduce A l l
Day Frequency (Route
A)
( i ) T r a f f i c Rail T r i p s
R a i l Passenger km.
Bus Trips
Bus Passenger km.
Car Trips
Car Passenger km.
(ii) F i n a n c i a l E f f e c t s
Rail Costs
R a i l Revenue
Contributory Revenue
-
R a i l Subsidy
Bus Costs
Bus Revenue
-
Bus SuGsidy
P e t r o l Tax
Tax Adjustment
( i i i ) u s e r Benefits
R a i l User Benefits
Bus User Benefits
Car User Benefits
( i v ) Overall R e s u l t s
Net S o c i a l Benefits
Net S o c i a l B e n e f i t s p e r £ r a i l Subsidy
Net S o c i a l Benefits p e r £ Public Transport Subsidy
R a i l Passenger km per £ R a i l Subsidy
Public Transport passenger km
p e r
E
P u b l i c T r a n s p o r t .Subsidy.~ -
-. .
- ~-
*
I n d i c a t e s t h a t t h e two elements move i n opposite d i r e c t i o n s . [image:22.599.57.557.54.772.2]The r e s u l t s show t h a t , on t h i s type of s e r v i c e , peak frequencies
i n excess o f t h o s e needed t o handle t h e t r a f f i c involve a d d i t i o n a l
c o s t s g r e a t l y i n excess of t h e revenue generated. The e f f e c t on n e t
s o c i a l b e n e f i t depends on t h e frequency e l a s t i c i t y , but t h i s would
have t o be very l a r g e t o j u s t i f y maintenance of frequencies on r o u t e A;
t h e i n c r e a s e on r o u t e B appears e a s i e r t o j u s t i f y . The off-peak
frequency adjustments have r e l a t i v e l y small a f f e c t s ; and t h e decision i s
marginal. However, even where t h e r e a r e b e n e f i t s from holding up o r
increasing peak frequencies,
it
appears l i k e l y t h a t t h e a d d i t i o n a lnet b e n e f i t s
or
passenger lan. p e r C of s u b s i w i s w e l l below t h a t f o r f a r e s adjustments. Thus t h e s o c i a l b e n e f i t o r passenger km. maximising operator w i l l reduce peak frequencies t o t h e minimum necessary t o c a t e rf o r t h e t r a f f i c , and use t h e savings t o reduce f a r e s .
( d )
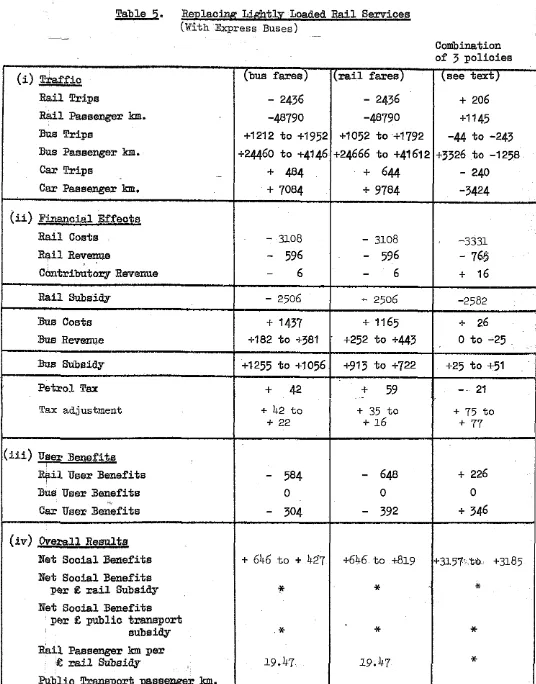
Replacinff L i g h t l y Loaded Services with Express Bus Services
The most l i g h t l y loaded r o u t e s were s e l e c t e d f o r replacement byexpress bus s e r v i c e s , which were t e s t e d on t h e b a s i s of e i t h e r standard
bus f a r e s ( i . e . with metrocard) o r t h e much higher r a i l f a r e s . The
r o u t e s i n question c a r r y a t o t a l of 1,696 peak and 740 off-peak r a i l
t r i p s . A t bus f a r e s , a l i t t l e over a quarter of t h e peak t r i p s d i v e r t
t o c a r , t h e remainder using t h e express bus s e r v i c e . I f r a i l f a r e s
applied, t h e proportion d i v e r t i n g t o c a r i s over a t h i r d . For t h e
off-peak, a range of values corresponding t o 0 t o 100% d i v e r s i o n t o
bus was evaluated. The l o s s e s of b e n e f i t s , both t o r a i l u s e r s and c a r
u s e r s , a r e s u b s t a n t i a l . But t h e c o s t savings g r e a t l y outweigh t h e s e
b e n e f i t l o s s e s , and t h e passenger kilometres l o s t p e r £ subsidy saved
a r e f a i r l y low. Even if t h e peak diversion t o c a r were double t h a t
p r e d i c t e d , o r if s u b s t a n t i a l numbers of peak t r i p s ceased t o be made
a t a l l , t h e s e c l o s u r e s would show net s o c i a l b e n e f i t s , and t h e l o s s
of passenger kilometres p e r £ subsidy saved would be l e s s t h a n f o r
p r i c e increases.
As a final option, we tested the combined effects of lowering
i
rail fares by
2%all day, reducing frequencies on one route as described
above and replacing three routes by express buses operating at rail fares.
The results are not quite additive, due to interactive effects, but there
are no surprises.
As expected, these measures succeed in achieving
major reductions in the cost of the public transport system with no
-
net loss of benefit or traffic.
The benefits could either be taken
as reduced support requirements, or used to reduce public transport
Table
5.
Realacing Li&tLy Loaded Rail Services
(With .Express Buses)I
--
Combination
of
3
policies
&il Passenger
km.
Eus Passenger l
a
.
Tax adjustment
Bus User Benefits
( i v )
Overall BeFnrlta
Net Social Benefits
Net Social Benefits
pQr
&?rail Subsidy
Net Social Benefits
per
%public tramport
Rail Passenger
km
pex
%:rail Subsidy
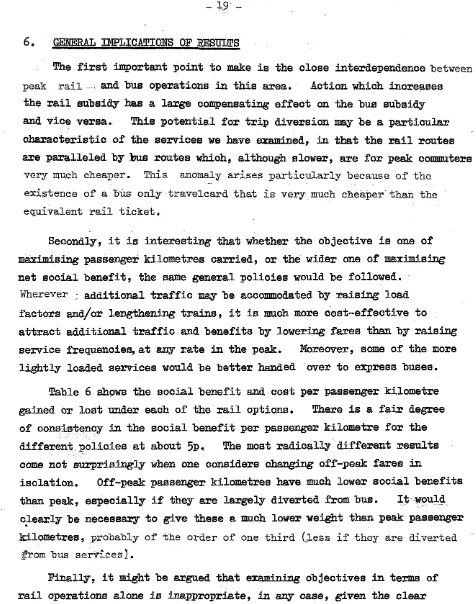
[image:24.599.59.595.59.743.2]6.
GENERBL
IMPLIC~IONS
OF
msms
The first important point to make is the close interdependence between
peak rail
and
bus operations
in this area.
Action which increases
the rail subsidy has a large compensating effect on the bus subsidy
and vice versa.
This potential for trip diversion may be a particular
characteristic of the services
wehave examined, in that the rail routes
are
paralleled by bus routes which, although slower, are for peak commuters
very much cheaper. This anomaly arises particularly because
ofthe
existence
ofa Bus only travelcard that is very much cheaper than the
equivalent rail ticket.
Secondly, it is interesting that whether the objective is one of
maximising passenger kilometres carried,
or
the wider one of maximising
net social benefit, the same general policies would be followed.
Wherever
:additional traffic
may
be accommodated by raising load
factors and/or lengthening trains, it is much more cost-effective to
attract additional traffic
and
benefits by lowering fares than by raising
service frequencies,at
any
rate
inthe peak.
Moreover, some of the more
lightly loaded services would be better handed over to express buses.
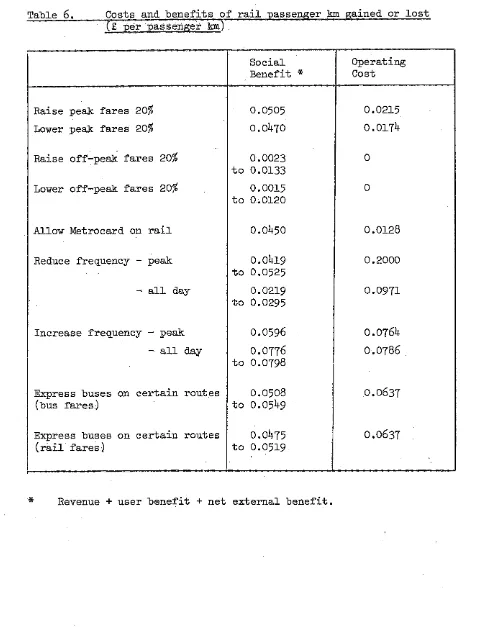
Table
6
shows the social benefit and cost per passenger kilometre
gained or lost under each of the rail options.
There is a fair degree
of consistency
inthe social benefit per passenger kilometre for the
different policies at about 5p.
The most radically different results
come not surprisingly when one considers changing off-peak fares
in
isolation.
Off-peak passenger kilometres have much lower social benefits
than peak, especially if they are largely diverted from bus.
It would
clearly be necessary to give these
a
much lower weight than peak passewr
kilometres,
probably
ofthe order of one third (.less
ifthey are diverted
yrom bus services).
Finally, it might be argued that w i n g
objectives in terms of
rail operations alone is inappropriate,
i
n
any case, given the clear
case for co-ordinating public transport fares
and services through the
existence of the P.T.E.
Tables 2-5 also show net benefit per
6,of
[image:25.602.70.546.53.657.2]Table
6.
Costs and b e n e f i t s of r a i l passenger km gained o r l o s t(E
per passenger la)*
Revenue+
u s e r b e n e f i t + n e t e x t e r n a l b e n e f i t . Raise peak f a r e s 20%Lower peak f a r e s 20%
Raise ~ f f - ~ e a k f a r e s 20%
Lower off-peak f a r e s 20%
Allow Metrocard on r a i l
Reduce frequency
-
peakIncrease frequency
-
peakExpress buses on c e r t a i n r o u t e s (bus f a r e s %
Express buses on c e r t a i n r o u t e s ( r a i l fares:)
~~ - ~
0.0508 t o 0.0549
!
0.0475 t o 0.0519
0.0637
[image:26.595.60.549.86.713.2]7.
COMPARISONS
W
m
RESUmS
FOR
OTHER SERVIGES
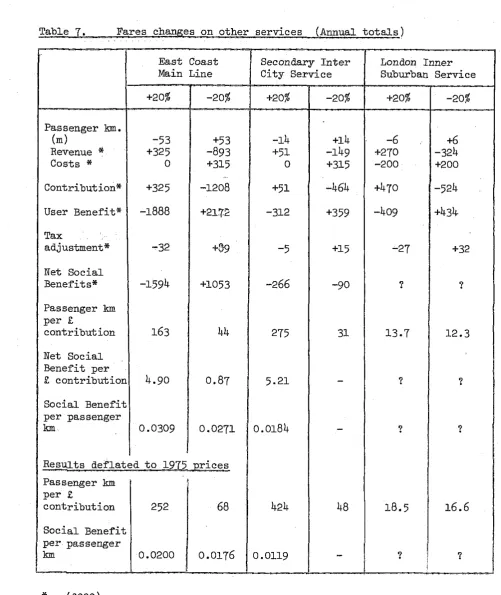
No such detailed amlysis was possible for inter-city or London
suburban services because of data limitations.
However, the effects
on revenue
anduser benefits of raising or lowering fares was calculated
for t;hree types of service
-
a prime East Coast Main Line service, a
secondary intercity service and a London suburban service.
Results
a r e shown i n Table 7. Fares e l a s t i c i t i e s were taken t o be '3.7 f o r t k e
i n t e r - c i t y s e r v i c e s and 0.3 f o r t h e London suburban s e r v i c e . Revenue
and c o s t d a t a f o r t h e s e r v i c e s was supplied by BR; passenger kilometres
were estimated on t h e b a s i s of t h e mean f a r e p a i d p e r passenger
kilometre i n 1977 f o r t h a t s e r v i c e .
For t h e two i n t e r - c i t y s e r v i c e s , it was assumed t h a t t h e l o s s of
t r a f f i c due t o a 20% f a r e s i n c r e a s e would l e a d t o no r e d u c t i o n s i n
s e r v i c e s , and t h e r e f o r e no c o s t savings. Where f a r e s were reduced,
however, t h i s could put p r e s s u r e on peak l o a d f a c t o r s , and allowance
has been made f o r one a d d i t i o n a l s e r v i c e i n each d i r e c t i o n p e r day. No
increase i n t r a f f i c has been assumed a s a r e s u l t of this enhanced s e r v i c e .
This was costed on t h e b a s i s of a n o t i o n a l c o s t p e r t r a i n kilometre f o r
t h e type of s t o c k involved; no changes i n terminals o r t r a c k and
s i g n a l l i n g c o s t s have been assumed. On t h e London suburban s e r v i c e ,
which i s a high frequency s e r v i c e geared towards peak volumes, it w a s
assumed t h a t frequencies, and t h e r e f o r e t r a i n s e r v i c e c o s t s , would be
a d j u s t e d i n proportion t o changes i n volume.
I n comparing r e s u l t s with t h o s e given e a r l i e r , it i s n e c e s s a r y t o
t a k e account of t h e f a c t t h a t t h e s e r e s u l t s a r e i n 1977 p r i c e s ; t h u s ,
t h e y have been d e f l a t e d by 35.2% t o allow f o r t h e p r i c e i n c r e a s e s i n c e
1975.
The r e s u l t s again a r e unsurprising. Whilst day-long changes i n
f a r e s a f f o r d l o s s e s o r g a i n s of 70
-
100 passenger h./£ subsidy on t h el o c a l network, t h e f i g u r e f o r London and t h e South East i s only
16
-
20. That f o r i n t e r - c i t y i s much higher than b o t h a s long a s s e r v i c e l e v e l sa r e held constant; however, i f i n c r e a s e s o r decreases i n s e r v i c e l e v e l s
r e s u l t from t h e change i n t r a f f i c , t h e f i g u r e f a l l s t o
68
i n t h e c a s eof t h e prime i n t e r - c i t y r o u t e and a much lower f i g u r e of
48
f o r t h e secondary s e r v i c e where c o s t s a r e higher r e l a t i v e t o revenue. I n o t h e rwords, a r i s e i n t h e g e n e r a l - l e v e l of Inner Suburban f a r e s i n London
could generate four times a s many passenger kilometres a s those l o s t i f
devoted t o lowering f a r e s on l o c a l p r o v i n c i a l s e r v i c e s and t h r e e times
Table
7.
Fares Changes on o t h e r s e r v i c e s (Annual t o t a l s )Contribution
c o n t r i b u t i o n
Social Benef
c o n t r i b u t i o n
[image:28.599.52.554.58.654.2]I f we assume that t h e r e a r e no e x t e r n a l b e n e f i t s from i n t e r - c i t y passenger km. we f i n d t h e value of s o c i a l b e n e f i t p e r passenger km. t o be very much lower t h a n t h a t f o r peak l o c a l p r o v i n c i a l s e r v i c e s , but
s i m i l a r t o
-
o r higher than-
t h a t f o r off-peak. It h a s not been p o s s i b l et o e s t i m a t e t h e e x t e r n a l b e n e f i t s of London Inner Suburban s e r v i c e s i n
t h i s study, but t h e y would need t o t o t a l some 4p p e r passenger km. t o
j u s t i f y f a i l i n g t o r a i s e f a r e s on t h e s e s e r v i c e s r e l a t i v e t o t h o s e on
t h e primary i n t e r - c i t y r o u t e and perhaps 12p t o j u s t i f y not r a i s i n g
t h e s e f a r e s r e l a t i v e t o peak l o c a l p r o v i n c i a l . -
We have not examined changes i n frequency i n any d e t a i l f o r t h e s e
s e c t o r s , s i n c e t h e i s s u e of t r a f l i n g off frequency a g a i n s t t r a i n l e n g t h
i s l e s s r e l e v a n t . However, f o r primary i n t e r - c i t y s e r v i c e s , it i s c l e a r
t h a t even a low e l a s t i c i t y could j u s t i f y frequency improvements. For
i n s t a n c e , one a d d i t i o n a l s e r v i c e each way per day adds about 8% t o
frequency and c o s t s about £315,000 p.a. With an e l a s t i c i t y of 0.3, t h i s
would add 9,089,000 passenger km. on t h e primary r o u t e and 2,437,000 on t h e secondary route. In t h e former c a s e , t h e r e would be a gain of 126
passenger km. per £ reduction i n c o n t r i b u t i o n ; in t h e l a t t e r , 8.9. Obviously, a frequency e l a s t i c i t y o f 0 would give a r e s u l t of zero i n
each case. Thus, f o r t h e former route, even a low e l a s t i c i t y would
j u s t i f y higher frequencies;for t h e l a t t e r , t h e e l a s t i c i t y would need t o
be very high. For t h e former s e r v i c e , such an e l a s t i c i t y would g r e a t l y
enhance t h e case f o r f a r e c u t s .
8. CONCLUSIONS
The r e s u l t s suggest t h a t , f o r t h e l o c a l s e r v i c e s examine, a p o l i c y
of keeping peak frequencies t o t h e minimum necessary t o cope with t h e
t r a f f i c , and of r e p l a c i n g l i g h t l y used s e r v i c e s with express buses, i n
order t o hold down f a r e s w i t h i n a given budget c o n s t r a i n t , would be
adopted by e i t h e r a passenger-miles o r a n e t s o c i a l b e n e f i t ( a s
conventionally defined) maximiser. I n most c a s e s , passenger miles
maximisation appears t o give a good approximation t o s o c i a l b e n e f i t
maximisation. I n t h e r e l a t i v e treatment of peak and off-peak r a i l f a r e s ,
however, t h e two o b j e c t i v e s d i f f e r . Passenger miles maximisation, a s
off-peak t r a f f i c which y i e l d s low e x t e r n a l b e n e f i t s . This might be
counteracted by giving such passenger miles a weight o f , say, one-third
t h a t of peak passenger kilometres.
I n terms o f comparing f a r e s on t h e l o c a l s e r v i c e s with t h o s e on t h e
i n t e r - c i t y and London suburban s e r v i c e s considered, it i s more d i f f i c u l t
t o draw conclusions because of l a c k of d a t a on c r o s s - e l a s t i c i t i e s and
e x t e r n a l b e n e f i t s . It i s u n l i k e l y t h a t i n t e r - c i t y passenger t r a f f i c
y i e l d s s i g n i f i c a n t e x t e r n a l b e n e f i t s , i n which c a s e t h i s t r a f f i c y i e l d s
n e t b e n e f i t s p e r passenger kilometre of only around a t h i r d t h a t of peak
l o c a l t r a f f i c (although s i m i l a r t o , o r g r e a t e r t h a n , off-peak l o c a l
t r a f f i c ) . On t h e o t h e r hand, w h i l s t holding down f a r e s on t h e London
suburban s e r v i c e s produces f a r fewer passenger km. per
E
t h a n on t h ei n t e r - c i t y o r l o c a l p r o v i n c i a l s e r v i c e , t h i s could be j u s t i f i e d i f major
e x t e r n a l b e n e f i t s , i n terms of reduced congestion and environmental
REFERENCES
BALCOMBE
,
J.
J.
,
D.
J.
RUTHERFORD and D .A. WALMSLEY ( 1973 )A parametric model of i n t e r c i t y passenger t r a n s p o r t : an i n t e r i m r e p o r t . TRRL Report ~ ~ 6 0 7 , Department of t h e Environment,
Crowthorne.
HAETLEY, T.M. (1979a) R a i l passenger s e r v i c e demand d a t a f o r West Yorkshire. Technical Note 19, I n s t i t u t e f o r Transport S t u d i e s , University o f Leeds.
HARTLEY, T.M. (1979b) Aggregate modal s p l i t models
-
r e f i n i n g t h e goodness-of-fit, Technical Note 27, I n s t i t u t e f o r Transport S t u d i e s , University of Leeds.HARTLEY, T.M. and J . D . ORTUZAR (1979) Modal s p l i t models f o r t h e journey t o work i n West Yorkshire by c a r , bus and r a i l : some comments. Technical Note 9 , I n s t i t u t e f o r Transport S t u d i e s , u n i v e r s i t y of Leeds.
HARTLEY, T.M. and J . D . ORTUZAR (1980) Aggregate modal s p l i t models: i s current U.K. p r a c t i c e warranted? T r a f f i c Engineering and Control
-
21 ( I ) , January 1980, 7-13.TFiAVERS MORGAN (1976) BRADFORD BUS STUDY: FINAL REPORT (London)
MOSS, A.J. and G.R. LEAKE (1976) Modal choice t o c e n t r a l a r e a r a i l t e r m i n i
-
preliminary a n a l y s i s . Working Paper 86, I n s t i t u t e f o r Transport S t u d i e s , University of Leeds,ORTUZAR, J . D . (1979a) Car ownership v/s car a v a i l a b i l i t y d a t a .
Technical Note 25, I n s t i t u t e f o r Transport S t u d i e s , University of Leeds.
This work was carried out under a grant from the Social
Science Research Council, using data generously provided by
West Yorkshire Metropolitan County Council and by British
Rail. We wish to express our gratitude to the latter bodies,
and to West Yorkshire
P.T.E.,
for advice and discussion ofresults. Nevertheless, none of these bodies necessarily
accepts our conclusions (indeed, in some cases they strongly
reject them), which are solely our own responsibility.
We are very grateful to Juan de Dios Ortuzar for advice
and assistance with the computational aspects of the work.
Finally Diane Petch deserves praise for producing a
APPENDIX
The Alloca$ion of Trips Between
Table
Al.
!hipAllocation Between Local Semioea
in
A.M.
Peak
7
JC&@ON
LFEDS
.--
Model Link
-
Route
- -
Trains Cars Capacity Traffic Share*
2300-237
3
Goole
2/0
117/0
0.35/0.00
Castleford
2/2
137/137
0.08/0.23
Sheffield (~snnsle~)
2/3
137/188
0.28/0.77
Wakefield
K
2/0
117/0
0.29/0.00
2300-231
8
Garf
crth
Hull
York
2300-2331
kddersf
ield
2300-2332
Huddersfield
(~irect
OEDewsbuq only)
2300-231
9
&rll (~ireot
from
Selbg
BR&llNFD
F.S.
2309-2308
Keighley
Tlkley
*
-
Note: Where the proportions do not add to
1.0,
it is because
II
Inter-city trains c a m
the remaining traffic.
-.
i
[image:34.605.60.582.59.831.2]Table
A2.
Trip Allocation Between Local and i n t e r c i t y Servicea Peak and I n t e r PeakTO/FROK
m s
LEEDO---.
J.NmRPEAHPEAK
LOCALPEL&
l3X'EBCITY-cAL
INm8 CITY M o d e l L qRoute
T m f f i c Share Traffic Shase Traffic Share e a f f i oShare
2300-231
3
Goole1.00/1 .OO
oh'
I
.00/l .OO
Castleford
1.00/1.00
1.00/1
.OO
o/o
Shef f i e l d
1.00/1 .OO
o/o
o/o
I
.00/l
.oo
o/o
o/o
(B-ley)Walcefield
K
l.00/1 .OO
O/O
?.00/1 .OO
o/o
2300-2304
&amborough1.00/1 .OO
o/o
1.00/1 .OO
fIasrogtite
1.00/1
.OO
o/o
0.95/0.94
0.05/0.06
o/o
A l l
?.OO/I .OO
o/o
0.97/0.97
o.o~/o.o~
2300-231
BullYork All
2300-2327
Skipton2300-2328
I<2300-2330
BradfordManchestex (Halifax) 811