ULTRASONIC MEASUREMENT OF TEXTURE OF CUBIC AND HEXAGONAL MATERIALS
Y. Li, R.B. Thompson, and S. S. Leel Ames Laboratory
Iowa State University Ames, Iowa 50011 INTRODUCTION
In the last decade, ultrasonic techniques have been shown to have considerable promise for the rapid and nondestructive determination of the texture of metal plates [1-3]. In addition, ultrasonics provides texture
information on the bulk of material, instead of a local, near surface region as characterized by the X-ray diffraction technique [4].
Texture, or preferred orientation of grains, is often quantitatively described by the orientation distribution coefficients (ODCs) or W cmn in Roe's notation. The detailed definition of the ODCs can be found in references [5,6]. Briefly, the texture is mathematically described by the "Crystallite Orientation Distribution Function", w(~,'lf,cj>). This function is then expanded as a series of spherical harmonics:
{ {
w(~,'lf,cj>) ==
L L L
WcmnZcmn<~)
e-imwe-in~
(1) E=O m=-C n=-lwhere ~=cos9, 9,'1f,cl> are Euler angles describing the orientation of a particular crystallite with respect to the sample axes, and Z{mn are the generalized
Legendre functions. Although theoretically {can go up to infinity, only W {ron
for {up to 4 are ultrasonically determinable due to the fourth rank nature of the elastic constants.
The presence of texture in a material gives rise to weak anisotropy which can be described in term of the ODCs. The rolled plates in general possesses orthotropic symmetry. The nine elastic constants of plates of this symmetry are related to the ODCs and the elastic constants of single crystals. The relations have been published in reference [7] for cubic materials and developed by Sayers in reference [8] for hexagonal materials for the Voigt averaging scheme.
Most of current research in application of ultrasonics to texture
characterization has been concentrated on materials with cubic crystallites, typically AI, Cu, and Fe. For cubic materials, W 400, W 420 and W 440 are the
only non-zero and independent ODCs determinable by ultrasonics.
Physically, W 420 and W 440 relate to the tendency of forming two and four ears in the manufacturing processes, and W 400 describes the overall formability[9].
Recently, study has also been extended to hexagonal materials, such as Ti and Zr. There are five ODCs which are non-zero and determinable from ultrasonic techniques. These ODCs are W2oo. W220. W4oo. W420. and W44o. The physical nature of how these ODCs relate to the tendency of earring and to the overall formability of hexagonal plates has not been as clearly understood as for cubic materials.
ORIGINAL TECHNIQUE
A commonly used ultrasonic technique for texture characterization uses SHo and So waves [10, 11]. Thompson et al [11] showed that for a textured plate, SHo and So wave velocities vary with the angle of propagation with respect to rolling direction. Typically, the velocities of So and SHo waves are measured at 0°, 45°, and 90° using EMATs (electro-magnetic acoustic transducers) either through relative or absolute measurements. Reference [11] discusses the advantages and disadvantages of these two measurement methods. Generally speaking, to determine W 420 and W 440• relative
measurements are preferred; to determine W 400• absolute measurements should be used .. The equations from which the ODCs are calculated can also be found in reference [11].
Using this original technique, W 440 can be determined from angular variations of either SHo or So wave velocities with generally good agreement between the two. W 420 can be determined from angular variation of So wave velocity. However, W 400 must be determined from absolute measurements of So or SHo wave velocities, hence the errors associated with the estimates are larger compared to those ofW420 and W440· A comparison of ultrasonically determined ODCs and those from diffraction techniques can be found in [11].
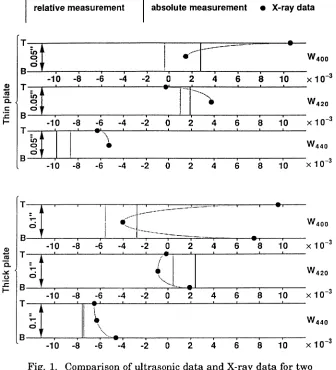
The original technique works satisfactorily overall, except for W 400 on AI plates. Estimations from ultrasonics on W 400 for AI plates are sometimes inconsistent with those from independent diffraction techniques. It has been speculated that the discrepancy is partially due to the presence of second phase and non purity of AI samples. To test the validity of this speculation, we obtained two high purity AI (99.99%) plate samples from ALCOA. The
thicknesses of the two plates are 0.05 and 0.1 inches. For the thin plate, X-ray data were taken on top and middle planes; and for the thick plate, X-ray data were taken on top, middle, and bottom planes [12]. Fig. 1 shows the
comparison of X-ray and ultrasonic data. It can be seen that there is generally good agreement between the two techniques. In particular, the W 400 estimates from absolute measurements fall within the X-ray limits for both plates. This is a significant improvement compared to the situation for commercial AI plates. Note that the W4oo estimates from relative
measurements are not meaningful; they are here only for completeness. The estimates for W 420 from relative measurements are also excellent, being within the X-ray bounds for both plates. Although the estimates for W 440 from relative measurements are not within the X-ray predictions, the agreement is still considered very good.
LAME
MODE TECHNIQUES.! as
'ii
c
:c
1-G)
-
as'ii
.:.:
.~ .c
1-I
relative measurementI
absolute measurement • X-ray data)t
I
.
-,---·
:
•
W4ooI I I I I I I I I I
X 10-3
-10 -8 -6 -4 -2 0 2 4 6 8 10
)t
I I ' I I••
n~:
I I IW42o
I I I I I I I I I
X 10-3
-10 -8 -6 -4 -2 0 2 4 6 8 10
)I
:I
I
">
: : : : : : : :
W44o-10 -8 -6 -4 -2 0 2 4 6 8 10 x 1
o-
3>t
':
:I
~h--:_-:-
:
.:
·:
W4oo
x 1
o-
3-10 -8 -6 -4 -2 0 2 4 6 8 10
>t
: : : :
: (l]
:
'
: :
W42o-10 -8 -6 -4 -2 0 2 4 6 8 10 x 1
o-
3>I
:
:1\.
'
: : : : : :
W44o-10 -8 -6 -4 -2 0 2 4 6 8 10 X 10-3
Fig. 1. Comparison of ultrasonic data and X-ray data for two pure Al samples (T -- top surface, B -- bottom surface).
propagating at 45° with respect to plate normal but with different polarization directions. The SH1 mode has a polarization direction parallel to the surface ofthe plate and the So mode has a polarization direction parallel to the sagittal plane. For anisotropic plates, the dispersion curves for the two modes may cross over or split at the Lame point as illustrated in Fig. 2b. The amount of crossing over and splitting is related to the texture parameters (ODCs). An equation developed from perturbation analysis of Lame modes for weakly anisotropic plates is given below. This equation gives the separation in wave number between the SH1 and So modes at the corresponding frequency of the isotropic Lame point [14].
K1t2C _1- _1- _1_
8K= 35T (25-v 2W 400 - 4-v 5 W 420cos2a.
+
6-v 3 5W 440cos4a.) (2) [image:3.482.74.410.38.408.2]2.0
1.5
-0.5
/
/ / /
;: '
,.,,'
/
/ / /
,_,·-'_,,--'___ So MODE
//
~:--=-=~: ;~~ ~~~~
0.0 L-'-~~_.._...._;~-'--'--!.-J..-'-~ ~ K 0.0 0.5 1.0 1.5 2.0 ll
(a)
w~/-JCr---~
11 C662.0
1.5 1.5
-0.5 So MODE
---
SH1 MODE---~K 0.0
0.0 0.5 1.0 1.5 2.0 ll 0.0 0.5 1.0
(b)
Fig. 2. Dispersion curves at Lame point. (a) isotropic plates; (b) weakly anisotropic plates.
So MODE SH1 MODE
1.5 2.0 ~K ll
To generate waves at the Lame point, a special set ofEMATs have been made. The new SH1 and So EMATs have a common period of 5 mm, designed to operate at the Lame point for a 2.5 mm thick plate. The new So EMATs excite the surface particles of the plate to move vertically instead of
horizontally as the So EMA T.s for the original technique do. This is primarily due to the low transmission efficiency if the So EMATs for the original
technique are used [15].
[image:4.482.51.434.26.398.2]TEXTURE CHARACTERIZATION OF HEXAGONAL MATERIALS
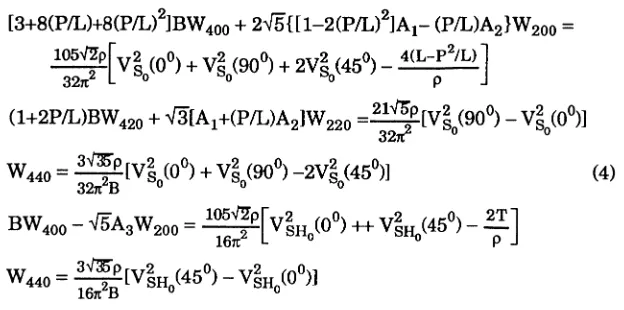
In order to characterize the texture of hexagonal materials, the relations between the elastic constants Cij and the five ODCs must be established first. These relations have been developed and are summarized in Eqs. (3) [8,16]:
C 11= L + 4 x2(4 A1 a.1+ B ~1) C22= L + 4 x2(4 A1 a.2+ B ~2) C33= L + 4
x
2(4 A1 a.3+ B ~3) C 23= P + 4x
2(2 A2 a.1 + B ~4) C 13= P + 4 x2(2 A2 a.2+ B ~5
) C1 2= P + 4 x2(2 A2 a.a+ B ~s)C44= T + 4 x2(Aa a.1+ B ~4) C55
=
T + 4x
2(A3 a.2+ B ~5
)C66
=
T + 4 x2(A3 a.3+ B ~6
)(3)
where L, P, Tare elastic constants for the corresponding isotropic material; A1, A2, Aa, and B are elastic anisotropy constants. These constants are averaging scheme dependent. However, the relation A1+A2+Aa=O exists for all averaging schemes. In Eqs. (3), a.i are functions ofW2oo and W220 only and
~i are functions ofW4oo. W42o. and W440 only.
With the relations in Eq. (3), the equations which associate ODCs and wave speeds on hexagonal plates for the original technique becomes [16]:
2.0 . - - - .
1.5
1.0
-0.5
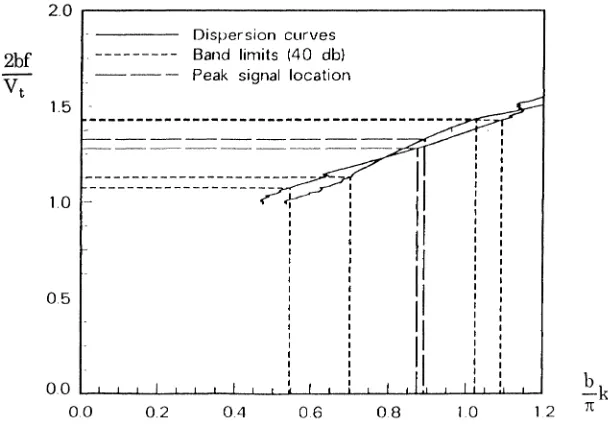
Dispersion curves Band limits (40 db) Peak signal location
0. 0 1.-Jo--L...J...__I.-Jo--L...J...__~__,_..._..._I...I.--L...._.J..-w..J.-"-...L....I
0.0 0.2 0.4 06 08 1.0 1.2
E.k
n: [image:5.482.86.390.360.572.2]It is obvious that the situation for hexagonal materials is more
complicated. The determination of W 440 is still simple, being possible from the angular variation of either So and SHo velocities. However, W 220 and W 420 are coupled together in Eq. (4) and so are W2oo and W4oo Although there are two equations with different coupling ofW2oo and W4oo, solving them
simultaneously is not favored because both equations rely on accurate absolute velocity measurements which are difficult to obtain. Consequently, the
original technique alone does not solve all the ODCs.
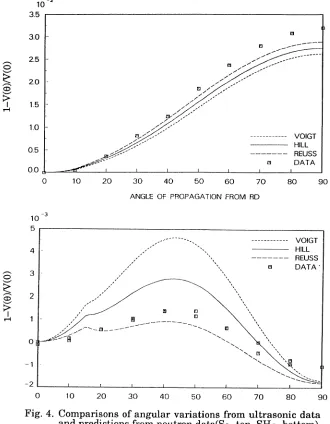
A preliminary experimental study has been done on a Ti plate sample. The velocity variations of SHo and So waves were measured and plotted in Fig. 4. The sample is found for some reason to be inhomogeneous with roughly two distinguished regions. The consequence of the inhomogeneity is that the SHo waves propagating in 0° and 90° do not have same velocity.
Independent neutron diffraction measurements confirmed the inhomogeneity [17]. The angular variations of SHo and So velocities predicted theoretically based on the neutron diffraction results are also included in Fig. 4 for three different averaging schemes. In general, the agreements between ultrasonic measurements and the theoretical predictions are good.
The Lame mode technique can also be applied to hexagonal materials and important additional information can be obtained from this technique. The hexagonal counterpart of Eq. (2), which gives the amount of the
dispersion curve separation in wave number at the frequency of the first point of isotropic tangency is
Kn2 _1-
_1-~K=--[(3'11 OA3W2oo +25'12 BW4oo) + 105T
(6...JT5A3W22o-4...JSBW42o)cos2a + 6...J35BW44ocos4a)] (5)
where ~K is as defined before.
[image:6.482.80.392.28.183.2]..._ 0
-....;
<
..._
<D
-....;
~
,..-(
8
-....;
~
<D
~
,..-(10-2
3.5
3.0
-2.5
-2.0
1.5
-10
0.5
00
0 10 20
10 -J
5
4
3
2
Of
- 1
-2
0 10 20
1!1
30 40 50 60 70
ANGLE OF PROPAGATION FROM RD
30 40 50 60 70
1!1
1!1 1!1
VOIGT HILL REUSS DATA
80 90
VOIGT HILL REUSS DATA"
80 90
Fig. 4. Comparisons of angular variations from ultrasonic data and predictions from neutron data(So--top, SHo--bottom).
CONCLUSIONS
The original ultrasonic technique gives good estimations of ODCs on plates of cubic materials except for W 400 on Al plates. The agreement reported
[image:7.482.67.397.34.458.2]using the Lame mode technique are also presented. Extension of both the original and the Lame mode techniques have also been made to plates of hexagonal materials. Unlike its cubic counterpart, both the original
technique and the Lame mode technique are needed to solve for all five ODCs,
and Wzoo and W4oo can not be completely determined from relative
measurements. Some experimental results from study of an inhomogeneous Ti plate sample are also included here. Good agreements between ultrasonic measurements and theoretical predictions based on neutron diffraction results are observed.
ACKNOWLEDGEMENT
Ames Laboratory is operated for the U. S. Department of Energy by the Iowa State University under contract No. W-7405-Eng-82. This work was supported by the Director for Energy Research, Office of Basic Energy Sciences.
REFERENCES
1. R. B. Thompson, S. S. Lee, and J. F. Smith, J. Acoust. Soc. Am . .8.Q., 921 (1986).
2. R. B. Thompson, S. S. Lee and J. F. Smith, Ultrasonics 2.5_, 133 (1987). 3. A. V. Clark,Jr, R. C. Reno, R. B. Thompson, J. F. Smith, G. V. Blessing,
R. J. Fields, P. P. Delsanto, and R. B. Mignogna, Ultrasonics 22, 189 (1988).
4. J. F. Smith, R. B. Thompson, D. K. Rehbein, T. J. Nagel, P. E.
Armstrong, and D. T. Eash, in Review of Pro~rress in Quantitative NDE,
edited by D. 0. Thompson and D. E. Chimenti (Plenum Press, New York, 1987), Vol. 6B, pp. 1541-1548.
5. R.-J. Roe, J. Appl. Phys. Qfi, 2024 (1965). 6. R.-J. Roe, J. Appl. Phys. 31, 2069 (1966).
7. M. Hirao, K. Aoki, and H. Fukuoka, J. Acoust. Soc. Am .
.81.
1434 (1987). 8. C. M. Sayers, Ultrasonics 24, 289 (1986).9. G. J. Davies, D. J. Goodwill, and J. S. Kallend, Met. Trans .
.3.,
1627 (1972).10. S. S. Lee, J. F. Smith, and R. B. Thompson, in Nondestructive
Characterization of Materials, edited by J. F. Bussiere (Plenum Press, New York, 1987), p.155.
11. R. B. Thompson, J. F. Smith, S. S. Lee, and G. C. Johnson, "A
Comparison of Ultrasonic and X-ray Determinations of Texture in Thin Cu and AI Plates", Met. Trans., in press.
12. S. Panchanadeeswaran and B. Schabel, private communication. 13. Y. Li and R. B. Thompson, in Review of Pro~rress in Quantitative NDE,
edited by D. 0. Thompson and D. E. Chimenti (Plenum Press, New York, 1989), Vol. 8B, pp. 1863-1870.
14. Y. Li and R. B. Thompson, "Ultrasonic Characterization of Texture",in Proceedings for the Symposium on Nondestructive Monitoring of Material Properties. 1988 Fall Meeting of Materials Research Society, in press.
15. R. B. Thompson J. Appl. Phys. 18_, 4942 (1977).
16. Y. Li and R. B. Thompson,"Relations Between Elastic Constants Cij and ODCs for Hexagonal Materials", submitted to J. Appl. Phys.