DEVELOPMENT OF VALUE STREAM MAPPING FOR
PALM OIL COMPANY – A CASE STUDY
MUHAMAD FITRI BIN ABDUL KADIR
B051410200
DEVELOPMENT OF VALUE STREAM MAPPING FOR PALM OIL
COMPANY – A CASE STUDY
This report is submitted in accordance with requirement of the University Teknikal Malaysia Melaka (UTeM) for Bachelor of Manufacturing Engineering (Hons.)
by
MUHAMAD FITRI BIN ABDUL KADIR B051410200
950220-14-5615
Disahkan oleh:
_____________________________ ______________________________ Alamat Tetap: Cop Rasmi:
_____________________________ _____________________________ _____________________________
Tarikh: _______________________ Tarikh: _______________________
*Jika Laporan PSM ini SULIT atau TERHAD, sila lampirkan surat daripada pihak berkuasa/organisasi berkenaan dengan menyatakan sekali sebab dan tempoh laporan PSM ini perlu dikelaskan sebagai SULIT atau TERHAD.
UNIVERSITI TEKNIKAL MALAYSIA MELAKA
BORANG PENGESAHAN STATUS LAPORAN PROJEK SARJANA MUDA
Tajuk: DEVELOPMENT OF VALUE STREAM MAPPING FOR PALM OIL
COMPANY – A CASE STUDY
Sesi Pengajian: 2017/2018 Semester 2
Saya MUHAMAD FITRI BIN ABDUL KADIR (950220-14-5615)
mengaku membenarkan Laporan Projek Sarjana Muda (PSM) ini disimpan di Perpustakaan Universiti Teknikal Malaysia Melaka (UTeM) dengan syarat-syarat kegunaan seperti berikut:
1. Laporan PSM adalah hak milik Universiti Teknikal Malaysia Melaka dan penulis. 2. Perpustakaan Universiti Teknikal Malaysia Melaka dibenarkan membuat salinan
untuk tujuan pengajian sahaja dengan izin penulis.
3. Perpustakaan dibenarkan membuat salinan laporan PSM ini sebagai bahan pertukaran antara institusi pengajian tinggi.
4. *Sila tandakan (√)
(Mengandungi maklumat yang berdarjah keselamatan atau kepentingan Malaysiasebagaimana yang termaktub dalam AKTA RAHSIA RASMI 1972)
(Mengandungi maklumat TERHAD yang telah ditentukan oleh organisasi/ badan di mana penyelidikan dijalankan)
√
SULIT
TERHAD
TIDAK TERHAD
DECLARATION
I hereby, declared this report entitled “Development of Value Stream Mapping for Palm Oil Company – A Case Study” is the results of my own research except as cited in
references.
Signature : ………
Author’s Name : MUHAMAD FITRI BIN ABDUL KADIR
APPROVAL
This report is submitted to the Faculty of Manufacturing Engineering of Universiti Teknikal Malaysia Melaka as a partial fulfilment of the requirement for Bachelor of Manufacturing Engineering (Hons). The member of the supervisory committee is as follow:
………...
i
ABSTRAK
Pada masa kini, dalam bidang pembuatan industri, persaingan semakin sengit di kalangan industri-industri. Untuk meningkatkan pengeluaran dan mempunyai kualiti
produk yang baik tanpa menghasilkan apa-apa pembaziran adalah rumit. Value Stream Mapping (VSM) adalah salah satu kaedah pembuatan cepat yang digunakan untuk mengenalpasti semua aliran proses, maklumat dan data dari bahan mentah hingga selesai menjadi produk dengan baik. Kajian ini adalah mengenai masalah yang berlaku dalam barisan pengeluaran kerana terdapat banyak pembaziran dan sasaran syarikat untuk Produk X tidak tercapai. Ini adalah ilustrasi yang baik untuk menggambarkan Current-State Value
Stream Mapping (CSVSM) untuk mengenal pasti dan mengira tujuh jenis pembaziran dalam proses pengeluaran. Tujuan projek ini adalah untuk mencadangkan Future-State Value Stream Mapping (FSVSM) di Industri X untuk menghapuskan pembaziran di sepanjang barisan pengeluaran Produk X dan mencadangkan idea penambahbaikan. Untuk melakarkan pemetaan VSM, Microsoft Visio 2013 adalah alat terbaik yang boleh
digunakan. Gambar rajah Ishikawa telah digunakan untuk mengenal pasti punca utama masalah pembaziran. Seterusnya, tiga idea penambahbaikan dicadangkan. Sebagai idea, kaedah dan teknik perkilangan terbaik seperti 5S dan Kaizen telah dicadangkan untuk mengurangkan sisa pembaziran yang berlaku dalam proses. Projek ini juga mampu mengurangkan masa bagi setiap process dan masa permulaan proses sehingga habisnya
ii
ABSTRACT
Nowadays, in manufacturing industries field, the competition are more intense. To increase the throughput and have a good quality of product without producing any waste is
quite challenging. Value Stream Mapping (VSM) is one of lean manufacturing tools that used to visualize all the process flow and information from raw material to finished good. This project is regarding the problem that occurs in the production line are lots of waste that affects to company’s target for Product X. It is a good illustration of Current-State Value Stream Mapping (CSVSM) to identify and quantify the seven types of waste in the production line. The purpose of this project is to propose Future-State Value Stream
Mapping (FSVSM) at Company X to eliminate the waste along the Product X production line and recommend the improvement ideas. In order to develop the VSM, Microsoft Visio 2013 is a best tool that can be used. Ishikawa Diagram has been used to identify the root cause of the waste problems. Next, three improvement ideas are proposed. As the ideas, lean manufacturing tools and technique such as 5S and Kaizen have been proposed in order
iii
DEDICATION
I dedicated this to my respected supervisor, PM Ir. Dr. Puvanasvaran A/L A. Perumal for the unwavering guidance, my parents who always supported and helped me during this
iv
ACKNOWLEDGEMENT
In The Name of Allah, The Most Gracious, The Most Merciful, with the highest praise to Allah that I manage to complete this final year project successfully without difficulty.
My respected supervisor, PM Ir. Dr Puvanasvaran A/L A. Perumal for the kindness, unwavering patience and mentorship guided me through the process, his easily understood explanations and open mind allowed me to grow and learn in such a way that I am now a better researcher.
My parents, Abdul Kadir Bin Saad and Salinah Binti Ahmad for continously support from beginning until end. Their support and motivation never stopped any seconds for me.
Last but not least, I would like to give a special thanks to my fellow friends and
v
TABLE OF CONTENT
Abstrak i
Abstract ii
Dedication iii
Aknowledgement iv
Table of Contents v
List of Tables ix
List of Figures x
List of Abbreviations xii
List of Symbols xiii
CHAPTER 1: INTRODUCTION
1.1 Project Background 1
1.2 Industry Background 2
1.3 Problem Statements 2
1.4 Objectives 5
1.5 Scopes of the Project 5
1.6 Significant of the Project 6
1.7 Project Outlines 6
CHAPTER 2: LITERATURE REVIEW
2.1 Introduction to Lean 7
2.2 Lean Manufacturing 8
2.3 Five Key of Lean Manufacturing 8
2.3.1 Value 9
2.3.2 Map the Value Stream 10
2.3.3 Flow Product 10
vi
2.3.5 Striving for Perfection 10
2.4 Seven Type of Waste 11
2.4.1 Overproduction 11
2.4.2 Transportation 12
2.4.3 Inventory 12
2.4.4 Waiting 12
2.4.5 Overprocessing 12
2.4.6 Unnecessary Motion 13
2.4.7 Defects 13
2.5 Sources of Wastes 13
2.6 Lean Tools and Techniques 15
2.6.1 5S 15
2.6.2 Kaizen 15
2.6.3 Andon 16
2.6.4 Line Balancing 16
2.7 Value Stream Mapping 16
2.7.1 Advantages of VSM 18
2.7.2 Limitation of VSM 18
2.7.3 Basic Tool in VSM 18
2.7.3.1 Symbols in VSM 19
2.7.3.2 Steps in developing VSM 21
2.7.4 Fundamental Definition of Time 21
2.7.4.1 Lead Time 22
2.7.4.2 Cycle Time 22
2.7.4.3 Processing Time 23
2.7.4.4 Machining Time 23
2.7.4.5 Takt Time 23
2.7.4.6 Working Time 24
2.8 Time Study Analysis 24
2.9 Application of VSM in Various Company 25
CHAPTER 3: METHODOLOGY
vii
3.2 Flow Chart of Project 32
3.3 Flow Chart of Value Stream Mapping 35
3.4 Methodology of each objective 36
3.4.1 Objective 1 37
3.4.1.1 Interview 37
3.4.1.2 Observation 38
3.4.1.3 Collect and Analyze Data 38
3.4.2 Objective 2 39
3.4.2.1 Data Collection Analysis 39
3.4.2.2 Develop Current-State VSM 40
3.4.2.3 Identify Waste 41
3.4.3 Objective 3 41
3.3.3.1 Waste Analysis and Ishikawa Diagram 42
3.4.3.2 Propose solution and Analysis 43
3.4.2.2 Develop Future-State VSM 43
3.4.2.3 Compare the CSVSM and FSVSM 44
CHAPTER 4: RESULTS AND DISCUSSION
4.1 Introduction 45
4.2 Process Flow of Product X 45
4.2.1 Weighing Station 47
4.2.2 Grading Station 48
4.2.3 Loading Ramp Station 50
4.2.4 Sterilization Station 51
4.2.5 Threshing Station 54
4.2.6 Pressing Station 56
4.2.7 Oil Cleaning Station 57
4.2.8 Bulk Storage Tank (BST) 58
4.3 Current-State Value Stream Mapping 59
4.4 Analysis of Current-State Value Stream Mapping 62
4.4.1 Total Time of Production 62
4.4.2 Identify Waste 63
viii
4.5.1 Ishikawa Analysis and 5 Why’s 65
4.6 Improvement Plan 67
4.6.1 Kaizen Burst Project 1: Improving weighing system 69
4.6.2 Kaizen Burst Project 2: Standardization working 72
4.6.3 5S Project at Oil Room Station 75
4.7 Future-State Value Stream Mapping 76
4.7.1 Comparison Current-State and Future-State VSM 78
CHAPTER 5: CONCLUSION AND RECOMMENDATION
5.1 Conclusion 79
5.2 Sustainability 80
5.3 Recommendation for Further Study 81
ix
LIST OF TABLES
1.1 Palm size plantation 3
1.2 Company X’s production 3
2.1 Manufacturing lean principle versus product development 11
2.2 Sources of waste 13
2.3 Symbols in Value Stream Mapping 19
2.4 Steps in VSM 21
2.5 Application VSM in various company 26
3.1 Methods used for each objectives 36
4.1 Cycle time on weighing station 47
4.2 Grading guidelines 49
4.3 Cycle time on grading station 49
4.4 Cycle time on loading ramp station 51
4.5 Cycle time on sterilization station 52
4.6 Cycle time on threshing station 55
4.7 Cycle time on pressing station 56
4.8 Cycle time on oil room station 57
4.9 Summarize of cycle time 59
4.10 Total time of current-state VSM 62
4.11 Seven type of waste 63
x
LIST OF FIGURES
1.1 Graph production of Product X 3
1.2 Process flow of Product X 4
2.1 Principle of lean manufacturing 9
2.2 Differences between lead time and cycle time 22
2.3 VSM in various industries based on past year studies 30
2.4 VSM in various industries based on sector studies 31
3.1 Flow chart for overall FYP 33
3.2 Flow chart of VSM 35
3.3 Flow chart of objective 1 37
3.4 Flow chart of objective 2 39
3.5 Flow chart of current-state VSM 40
3.6 Flow chart of objective 3 42
3.7 Flow chart of future-state VSM 43
4.1 Process flow of Product X 46
4.2 Weight bridge station 47
4.3 Grading station 48
4.4 Loading ramp station 50
4.5 Sterilization station 51
4.6 Threshing station 54
4.7 Pressing station 56
4.8 Oil room station 57
4.9 Bulk storage tank 58
4.10 Cycle time vs Takt time graph 60
xi
4.12 Percentage of total time 62
4.13 Pareto chart of waste 64
4.14 Ishikawa diagram for inventory waste 65
4.15 Ishikawa diagram for waiting waste 66
4.16 Improvement plan at station 68
4.17 Map before proposed 69
4.18 Map after proposed 70
4.19 Cash flow diagram 71
4.20 Map of sterilization 72
4.21 Tools disorientation 76
4.22 Future-state VSM 77
xii
LIST OF ABBREVIATIONS
VSM - Value Stream Mapping
CSVSM - Current-State Value Stream Mapping
FSVSM - Future-State Value Stream Mapping
CT - Cycle Time
C/O - Change Over
VA - Value Added
xiii
LIST OF SYMBOLS
% - Percentage
MPa - Mega Pascal
GPa - Giga Pascal
°C - Degree Celsius
s - Second
min - Minute
No. - Number
Tobs - Observation Time
PR - Performance Rating
Tn - Normal Time
Avg - Average
Tavg - Average Time
& - And
= - Equal
tan - Tonnes
rpm - Revolution per minute
MT - Metric Tonne
RM - Ringgit Malaysa
1
CHAPTER 1
INTRODUCTION
This introduction chapter provides the background of the project, background of industry, problem statement, objectives, scope and significant of the project.
1.1
Project Background
The manufacturing industry is turning out to be more aggressive and challenge with other companies to expand their proficiency and profitability. The significance of manufacturing is the production of raw materials into completed product which following of customer requests and demands. The waste can be represented by seven types of waste (muda) including overproduction, transportation, waiting, unnecessary motion, inventory,
overprocessing, and rework/defects. It is a key push to build the value added works through the eliminating waste and diminishing coincidental works.
Lean Manufacturing is one of the concept to minimize or eliminates the seven types of waste. Lean manufacturing which known as a set of production techniques that were first devised by the Toyota Motor Corporation in the early 1950’s. There are various tools and techniques that can eliminate these types of waste. There are 5S, Poka Yoke, Andon, Kanban, Line Balancing, Kaizen, Value Stream Mapping and more.
Value Stream Mapping (VSM) is one of a lean tools and techniques that used to break down the flow of materials and information currently which required to bring a
current-2
state value stream mapping will indicates the current process, postponements, and data stream required to deliver the focused product. It needs to assess how waste can be
eliminated from the current-state value stream mapping. Then, by developing the future-state value stream mapping which consists of revised process which waste eliminated and improves the cycle time or lead time. The benefits of using VSM are the strength itself helps to visualize to an organization in identifying and eliminating the waste in the production line. With the VSM, it’s a powerful technique to eliminate waste by identifying and analyzing on the current-state and came out with proposal of future-state mapping.
1.2
Industry Background
Company X was established in 1984 with the cost of RM20 millions. It is located about 50 km from Tanjung Malim and 30 km from Bestari Jaya. This company has a capacity of 54 metric ton/hour and the operation time is 24 hours. The staff was divided
into two shift which are Shift A and Shift B. Most of the staff lives in the residences that were provided by Company X and located about half km from the company. Company X is headed by a manager Mr Ikhwan and three assistant manager engineers whose are Mr Mohamad Faizal and Mr Ahmad Syakir for production and Mr Norul Hisham for maintenance. The main activity of Company X is buying raw material which is Raw Material X from several areas which are Felda Sungai Tengi, Felda Soeharto, Felda Sungai
Tengi Selatan, Felda Gedangsa as internal suppliers and others from the outside as external suppliers to process several products and by-product.
1.3
Problem Statement
Industry nowadays are encountering lots of waste in the production because they are not able to identify it. Company X, as a manufacturing industry also having the same problem as related to the wastes such as overproduction, transportation, waiting,
3
Table 1.1: Palm size plantation
Project Size area (hectar)
Soeharto 3,119.23
Gedangsa 2,732.23
Sg Tengi 2,304.42
Sg Tengi Selatan 363.00
By referring to the Table 1.1, it can see clearly that for internal suppliers are very huge (8,518.88 hectar) for this industry to process all of it. For production industry, it is
[image:21.612.98.530.334.397.2]very important for them to maximize its current production to achieve the demands.
Table 1.2: Company X’s production
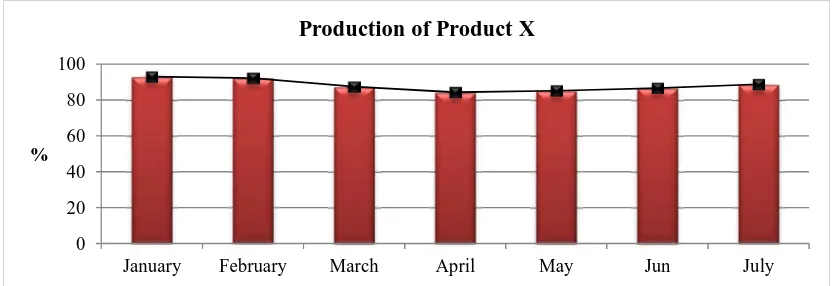
Parameters Target Month 2017
January February March April May Jun July
Product X (%) 100 93 92.22 87.34 84.25 85.17 86.67 88.74
By referring to the Table 1.2, it shows the tabulation of production product X in
percentage over month 2017. It can see clearly that from January to July of product X does not achieved the target as 100%. The production is not a stable production rate. From the data in the table, the next step is convert them into graphically bar chart. Figure 1.1 below is a graph showing the production of Product X against month for year 2017.
Figure 1.1: Graph production of Product X in 2017
0 20 40 60 80 100
January February March April May Jun July
%
[image:21.612.104.521.547.690.2]4
Based on Figure 1.1, we can see clearly that the production of Product X does not achieved as their desired target from January to July and the production is fluctuted. This
[image:22.612.102.523.146.239.2]problem may due to the seven type of waste that might happen in the production line.
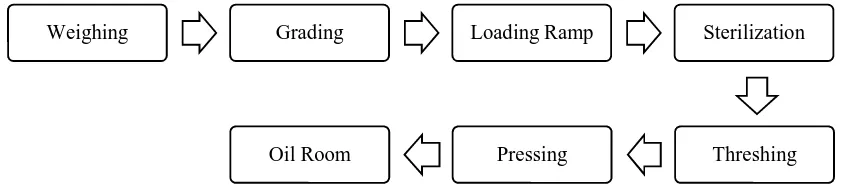
Figure 1.2: Process flow of Product X
According to the Figure 1.2, there are basic process flow of Product X which is from the raw material X. The process starts from Weighing station until Oil Room station where the production of Product X and also removal of water in it. The Product X is categorized as a continuous production line. It flows from the raw materials until the
finished goods. Therefore, there are many factors that may affect to its cycle time and lead time of the production system such as delay, machine breakdown, inventory, waiting and others which leads to waste. In this production system, if there is one process that cannot be complete, it will affect the whole performances of the process.
The main problem in the industry are they cannot visualize the seven types of waste that occurs in production line. It is may due to the production is takes longer time to process. The raw material X should be processed on time because it needs the freshness of raw material to maximize the output Product X. By executing the lean tools and
techniques in the production stream, it is able to identify wastes that effect on increasing cost, time and toward satisfy the customer demand. VSM is powerful tools to visualize all the seven type of waste that happen in the production line and better understanding. Thus, the aim for the project is to develop the current-state VSM to visualize the waste on each of workstation and time taken to complete task. Next, the aim is to eliminate or minimize the wastes in the production line to increase the production. VSM is often used to prove
current-state manufacturing process for creating better future-state process. It is important for company to improve their business and satisfies the customer demands.
Weighing Grading Loading Ramp Sterilization
5
It can be concluded that, VSM is one of the great technique that can be used to eliminate the seven type of waste. By mapping the current-state, it can come out of the
future-state VSM by revising the current-state VSM with the solution to eliminate seven type of waste on production of Product X.
1.4
Objectives
The main objectives using VSM is to eliminate seven type of waste on the production line. Thus, this project is aim to achieve the following objectives in order to increase the productivity:
(a) To visualize the current process flow for overall production.
(b) To construct the current-state value stream mapping for case study company.
(c) To propose the future-state value stream mapping with the solution to eliminate the waste.
1.5
Scopes of the Project
This project focused one of the high demand product which is Product X in Company X. This product has been selected to be observed and analyzed of the current performance. This study is conducted by using the specific tools which is Value Stream Mapping (VSM) from the first workstation process until the Product X production finished.
This project is aim for development of value stream mapping for Product X. It is one of tools to improve the production and performance of the company. This project is to determine and minimize the waste in production line by analyzing the current-state value stream mapping. Then, to improve the productivity rate via proposing the future value stream mapping with the solution to eliminate the seven type of waste. The VSM is
6
also include identifying the Lean Manufacturing practices that can be implemented by the industry.
1.6
Significant of the Project
This project is important to industry which it gives lot of benefits. One of it is the industry able to identify all the waste in production line. All the waste can eliminated and the productivity could be increase. Furthermore, it can also reduce both cycle time and lead
time of the process which may gives lots of benefits to the industry. Lastly, it also creates the role of responsibility and motivates all the workers and organization which focus to make a cultural improvement of doing their works.
1.7
Project Outlines
The organization of this project is as following, Chapter 1 is begin with project
background, company background, problem statement, objectives, scope of the project, and significant of this project for development the value stream mapping for palm oil company – a case study in Company X addressed.Chapters 2 are literature review that comprises previous study or research about the lean manufacturing and VSM in various company of manufacturing industry. Chapter 3 is a methodology that describes all the process and steps