This is a repository copy of
Cellular Active N-Hydroxyurea FEN1 Inhibitors Block Substrate
Entry to the Active Site
.
White Rose Research Online URL for this paper:
http://eprints.whiterose.ac.uk/100047/
Version: Accepted Version
Article:
Exell , J.C., Thompson , M.J., Finger, L.D. et al. (11 more authors) (2016) Cellular Active
N-Hydroxyurea FEN1 Inhibitors Block Substrate Entry to the Active Site. Nature Chemical
Biology, 12. pp. 815-821. ISSN 1552-4450
https://doi.org/10.1038/nchembio.2148
[email protected] https://eprints.whiterose.ac.uk/ Reuse
Unless indicated otherwise, fulltext items are protected by copyright with all rights reserved. The copyright exception in section 29 of the Copyright, Designs and Patents Act 1988 allows the making of a single copy solely for the purpose of non-commercial research or private study within the limits of fair dealing. The publisher or other rights-holder may allow further reproduction and re-use of this version - refer to the White Rose Research Online record for this item. Where records identify the publisher as the copyright holder, users can verify any specific terms of use on the publisher’s website.
Takedown
If you consider content in White Rose Research Online to be in breach of UK law, please notify us by
1 1
Cellular Active
N
-Hydroxyurea FEN1 Inhibitors Block
2
Substrate Entry to the Active Site
3 4 5
Jack C. Exell,
1,6Mark J. Thompson,
1L. David Finger,
1Steven J. Shaw,
1 6Judit Debreczeni,
2Thomas A. Ward,
4Claire McWhirter,
2Catrine L. B.
7Siöberg,
5Daniel Martinez Molina,
5W. Mark Abbott,
2Clifford D. Jones,
3 8J. Willem M. Nissink,
3,*Stephen T. Durant
4,*and Jane A. Grasby.
1,*9
10
1
Centre for Chemical Biology, Department of Chemistry, Krebs Institute, University 11
of Sheffield, Sheffield, S3 7HF, UK 12
13
2Discovery Sciences,Innovative Medicines and Early Development Biotech Unit,
14
AstraZeneca, Unit 310 (Darwin Building), Cambridge Science Park, Milton Road, 15
Cambridge, CB4 0WG, UK. 16
17
3Chemistry, Oncology,Innovative Medicines and Early Development Biotech Unit,
18
AstraZeneca, Unit 310 (Darwin Building), Cambridge Science Park, Milton Road, 19
Cambridge, CB4 0WG, UK and Alderley Park, Cheshire, SK10 4TG, UK. 20
21
4
Bioscience, Oncology,Innovative Medicines and Early Development Biotech Unit, 22
CRUK Cambridge Institute, Robinson Way, Cambridge, CB2 0RE, UK; Alderley 23
Park, Cheshire, SK10 4TG, UK and AstraZeneca, Unit 310 (Darwin Building), 24
Cambridge Science Park, Milton Road, Cambridge, CB4 0WG, UK. 25
26
5
Pelago Bioscience AB, Nobels Väg 3, 17165, Sweden 27
28
6
Current address: Department of Microbiology and Molecular Genetics, University of 29
California, Davis, Briggs Hall, One Shields Ave, Davis, CA 95616-8665, US 30
31 32
*To whom correspondence should be addressed. E-mail: [email protected],
33
2
Abstract
36
The structure-specific nuclease human flap endonuclease-1 (hFEN1) plays a key role in DNA
37
replication and repair and may be of interest as an oncology target. We present the first crystal
38
structure of inhibitor-bound hFEN1 and show a cyclic N-hydroxyurea bound in the active site
39
coordinated to two magnesium ions. Three such compounds had similar IC50 values but
40
differed subtly in mode of action. One had comparable affinity for protein and protein–
41
substrate complex and prevented reaction by binding to active site catalytic metal ions,
42
blocking the unpairing of substrate DNA necessary for reaction. Other compounds were more
43
competitive with substrate. Cellular thermal shift data showed engagement of both inhibitor
44
types with hFEN1 in cells with activation of the DNA damage response evident upon
45
treatment. However, cellular EC50s were significantly higher than in vitro inhibition constants
46
and the implications of this for exploitation of hFEN1 as a drug target are discussed.
47
48
3
Introduction
50
Flap endonuclease 1 (FEN1) is the prototypical member of the 5 -nuclease superfamily,1,2
51
whose activities span a range of cellular pathways involved in DNA replication and genome
52
maintenance.3,4 FEN1 is a structure-selective metallonuclease essential for Okazaki fragment
53
maturation through efficient removal of 5 -flaps resulting from strand displacement during
54
lagging-strand synthesis.5,6 This reaction produces nicked DNA suitable for ligation, thereby
55
ensuring maintenance of genomic fidelity. FEN1 is also involved in long-patch base excision
56
repair7-9 (LP-BER), amongst other pathways.
57
58
Given its critical replicative function, it is not surprising that FEN1 overexpression is
59
characterized in multiple cancer types10-13 such that it has been suggested as both a biomarker
60
relating to prognosis and disease progression, and a potential therapeutic target. Target
61
validation studies have focused either on chemosensitization14,15 or synthetic lethal
62
interactions16-19 with established oncogenes. Synthetic lethality arises when loss of function of
63
either gene of an interacting pair is not cytotoxic, but mutation or inhibition of both does
64
cause cell death; hence, targeting interacting partners of mutated genes in cancer offers
65
potential for selective killing of cancer cells.
66
67
Therapeutic interest in FEN1 arises from its known synthetic lethal interactions with several
68
genes frequently mutated in cancers.16,17,20 FEN1 inhibition selectively impairs proliferation of
69
colon cancer cells deficient in Cdc4 and Mre11a,16,18 both frequently mutated in colorectal
70
cancers. FEN1 has also emerged as a potential chemosensitizing target due to its role in
LP-71
BER17 since it is critical for repair of MMS (methyl methanesulfonate)-induced alkylation
72
damage,21 and its knockdown or inhibition increases sensitivity to TMZ (temozolomide) in
73
glioblastoma13 and colorectal cancer14,16,18 cell lines.
74
75
This considerable interest in human FEN1 (hFEN1) as a drug target has prompted
76
development of high-throughput screening procedures22,23 and the discovery of an N
4
hydroxyurea based series of hFEN1 inhibitors.24 We investigated the specificity and mode of
78
action of these compounds and found they prevented access of the scissile phosphate diester
79
of substrate DNA to catalytic metal ions. We also demonstrated cellular activity and target
80
engagement in live cells, leading to activation of the DNA damage response and apoptosis.
81
82
Results
83
N-Hydroxyurea hFEN1 inhibitors bind catalytic site metals
84
Inhibitor 124 (Figure 1a) was co-crystallized with hFEN1–Mg2+ truncated after residue 336
85
(hFEN1-336Δ), which retains all catalytic features but lacks the flexible 44 amino acid
86
C-terminus.25,26 The crystal structure of the hFEN1-336Δ–inhibitor complex (Figure 1b) was
87
solved at 2.84 Å resolution (Supplementary Results, Supplementary Table 1 and
88
Supplementary Figure 1; PDB ID 5FV7) and resembled a kidney bean with the active site and
89
requisite divalent metal ions residing at the indentation. The structure in the presence of the
90
active site-bound inhibitor closely resembled that of hFEN1 in complex with proliferating cell
91
nuclear antigen (PCNA).27 As with the PCNA-bound structure, no density was observed for
92
the helical arch (α4 and α5) and α2-α3 loop regions, which are visible when co-crystallized
93
with substrate or product DNA.2
94
95
The inhibitor was situated in the protein’s nuclease active site with the N-hydroxyurea moiety
96
directly coordinating two Mg2+ ions positioned 4.5 Å apart (Figure 1b), anchored by
inner-97
sphere metal-coordinating contacts from carboxylates of E160, D179 and D181 and
outer-98
sphere or water-mediated contacts from D34, D86, E158 and D233 (Figure 1c). The
99
thiophene ring of the inhibitor filled a small hydrophobic pocket formed by M37, Y40 and
100
V133, and the sulfur of M37 exhibited a short-distance (4Å) favorable contact to the electron
101
deficient pyrimidine-2,4-dione ring of the ligand. The 2,3-dihydrobenzo[b][1,4]dioxine
102
sidechain contacted M37 and Y40, though these contacts were less directional and mostly
103
hydrophobic in nature. It was evident that different binding poses in the active site are
5
possible for the N-hydroxyurea series of inhibitors, which goes some way to rationalizing the
105
reported SAR.24 The relatively weak nature of protein contacts with the sidechain
(N1-106
substituent) explained the modest improvement in IC50 values seen for compounds modified
107
at this position.24 It is also understandable how substitutions restricting the conformational
108
freedom of the sidechain—for example, introduction of a methyl group at the 7-position of
109
the thieno[3,2-d]pyrimidine-2,4-dione system of 1—would significantly reduce binding
110
affinity and therefore increase IC50, as is reported.24
111
112
Inhibitor binding pose suggests a possible mode-of-action
113
Coordination of 1 to the metal ions that catalyze specific phosphodiester hydrolysis of the
114
substrate suggested a mode of action for this inhibitor. We modelled ternary protein–
115
inhibitor–DNA complexes using the present hFEN1-336Δ–inhibitor structure together with
116
the published hFEN1-336Δ–product DNA complex2 (Figure 1d). Alignment of product-bound
117
and ligand-bound structures indicated that the inhibitor and the phosphate monoester of the
118
product DNA strand both co-locate to bind the metal ions. Conversely, in the hFEN1-336Δ–
119
substrate DNA complex2, the scissile bond is not in contact with active site metal ions
120
because the DNA is base-paired. It is assumed a pre-reactive complex forms initially that
121
requires the end of the DNA duplex to unpair and bind to metal ions as a prerequisite for
122
cleavage.1,2,28 Hence, it was considered plausible that substrate could bind in the presence of
123
inhibitor, but that this prevents DNA from accessing the catalytic metals as required for
124
hydrolysis to occur (Figure 2a). An alternative hypothesis was that the inhibitor precludes
125
DNA binding, although the compound was bound far from the other two main areas of
126
protein–DNA interaction (K+/H2TH motif and 3 -flap binding pocket). We undertook further
127
work to characterize the hFEN1-inhibitor interaction and establish whether the N-hydroxyurea
128
inhibitors compete with substrate DNA binding.
129
130
6
Inhibitor binding to hFEN1 requires magnesium ions
132
We quantified the interaction of 1, and related analogs 2 and 322 bearing a smaller or no
133
sidechain (Figure 1a), with the substrate-free protein using isothermal titration calorimetry
134
(ITC; Supplementary Table 2). Similar dissociation constants (KD) were obtained for 1 and 2
135
in the presence of Mg2+ with either hFEN1-336Δ (Supplementary Figure 2) or full-length
136
hFEN1 (Supplementary Figure 3a,b) but the KD of 3 was approximately 10-fold higher,
137
suggesting interactions between the sidechains of 1 and 2 and the protein contribute to
138
binding.
139
140
Ca2+ ions are often employed as a nonviable cofactor in biophysical measurements with
141
hFEN1 because they facilitate accommodation of the substrate DNA and its required
142
conformational changes,28,29 but do not support catalysis. In fact, Ca2+ ions are a competitive
143
inhibitor of 5 -nuclease reactions with respect to Mg2+,30,31 implying both ions occupy similar
144
sites on the protein. However, KD values were drastically increased on replacement of Mg 2+
145
with Ca2+ (Supplementary Figure 4), showing the latter did not support inhibitor binding.
146
Thus, in accord with the crystal structure, interaction of 1 and 2 with hFEN1 was specific to
147
the nuclease core domain and required Mg2+. To provide an estimate of residence time, we
148
probed the interaction of 1 with hFEN1-336Δ using surface plasmon resonance
149
(Supplementary Figure 2d) and obtained a dissociation constant similar to ITC with a
150
residence time of 3 min.
151
152
Inhibitors bind to both protein and protein–DNA complex
153
Kinetic experiments were used to characterize hFEN1 inhibition by 1, 2 and 4. We measured
154
rates of hFEN1-336Δ-catalyzed reaction with an optimal endonucleolytic double-flap
155
substrate bearing a 5 -fluorescein label32 (DF1; Figure 2a, and Supplementary Figure 5a). At
156
substrate concentration close to KM (100 nM), IC50 values for all three compounds were
157
similar (Table 1), and a related exonucleolytic substrate gave similar IC50 results
7
(Supplementary Figure 6a,b). Mode of inhibition was determined by globally fitting rates of
159
reaction at varying inhibitor and double-flap substrate concentrations to four inhibition
160
models: competitive, uncompetitive, non-competitive and mixed inhibition.
161
162
The uncompetitive model—where the inhibitor can only bind to enzyme–substrate complex—
163
afforded a poor fit for 1, which was unsurprising given the compound’s high affinity for free
164
protein. The competitive model, where binding of inhibitor and substrate are mutually
165
exclusive, also proved unsuitable but the mixed and non-competitive models produced
166
acceptable fits (Figure 2b-d and Supplementary Figure 7). These models both assume the
167
inhibitor can bind to DNA-free and DNA-bound forms of the enzyme, but the
non-168
competitive model (Equation 4) assumes both complexes have equivalent ligand dissociation
169
constants. Allowing dissociation constants to vary (mixed inhibition; Figure 2b and Equation
170
5) produced a marginally better data fit, yielding near-equivalent dissociation constants for 1
171
(Table 1). Statistical model selection using Aikake’s Information Criteria (AIC)
172
overwhelmingly preferred the mixed inhibition model.
173
174
With compound 2, only the competitive (Equation 3) and mixed inhibition models produced
175
acceptable fits (Figures 2e, S8). The same statistical criteria (AIC) again favored the mixed
176
model, but in this case the derived dissociation constants (Kic and Kiu) varied by an order of
177
magnitude (Table 1). For compound 4, only the competitive model produced an acceptable fit
178
(Figure 2f, Table 1 and Supplementary Figure 9). Thus, whereas 1, 2 and 4 all bound to
179
hFEN1–Mg2+ with similar efficiency, only 1 showed notable affinity for the enzyme-substrate
180
complex (hFEN1–Mg2+–DNA), binding both DNA-free and DNA-bound forms of the
181
enzyme with comparable dissociation constants.
182
183
Evidence for an hFEN1–Mg2+–Inhibitor–DNA complex
184
To verify formation of a quaternary complex of enzyme–Mg2+–inhibitor–DNA (E–Mg2+–I–
185
DNA), we tested the ability of E–Mg2+–I to form complexes with DNA without significant
8
hydrolysis of the substrate occurring. High concentrations of 1 or 2 (100 µM) slowed the rate
187
of Mg2+-catalyzed reaction 10,000-fold under single-turnover conditions (Table 1 and
188
Supplementary Figure 10), but appreciable substrate cleavage was still seen over the
189
timescale required for biophysical measurements. Because Ca2+ did not support inhibitor
190
binding (Supplementary Figure 4), substituting it in place of Mg2+ as a nonviable cofactor was
191
not applicable. Instead, we employed a previously characterized hFEN1 mutant, R100A.
192
Arg100 is strictly conserved in FEN1 proteins and its mutation to alanine slows reaction
193
7,000-fold.33 The half-life of substrate with R100A–Mg2+ and inhibitors was sufficiently long
194
to permit measurements without significant product formation (Supplementary Figure 9), and
195
ITC confirmed the mutation did not affect inhibitor binding (Supplementary Table 2).
196
197
Both 1 and 2 formed R100A–Mg2+–I–DNA complexes as demonstrated by increases in
198
anisotropy (r) of DF1 substrateupon titration withR100A–Mg2+–I, with r reaching a common
199
limiting value at high enzyme concentration (Figure 3a). Data fitting to a simple binding
200
isotherm revealed similar trends in KD between R100A and its wt equivalent, with which the
201
use of non-catalytic Ca2+ ions was necessary to prevent reaction (Supplementary Figures
11a-202
d, 12a). Competing away bound, FAM-labeled substrate with its unlabeled equivalent
203
demonstrated specific interaction between R100A and this substrate (Supplementary Figures
204
5a,b, 11h). Substrate dissociation constants differed between quaternary complexes containing
205
1 or 2 (Figure 3a): with compound 1, R100A–Mg2+–1 displayed a KD only threefold greater
206
than that for R100A–Ca2+. In contrast, the substrate bound 10-fold more weakly to R100A–
207
Mg2+–2. These results were consistent with 1 having a closer Kiu value relative to Kic than 2,
208
again suggesting 2 was more competitive than mixed in character.
209
210
DNA is bent in complexes with or without inhibitors
211
hFEN1 possesses two juxtaposed double-stranded DNA binding sites that accommodate
212
double-flap substrate DNA in a conformation with a 100° bend at the junction. To ascertain
9
whether DNA bound similarly in the presence of inhibitor, we examined substrate bending
214
using FRET. We labelled double-flap substrate with a rhodamine-fluorescein dye pair on its
215
respective duplexes, and verified binding to hFEN1 produces an increase in FRET signal34
216
(Figure 3b and Supplementary Figures 5c-f, 14). Titration of R100A–Ca2+ or R100A–Mg2+–1
217
into the labeled substrate produced comparable FRET efficiency start and end values (Figure
218
3b) confirming the enzyme had engaged both DNA binding sites with or without inhibitor.
219
The substrate KD was raised by a factor of three in the presence of 1, whereas substrate
220
binding was much weaker with 2 present (Figure 3b and Supplementary Table 3); hence,
221
these results mirrored those obtained earlier by fluorescence anisotropy.
222
223
Inhibitors bound to catalytic metals block DNA unpairing
224
Unpairing of the reacting substrate duplex, which places the target phosphodiester onto active
225
site metal ions, is a prerequisite for hFEN1-catalysed reaction one nucleotide into the
double-226
stranded DNA (Figure 2a).28 This metal ion-dependent conformational change may be
227
monitored using substrates containing a tandem 2-aminopurine (2AP) exciton pair at the –1
228
and –2 positions of the 5 -flap strand (DF3, Supplementary Figure 5g) by measuring changes
229
in the low energy exciton-coupled CD spectrum resulting from the 2APs, usually in the
230
presence of Ca2+ to prevent reaction.28
231
232
In adopting the reactive conformation, the +1 and –1 nucleotides are assumed to become
233
extrahelical whereas the –2 nucleotide remains base-paired. In the absence of active site
234
divalent ions (EDTA added), a strong maximum at 330 nm is observed from the R100A–
235
DNA complex, due to the exciton pair and consistent with substrate remaining base-paired.28
236
With R100A–Ca2+–DNA, the DNA conformational change reverses the sign of the CD signal
237
producing a deep minimum at 310 nm (Figure 4a). In the presence of 1 or 2, the measured CD
238
signal of R100A–Mg2+–I–DNA did not differ significantly from that observed for R100A–
239
DNA without divalent ions (Figure 4b,c), even though the DNA was assumed to be fully
240
bound under these conditions (10 µM DNA, 12.5 µM R100A). This demonstrated that the
10
inhibitors prevented substrate conformational rearrangements necessary for hydrolysis
242
(Supplementary Figure 15).
243
244
N-Hydroxyurea FEN1 inhibitors also target EXO1
245
FEN1 is the prototypical member of the structure-specific 5 -nuclease superfamily, also
246
comprising exonuclease 1 (EXO1), gap endonuclease 1 (GEN1) and Xeroderma
247
Pigmentosum complementation group G protein (XPG).1 Exoribonucleases XRN1 and 2 are
248
also suggested members of the superfamily.1 These nucleases all share a similarly-folded
249
nuclease domain with similar active site geometry and full conservation of essential catalytic
250
residues.1,2 Consequently, it has been hypothesized that the substrate selectivity of these
251
proteins stems from strict recognition of their respective DNA substrate structures, followed
252
by double nucleotide unpairing to initiate scissile phosphate diester hydrolysis.1
253
254
It is known that hFEN1 inhibitors can exhibit limited but manageable promiscuity towards
255
XPG.24 However, testing against human EXO1-352Δ (nuclease domain of EXO1)35 revealed
256
that compounds 1 and 2 both inhibited this target with IC50 values similar to those against
257
hFEN1 (Supplementary Figures 5k, 6a,e). Differential scanning fluorimetry experiments36
258
further confirmed binding of both compounds to both proteins in a divalent metal
ion-259
dependent manner (Supplementary Figure 6g,h). In contrast, inhibitor 1 was found ineffective
260
against bacteriophage T5 FEN (Supplementary Figures 5l, 6c) and Kluyveromyces lactis
261
XRN1 (Supplementary Figure 16), both of which show a high level of active site conservation
262
with the mammalian 5 -nuclease superfamily.1 Similarily, 1 did not inhibit the structurally
263
unrelated DNA repair metallonuclease APE1 (Supplementary Figure 6f).
264
265
When hFEN1 acts in vivo it is usually associated with the toroidal clamp PCNA. PCNA
266
increases the stability of FEN1–DNA complexes,34 suggesting that association with PCNA
267
might allow FEN1 to overcome inhibition. However, when we added hPCNA to hFEN1
268
reactions inhibited by 1 or 4, the slow rates of reaction observed did not increase implying the
11
FEN1 interaction partner does not dramatically influence the IC50 of either compound
270
(Supplementary Figure 6d).
271
272
N-Hydroxyurea inhibitors engage with hFEN1 in live cells
273
On the basis of contrasting inhibition modes, compounds 1 and 4 were selected for additional
274
cellular studies. We employed the cellular thermal shift assay technique (CETSA)37 to
275
establish whether theyinteracted with hFEN1 in SW620 colon cancer cells. CETSA detects
276
changes in stability of a protein upon engagement with a ligand, like a biochemical thermal
277
shift assay, but is performed with whole cells and a target-specific, label-free readout of
278
engagement is obtained using a relevant antibody. Compounds 1 and 4 stabilized hFEN1
279
(Figure 5a-c and Supplementary Figure 17) with EC50 = 5.1 µM and 6.8 µM, respectively, in
280
an isothermal concentration–response experiment, representing similar EC50sregardless of
281
their differing modes of inhibition. Interestingly, these micromolar-range values represented a
282
substantial drop-off in observed binding affinity compared with observations in prior
283
biochemical assays (IC50 = 46 nM and 17 nM, respectively; Table 1) so we undertook a
284
number of experiments to attempt to explain this. Cell permeability in MDCK and Caco-2
285
assays was not an issue (Supplementary Table 4); neither were other properties including
286
solubility and chemical stability. The compounds’ affinity for free divalent metal ions in
287
solution was insignificant, ruling out metal chelation as an explanation. Nonspecific protein
288
binding may have contributed to the discrepancy between biochemical and phenotypic
289
potency, although binding to other 5 -nuclease superfamily members represented the most
290
obvious potential for off-target effects. Hence, we attempted further CETSA studies with 1
291
and 4 against hEXO1 but this was concluded to be a non-viable CETSA target (with only
292
fragments of the protein detected on the blots), perhaps reflecting instability of the protein
293
under the assay conditions, or its cellular context as a component of multi-protein complexes
294
(which regulate its activity).
295
296
12
hFEN1 inhibition activates the DNA damage checkpoint
298
High concentrations of compound 1 proved cytotoxic towards SW620 cells with an EC50 of
299
11 µM (Figure 5d), but HeLa cells stably expressing hFEN1-shRNA were 70% viable at 20
300
µM 1 (Figure 5e; purple curve). Mock-shRNA expressing HeLa cells were only 15% viable
301
under the same conditions (Figure 5e; black curve), showing similar susceptibility to 1 as
302
untransformed cells. Hence, a lack of hFEN1 conferred resistance to 1, suggesting on-target
303
activity as the primary cause of cytotoxicity. SW620 cells also showed increased sensitivity to
304
MMS when co-treated with 1, in a dose-dependent manner (Figure 5f), suggesting the
305
compoundinhibits the LP-BER function of FEN1 in a cellular context. Enhanced toxicity of 1
306
towards HeLa cells expressing Rad54b-shRNA (Figure 5e; green curve) was also observed
307
with an EC50 of 6.4 µM compared to 14.9 µM against untransformed cells (Figure 5e,g),
308
confirming the synthetic lethal interaction between Fen1 and Rad54b previously
309
demonstrated by silencing of the former.18 Inhibitor 4 also proved cytotoxic to HeLa cells
310
(EC50 6 µM; Figure 5g), appearing more potent than 1, whose EC50 of approximately 15 µM
311
was in line with its toxicity against SW620 cells.
312
313
When treated with sub-lethal doses of 1, SW620 cells showed evidence of an induced DNA
314
damage response (Figure 5h and Supplementary Figure 18) at concentrations consistent with
315
the EC50 for target engagement observed by CETSA. The same compound effected a
dose-316
dependent increase in ubiquitination of FANCD2, a marker for activation of the Fanconi
317
anemia pathway recruited to stabilize stalled replication forks.38-40 At higher doses,
318
accumulation of phosphorylated ATM and γH2AX was evident, indicating accumulation of
319
unrepaired DNA double-strand breaks (DSBs). Cells treated with high concentrations of 1
320
also showed evidence of apoptosis, shown by the presence of cleaved PARP (Figure 5h).
321
Knockdown of hFEN1 by siRNA activated a similar DNA damage response to treatment with
322
1; these cells accumulated γH2AX but otherwise remained viable (Figure 5i and
323
Supplementary Figure 19). DNA damage response activation and apoptosis were consistent
13
with loss of hFEN1 function, because the consequences of unprocessed Okazaki fragments
325
would include stalled or collapsed replication forks, replication errors and double strand
326
breaks.
327
328
Discussion
329
N-Hydroxyurea compounds 1, 2 and 4 prevented DNA cleavage with similar efficiency
330
(Table 1), reflecting the SAR observed previously for similar-sized compounds24 inasmuch as
331
comparable IC50 values were obtained despite notable differences in sidechain size and
332
structure. These results were consistent with protein–inhibitor binding mediated primarily
333
through interaction with active site Mg2+ ions, and a lack of strong contacts between the
334
protein and inhibitor sidechain, as seen in the structure of 1 bound to hFEN1 (Figure 1 and
335
Supplementary Table 2). Although the metal-coordinating headgroup clearly provided the
336
predominant binding contribution, the elevated KD of 3 suggested interaction of the inhibitor
337
sidechain with the protein was nonetheless important for optimal affinity. Further studies
338
revealed subtle differences in mode of action on variation of the sidechain structure.
339
340
Although the DNA substrate bound in its usual conformation in the presence of compound 1,
341
hydrolysis was impaired by prevention of double nucleotide unpairing through steric blocking
342
of the catalytic metals (Figures 1b-d, 3, 4). These observations were reminiscent of the action
343
of the HIV integrase inhibitor raltegravir.41 Raltegravir and functionally related compounds
344
bind to active site metal ions of the integrase–DNA complex, similarly obstructing access of
345
the reacting phosphodiester bond to the metals. In contrast, compounds 2 and 4, with altered
346
sidechains, proved mostly competitive in character and primarily acted to reduce affinity of
347
the enzyme for its DNA substrate.
348
349
The micromolar EC50s seen in CETSA experiments with 1 and 4 differed markedly from the
350
compounds’ nanomolar potency against purified protein – though they were consistent with
351
phenotypic potency in DNA damage induction and cytotoxicity assays. A clear explanation
14
for this was not found, but the raised cellular EC50s might reflect a high local concentration of
353
hFEN1 in the nucleus during S-phase, which could conceivably reach the micromolar range.
354
The residence time of compound 1 on hFEN1 proved similar to that of raltegravir on its target
355
(4.8 min),42 although this is short compared to the median of 51 min for a representative set of
356
marketed drugs,42 so the short residence time of 1 may necessitate a high local drug
357
concentration in the vicinity of the target for effective inhibition in cells.
358
359
Although hEXO1 is likely inhibited alongside hFEN1, the cellular concentration of hEXO1 is
360
not expected to be significantly higher, so this seems an unlikely explanation for the raised
361
EC50 values. The results with hFEN1-deficient cells (Figure 5e) did suggest some degree of
362
target specificity, but previous cellular studies assuming selective inhibition of hFEN1 by the
363
N-hydroxyurea series must nonetheless be interpreted with caution based on the likelihood of
364
parallel hEXO1 inhibition, since it will not be possible to distinguish between phenotypes of
365
hFEN1 and hEXO1 inhibition with this class of compounds. One such published24 inhibitor,
366
related to 1-4, was employed to help validate a role for hFEN1 in homologous recombination
367
(HR),43 demonstrating deficient HR upon treatment. However, hEXO1 is essential for
368
competent HR,44-47 and the observed phenotype is explicable by inhibition of this enzyme
369
alone. Although a role for hFEN1 in HR is otherwise supported in that study, we concluded
370
that the N-hydroxyurea series should not be regarded as exclusive hFEN1 inhibitors.
371
372
The mixed inhibition mode of 1, which in theory permits ‘dead-end’ complexes of DNA and
373
protein to form, did not confer any advantageous inhibition characteristics in cells.
374
Unprocessed Okazaki fragments resulting from hFEN1 inhibition might be successfully
375
repaired by the cell with apoptosis only resulting when the DNA damage response is
376
overwhelmed. Some support for this notion was seen in SW620 cells treated with 1, where we
377
observed dose-dependent activation of the Fanconi anemia pathway (Figure 5h). Because
378
FANCD2 is recruited to stabilize stalled replication forks and initiate repair,38 treatment with
379
1 evidently did interrupt replication, prompting cells to activate other pathways to repair
15
unprocessed Okazaki fragments directly. Failure to achieve this may cause collapse of
381
replication forks into DSBs, and at higher doses of compound 1, we did see evidence for DSB
382
repair pathway activation. These markers did not accumulate at lower doses, so the damage
383
signal may only be obvious when the frequency of DSBs overwhelms the cell’s DNA damage
384
response. Accumulation of cleaved PARP, indicating early apoptosis, also suggested cells
385
exposed to 1 were accumulating DNA damage associated with hFEN1 and/or hEXO1
386
inhibition and signaling for apoptosis.
387
388
Without exposure to inhibitor, both SW620 cells treated with hFEN1-siRNA and HeLa cells
389
stably expressing hFEN1-shRNA showed viability indistinguishable from untransformed
390
controls yet constitutively initiated a DNA damage response (Figure 5i). The hFEN1-shRNA
391
cells showed reduced sensitivity to 1, suggesting a degree of selectivity and on-target activity
392
for the compound since the DNA damage reponse remained competent. Our data suggests
393
removal of functional hFEN1 alone did not induce toxicity and that damage associated with
394
its loss is successfully repaired until such mechanisms become overwhelmed. This result,
395
alongside our other observations in human cells, suggests targeting of hFEN1 in cancer will
396
not prove effective as a monotherapy, but could be useful in exploiting synthetic lethal
397
vulnerabilities. Synthetic lethal interactions between hFEN1 and Rad54b,18 Cdc416 and
398
Mre11a16 are established, and other such interactions with potential clinical relevance are
399
proposed.16,38 We confirmed synthetic lethal interaction with Rad54b, previously established
400
using hFEN1 knockdown,18 through inhibition of the latter by 1. Thus, hFEN1 inhibitors
401
might prove beneficial as a component of targeted or personalized therapies, provided
402
selectivity over hEXO1 and the other 5 -endonuclease superfamily members can be realized.
403
404
Accession Codes
405
The PDB accession code for the crystal structure presented in Figure 1 is 5FV7.
406
407
Acknowledgements
16
This work was supported by BBSRC grants BB/K009079/1 and BB/M00404X/1 (both to
409
JAG) and AstraZeneca. JCE thanks the EPSRC and AstraZeneca for a studentship. The
410
authors thank Dr Chris Phillips for assistance with submissions of the crystallographic data
411
and Dr Thomas McGuire for synthetic support.
412
413
Author Contributions
414
CJ designed and synthesized inhibitors, JCE, MJT, LDF and SJS carried out kinetic and
415
biophysical experiments. JCE, MJT, LDF, CM, JWMN, MA and JAG designed experiments
416
and analyzed this data. JD and JWMN obtained and analyzed structures. CLBS and DMM
417
performed the CETSA assays. TAW carried out other cellular experiments, and TAW and
418
STD analyzed data. All authors contributed to the preparation of the manuscript.
419
420
Competing Financial Interest Statement
421
MA, CM, JD, JWMN, TAW and STD are employees of AstraZeneca. CJ was an employee of
422
AstraZeneca at the time of writing. CLBS and DMM are employees of Pelago Bioscience AB.
423
424
References
425 426
1 Grasby, J. A., Finger, L. D., Tsutakawa, S. E., Atack, J. M. & Tainer, J. A. Unpairing
427
and gating: sequence-independent substrate recognition by FEN superfamily
428
nucleases. Trends Biochem. Sci.37, 74-84, doi:10.1016/j.tibs.2011.10.003 (2012).
429
2 Tsutakawa, S. E. et al. Human flap endonuclease structures, DNA double-base
430
flipping, and a unified understanding of the FEN1 superfamily. Cell 145, 198-211,
431
doi:10.1016/j.cell.2011.03.004 (2011).
432
3 Kim, C. Y., Shen, B. H., Park, M. S. & Olah, G. A. Structural changes measured by
433
X-ray scattering from human flap endonuclease-1 complexed with Mg2+ and flap
434
DNA substrate. J. Biol. Chem.274, 1233-1239, doi:10.1074/jbc.274.3.1233 (1999).
435
4 Zheng, L. et al. Functional regulation of FEN1 nuclease and its link to cancer.
436
Nucleic Acids Res.39, 781-794, doi:10.1093/nar/gkq884 (2011).
437
5 Waga, S., Bauer, G. & Stillman, B. Reconstitution of complete SV40 SNA replication
438
with purified replication factors. J. Biol. Chem.269, 10923-10934 (1994).
439
6 Bambara, R. A., Murante, R. S. & Henricksen, L. A. Enzymes and reactions at the
440
eukaryotic DNA replication fork. J. Biol. Chem.272, 4647-4650 (1997).
441
7 Kim, K., Biade, S. & Matsumoto, Y. Involvement of flap endonuclease 1 in base
442
excision DNA repair. J. Biol. Chem. 273, 8842-8848, doi:10.1074/jbc.273.15.8842
443
(1998).
444
8 Parikh, S. S., Mol, C. D., Hosfield, D. J. & Tainer, J. A. Envisioning the molecular
445
choreography of DNA base excision repair. Curr. Opin. Struct. Biol. 9, 37-47,
446
doi:10.1016/s0959-440x(99)80006-2 (1999).
17
9 Beard, W. A. & Wilson, S. H. Structure and mechanism of DNA polymerase beta.
448
Chem. Rev.106, 361-382, doi:10.1021/cr0404904 (2006).
449
10 Mohan, V. & Srinivasan, M. in New Research Directions in DNA Repair (ed Clark
450
Chen) (InTech, 2013).
451
11 Singh, P. et al. Overexpression and hypomethylation of flap endonuclease 1 gene in
452
breast and other cancers. Mol. Cancer Res. 6, 1710-1717,
doi:10.1158/1541-453
7786.mcr-08-0269 (2008).
454
12 Lam, J. S. et al. Flap endonuclease 1 is overexpressed in prostate cancer and is
455
associated with a high Gleason score. BJU Int. 98, 445-451,
doi:10.1111/j.1464-456
410X.2006.06224.x (2006).
457
13 Nikolova, T., Christmann, M. & Kaina, B. FEN1 is overexpressed in testis, lung and
458
brain tumors. Anticancer Res.29, 2453-2459 (2009).
459
14 Panda, H. et al. Amino acid Asp181 of 5'-flap endonuclease 1 is a useful target for
460
chemotherapeutic development. Biochemistry48, 9952-9958, doi:10.1021/bi9010754
461
(2009).
462
15 Yoshimoto, K. et al. Complex DNA repair pathways as possible therapeutic targets to
463
overcome temozolomide resistance in glioblastoma. Front. Oncol. 2, 186,
464
doi:10.3389/fonc.2012.00186 (2012).
465
16 van Pel, D. M. et al. An evolutionarily conserved synthetic lethal interaction network
466
identifies FEN1 as a broad-spectrum target for anticancer therapeutic development.
467
PLoS Genet.9, 11, doi:10.1371/journal.pgen.1003254 (2013).
468
17 Illuzzi, J. L. & Wilson, D. M. Base excision repair: contribution to tumorigenesis and
469
target in anticancer treatment paradigms. Curr. Med. Chem.19, 3922-3936 (2012).
470
18 McManus, K. J., Barrett, I. J., Nouhi, Y. & Hieter, P. Specific synthetic lethal killing
471
of RAD54B-deficient human colorectal cancer cells by FEN1 silencing. Proc. Natl.
472
Acad. Sci. USA106, 3276-3281, doi:10.1073/pnas.0813414106 (2009).
473
19 Durant, S. T. Telomerase-independent paths to immortality in predictable cancer
474
subtypes. J. Canc.3, 67-82, doi:10.7150/jca.3965 (2012).
475
20 Hwang, J.-C. et al. The overexpression of FEN1 and RAD54B may act as
476
independent prognostic factors of lung adenocarcinoma. PLoS ONE 10, e0139435,
477
doi:10.1371/journal.pone.0139435 (2015).
478
21 Shibata, Y. & Nakamura, T. Defective flap endonuclease 1 activity in mammalian
479
cells is associated with impaired DNA repair and prolonged S phase delay. J. Biol.
480
Chem.277, 746-754, doi:10.1074/jbc.M109461200 (2002).
481
22 McWhirter, C. et al. Development of a high-throughput fluorescence polarization
482
DNA cleavage assay for the identification of FEN1 inhibitors. J. Biomol. Screen.18,
483
567-575, doi:10.1177/1087057113476551 (2013).
484
23 Dorjsuren, D., Kim, D., Maloney, D. J., Wilson, D. M. & Simeonov, A.
485
Complementary non-radioactive assays for investigation of human flap endonuclease
486
1 activity. Nucleic Acids Res.39, e11, doi:10.1093/nar/gkq1082 (2011).
487
24 Tumey, L. N. et al. The identification and optimization of a N-hydroxy urea series of
488
flap endonuclease 1 inhibitors. Bioorg. Med. Chem. Lett. 15, 277-281,
489
doi:10.1016/j.bmcl.2004.10.086 (2005).
490
25 Finger, L. D. et al. The wonders of flap endonucleases: structure, function,
491
mechanism and regulation. Sub. Cell Biochem.62, 301-326,
doi:10.1007/978-94-007-492
4572-8_16 (2012).
493
26 Guo, Z. G. et al. Sequential posttranslational modifications program FEN1
494
degradation during cell-cycle progression. Mol. Cell 47, 444-456,
495
doi:10.1016/j.molcel.2012.05.042 (2012).
496
27 Sakurai, S. et al. Structural basis for recruitment of human flap endonuclease 1 to
497
PCNA. EMBO J.24, 683-693, doi:10.1038/sj.emboj.7600519 (2005).
498
28 Finger, L. D. et al. Observation of unpaired substrate DNA in the flap endonuclease-1
499
active site. Nucleic Acids Res.41, 9839-9847, doi:10.1093/nar/gkt737 (2013).
18
29 Patel, N. et al. Flap endonucleases pass 5'-flaps through a flexible arch using a
501
disorder-thread-order mechanism to confer specificity for free 5'-ends. Nucleic Acids
502
Res.40, 4507-4519, doi:10.1093/nar/gks051 (2012).
503
30 Syson, K. et al. Three metal ions participate in the reaction catalyzed by T5 flap
504
endonuclease. J. Biol. Chem. 283, 28741-28746, doi:10.1074/jbc.M801264200
505
(2008).
506
31 Tomlinson, C. G. et al. Neutralizing mutations of carboxylates that bind metal 2 in T5
507
flap endonuclease result in an enzyme that still requires two metal ions. J. Biol.
508
Chem.286, 30878-30887, doi:10.1074/jbc.M111.230391 (2011).
509
32 Finger, L. D. et al. The 3'-flap pocket of human flap endonuclease 1 is critical for
510
substrate binding and catalysis. J. Biol. Chem.284, 22184-22194 (2009).
511
33 Patel, N. et al. Proline scanning mutagenesis reveals a role for the flap
endonuclease-512
1 helical cap in substrate unpairing. J. Biol. Chem. 288, 34239-34248,
513
doi:10.1074/jbc.M113.509489 (2013).
514
34 Craggs, T. D., Hutton, R. D., Brenlla, A., White, M. F. & Penedo, J. C.
Single-515
molecule characterization of Fen1 and Fen1/PCNA complexes acting on flap
516
substrates. Nucleic Acids Res.42, 1857-1872, doi:10.1093/nar/gkt1116 (2014).
517
35 Orans, J. et al. Structures of human exonuclease 1 DNA complexes suggest a unified
518
mechanism for nuclease family. Cell 145, 212-223, doi:10.1016/j.cell.2011.03.005
519
(2011).
520
36 Niesen, F. H., Berglund, H. & Vedadi, M. The use of differential scanning
521
fluorimetry to detect ligand interactions that promote protein stability. Nat. Protocol.
522
2, 2212-2221 (2007).
523
37 Molina, D. M. et al. Monitoring drug target engagement in cells and tissues using the
524
cellular thermal shift assay. Science341, 84-87, doi:10.1126/science.1233606 (2013).
525
38 Moldovan, G.-L. & D'Andrea, A. D. How the fanconi anemia pathway guards the
526
genome. Annu. Rev. Genet. 43, 223-249, doi:10.1146/annurev-genet-102108-134222
527
(2009).
528
39 Yeo, J. E., Lee, E. H., Hendrickson, E. A. & Sobeck, A. CtIP mediates replication
529
fork recovery in a FANCD2-regulated manner. Hum. Mol. Genet. 23, 3695-3705,
530
doi:10.1093/hmg/ddu078 (2014).
531
40 Schlacher, K., Wu, H. & Jasin, M. A distinct replication fork protection pathway
532
connects Fanconi anemia tumor suppressors to RAD51-BRCA1/2. Cancer Cell 22,
533
106-116, doi:10.1016/j.ccr.2012.05.015 (2012).
534
41 Di Santo, R. Inhibiting the HIV integration process: past, present, and the future. J.
535
Med. Chem.57, 539-566, doi:10.1021/jm400674a (2014).
536
42 Dahl, G. & Akerud, T. Pharmacokinetics and the drug–target residence time concept.
537
Drug Discov. Today18, 697-707, doi:10.1016/j.drudis.2013.02.010 (2013).
538
43 Fehrmann, R. S. N. et al. Gene expression analysis identifies global gene dosage
539
sensitivity in cancer. Nat. Genet.47, 115-125, doi:10.1038/ng.3173 (2015).
540
44 Bolderson, E. et al. Phosphorylation of Exo1 modulates homologous recombination
541
repair of DNA double-strand breaks. Nucleic Acids Res. 38, 1821-1831,
542
doi:10.1093/nar/gkp1164 (2010).
543
45 Desai, A., Qing, Y. & Gerson, S. L. Exonuclease 1 is a critical mediator of survival
544
during DNA double strand break repair in non-quiescent hematopoietic stem and
545
progenitor cells. Stem Cells32, 582-593, doi:10.1002/stem.1596 (2014).
546
46 Tomimatsu, N. et al. Phosphorylation of EXO1 by CDKs 1 and 2 regulates DNA end
547
resection and repair pathway choice. Nat. Comm. 5, doi:10.1038/ncomms4561
548
(2014).
549
47 Tomimatsu, N. et al. Exo1 plays a major role in DNA end resection in humans and
550
influences double-strand break repair and damage signaling decisions. DNA Repair
551
11, 441-448, doi:10.1016/j.dnarep.2012.01.006 (2012).
19
Figure Legends
554
Figure 1. Compounds used in this study and crystal structure of hFEN1-336Δ in
555
complex with compound 1. (a) Schematic illustration of compounds 1–4 that are inhibitors
556
of hFEN1 phosphate diester hydrolysis. (b) Structure of hFEN1-336Δ nuclease active site
557
(PDB ID 5FV7) showing the seven highly-conserved acidic residues (grey and red spheres
558
represent carbonyl carbon and oxygen atoms, respectively), the two bound magnesium ions
559
(pink spheres), and compound 1. (c) Schematic representation of the metal-coordination
560
spheres of the two active site magnesium ions with distances reported in Ångstrom. (d)
561
Structure of hFEN1-336Δ in complex with product DNA (PDB ID 3Q8K) superimposed with
562
the hFEN1-336Δ in complex with compound 1 (protein not shown) to show that the inhibitor
563
and terminal nucleotide of the product DNA interact with the divalent magnesium ions and
564
share same pocket created by the protein. Metals are shown as pink spheres, terminal 5
565
nucleotide (–1) highlighted in cyan box, penultimate nucleotide of the product DNA (–2)
566
highlighted in the pink box, and compound 1 highlighted in the green box.
567
568
Figure 2. Differences in inhibition characteristics of the compounds. (a) hFEN1-catalyzed
569
reaction schematic showing double nucleotide unpairing at positions +1 and –1 (numbering
570
relative to scissile phosphate). (b,c) Reaction schemes of mixed inhibition (b) and competitive
571
inhibition (c) models. In each case, E, S, I and P represent enzyme, substrate, inhibitor and
572
product, respectively. Kic is the dissociation constant of I from free enzyme (competitive with
573
substrate) and Kiu is the dissociation constant of I from ES complex (uncompetitive). (d–f)
574
Nonlinear regression plots of normalized initial rates of reaction vs. substrate concentration
575
(open diamonds) for substrate DF1 at varying concentrations of compounds 1 (d; inset shows
576
equation for mixed inhibition model), 2 (e; inset shows legend correlating color/symbol to
577
inhibitor concentration) and 4 (f; inset shows equation for competitive inhibition model).
578
Error bars represent standard errors from global fitting of combined data from two triplicate
579
experiments (fits to alternative models are shown in Supplementary Figures S7–S9).
20 581
Figure 3: Effect of inhibitors on substrate binding assessed by fluorescence anisotropy
582
(FA) and FRET. (a) Typical FA titration data for hFEN1-R100A binding DF1 in the
583
presence of 10 mM Ca2+ (magenta, open triangles), 8 mM Mg2+ plus 100 µM compound 1
584
(blue, open circles) or 8 mM Mg2+ with 100 µM compound 2 (green, open squares); three
585
independent titrations were carried out for all FA binding experiments. (b) Representative
586
curves of typical normalized FRET binding data for DF1 and hFEN1-R100A. Experiments
587
were conducted in triplicate, but only one data set and curve is shown here for each titration.
588
Colours and symbols for each of the three plots are the same as in panel (a).
589
590
Figure 4: N-Hydroxyurea inhibitors prevent FEN1 reaction by blocking substrate
591
unpairing. CD spectra recorded at pH 7.5 and 20 °C of (a) tandem 2-aminopurine containing
592
substrate DF3 (illustrated schematically as inset, and Supplementary Figure 5g) alone in the
593
presence of 10 mM Ca2+ (blue) or 25 mM EDTA (grey) and the same substrate bound to
594
hFEN1-R100A in the presence of 10 mM Ca2+ (magenta) or 25 mM EDTA (green); (b) DF3
595
bound to hFEN1-R100A in the presence of Mg2+ plus excess compound 1 (cyan) or EDTA
596
plus excess compound 1 (red); (c) DF3 bound to hFEN1-R100A with excess compound 2 in
597
the presence of Mg2+ (orange) or EDTA (purple). Full DNA sequences are shown in
598
Supplementary Tables 5,6 and Supplementary Figure 5g. Plots in panels a–c are
599
representative of experiments repeated independently three times.
600
601
Figure 5. Cellular engagement and activity of hFEN1 inhibitors 1 and 4. (a)
602
Representative data of Western blot intensities from a melt curve for compound 1 ((+)
603
indicates treated sample, (–) indicates control sample). (b) Melt and shift curve of FEN1 in
604
intact SW620 cells with 100 µM 1 (purple), 4 (orange) and DMSO (control, black). (c) Ratio
605
of hFEN1 protein isothermal shifts in cells with respect to concentration of compounds 1
606
(purple) or 4 (orange) after exposure of cells to 50 °C to indicate magnitude of target
21
engagement of FEN1 in intact treated SW620 cells. (d) Dose-dependent sensitivity of SW620
608
cells to compound 1. (e) Sensitivity of HeLa cells stably expressing Fen1 (orange), Rad54b
609
(green) or non-targeting (black) shRNA to compound 1. (f) MMS sensitivity of SW620 cells
610
treated with continuous dose of 10 µM compound 1 (purple) or DMSO (control, black). (g)
611
Dose-dependent sensitivity of HeLa cells to compounds 1 and 4. (h) Typical Western blots
612
showing 1 induces a DNA damage response in a dose-dependent manner. (i) SW620 cells are
613
insensitive to deletion of FEN1 by siRNA, but accumulate DNA damage. Panels (b) and (c)
614
show data from three independent triplicate experiments, fitted globally (i.e. N = 3, n = 9)
615
with standard error. Panels (d)–(g) and (i) show the mean of three independent experiments ±
616
standard error.
617
22
Tables
[image:23.612.105.519.127.306.2]619
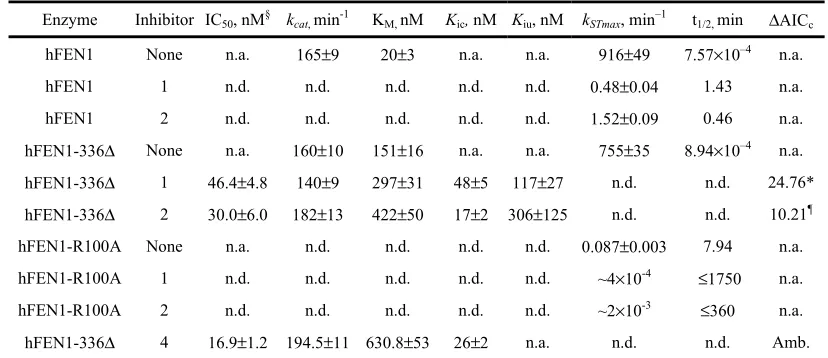
Table 1. Kinetic parameters in absence and presence of inhibitors.
620 621
622
§
IC50 values derived from rates at substrate concentration close to KM (100 nM). kSTmax is
623
maximal reaction rate under single turnover conditions, used to calculate the substrate
half-624
life (t1/2). ΔAICc is the difference between second order (corrected) Akaike Information
625
Criteria values between models; if ≥6, the likelihood the incorrect model was selected is P <
626
0.0001. ΔAICc for 1* and 2¶ compares non-competitive with mixed-inhibition models and
627
competitive with mixed-inhibition models, respectively. Mixed-inhibition is preferred for
628
both. For 4, competitive inhibition was the only model whose fit was not ambiguous (Amb.).
629
630 631
Enzyme Inhibitor IC50, nM§ kcat, min-1 KM, nM Kic, nM Kiu, nM kSTmax, min–1 t1/2, min ΔAICc
hFEN1 None n.a. 165±9 20±3 n.a. n.a. 916±49 7.57×10⁻⁴ n.a. hFEN1 1 n.d. n.d. n.d. n.d. n.d. 0.48±0.04 1.43 n.a. hFEN1 2 n.d. n.d. n.d. n.d. n.d. 1.52±0.09 0.46 n.a. hFEN1-336Δ None n.a. 160±10 151±16 n.a. n.a. 755±35 8.94×10⁻⁴ n.a.
hFEN1-336Δ 1 46.4±4.8 140±9 297±31 48±5 117±27 n.d. n.d. 24.76* hFEN1-336Δ 2 30.0±6.0 182±13 422±50 17±2 306±125 n.d. n.d. 10.21¶
hFEN1-R100A None n.a. n.d. n.d. n.d. n.d. 0.087±0.003 7.94 n.a. hFEN1-R100A 1 n.d. n.d. n.d. n.d. n.d. ~4×10⁻⁴ ≤1750 n.a. hFEN1-R100A 2 n.d. n.d. n.d. n.d. n.d. ~2×10⁻³ ≤360 n.a.
23 632
Online Methods
633
Protein Expression and Purification
634
hFEN1-Wild-type hFEN1 and the mutant hFEN1 protein, R100A, were expressed from
635
previously-prepared pET28b vectors containing the appropriate sequences for WT or R100A
636
and subsequently purified and stored as described previously.2 The C-terminally truncated
637
counterparts of wt-hFEN1 and R100A (i.e. hFEN1-Δ336 and R100A-Δ336 respectively) were
638
expressed from previously-prepared pET29b vectors containing the respective hFEN1-336
639
sequence in-frame with a PreScission protease site and (His)6-tag after residue 336 (removing
640
44 residues). The proteins were then purified and stored as previously described.2 T5FEN
641
protein was expressed and purified as previously described.29
642
643
hEXO1-To create a vector for the expression of truncated, wild-type hEXO1-352 bearing an
644
in-frame TEV protease site and C-terminal (His)6-tag, primers
(5'-645
gtctctcccatggggatacagggattgctac-3' and 5'-ggttctccccagctcttgaatgggcaggcatagc-3')—to amplify
646
hEXO1-352 DNA bearing leader sequences necessary for ligation independent cloning (LIC)
647
with SmaI-digested pMCSG28 vector (DNASU plasmid repository)—were utilized according
648
to protocol.48 The DNA sequence encoding hEXO1-352-TEV-(His)6-Stop was then subcloned
649
from the pMCSG28-hEXO1-352 vector into a pET21a vector using the NdeI and NotI
650
restriction sites with appropriate primers (ggaattccatatggggatacagggattgctac-3' and
5'-651
ggataagaatgcggccgcttaatgatgatgatggtggtgcc-3'). The hEXO1-352-TEV-(His)6 protein was
652
expressed in BL21(DE3)-RIPL E. coli using autoinduction media as described. The protein
653
was purified by Co2+-immobilized affinity and anion exchange chromatography in a manner
654
analogous to that described previously for hFEN1.2 Fractions containing
hEXO1-352-TEV-655
(His)6 were pooled, concentrated using an Amicon ultrafiltration device with a 5,000 MWCO
656
membrane and then dialyzed into 2X 2L 50 mM Tris pH 7.0, 50 mM NaCl, 5 mM DTT, 1
657
mM EDTA, 5% glycerol containing 1000U of TurboTEV (BioVision) to remove the (His)6
-658
tag. The dialysate was treated with MagneGST™ glutathione particles to remove the
24
TurboTEV, and then the protein was further purified using a Heparin affinity column and a
660
salt gradient from 0 to 1 M NaCl as described previously.35 hEXO1-352-containing fractions
661
were pooled, concentrated by ultrafiltration as before and then applied to a 16/60 Sephacryl™
662
S-100 HR (GE Lifesciences) column. Fractions containing the protein were concentrated and
663
finally stored at 100 µM at –20 °C in 50 mM Tris pH 8.0, 50 mM NaCl, 1 mM DTT, 50 µM
664
EDTA, 50% v/v glycerol.
665
666
PCNA-The vector for human PCNA sub-cloned in-frame with a C-terminal-(His)8-tag into
667
pET41b using the NdeI and XhoI restricition sites was a kind gift of Professor Binghui Shen
668
(Beckman Research Institute, City of Hope). The hPCNA-(His)8 protein was expressed
669
overnight at 37 °C in BL21(DE3)-RIPL E. coli using autoinduction media as described.49 The
670
cells were collected by centrifugation at 6000 g and resuspended in ice-cold PBS buffer. The
671
cells were pelleted again and the supernatant was removed. The cell pellet was resuspended in
672
Buffer A (25 mM Tris pH=7.4, 0.02% NaN3, 5 mM imidazole, 2 mM β-mercaptoethanol)
673
containing 1M NaCl, 1X EDTA-free protease inhibitor cocktail, and 0.1 mg/mL lysozyme.
674
After cell lysis by freeze thaw and sonication, Buffer A containing 1% Tween-20 (10% of the
675
total volume of the lysate) was added. The lysate was clarified by centrifugation at 30,000 g
676
for 30 minutes at 4 °C. The supernatant was then applied to Co2+-TALON immobilized
677
affinity column and washed with 5 column volumes of Buffer A. The column was then
678
washed with 5 CV of Buffer A containing, 200 mM NaCl, and 0.01% NP-40. The protein was
679
then eluted in buffer B (25 mM Tris pH=7.4, 0.02% NaN3, 200 mM NaC,l 250 mM
680
imidazole, 2 mM β-mercaptoethanol, 0.01% NP-40%). The eluate was directly applied to two
681
tandem 5 mL Hi-Trap Q columns and further purified as described.50 Briefly, the fractions
682
containing hPCNA were pooled and dialysed 2 X 2L into Buffer C (25 mM KPO4 pH=7.0,
683
0.01% NP-40%, 10% glycerol, 10 mM NaHSO3, 5 mM DTT, 0.02% NaN3). The dialysate
684
was passed through a 5 mL Hi-Trap S HP column that was pre-equilibrated with Buffer C to
685
remove impurities, but hPCNA was found exclusively in the flow-through. The flow-through
25
was loaded onto a hydroxylapatite column (BioSepra HA Ultrogel, 11 cm by 2.6 cm) and then
687
eluted using a 20-column volume gradient from 0.025 and 0.5 M KPO4 in Buffer C. The
688
eluate was dialysed 2 X 2Lt into Buffer D (25 mM potassium phosphate pH 7.0, 1.5 M
689
(NH4)2SO4, 0.02% NaN3). The dialysate was centrifuged at 3,300 g for 10 minutes at 4 °C to
690
remove any precipitate and then loaded onto a HiPrep Phenyl-Sepharose FF (high sub)
691
column and eluted using a 20 column volume inverse gradient using Buffer D and Buffer E
692
(25 mM potassium phosphate pH 7.0, 10% glycverol, 0.02% NaN3). The isolated PCNA was
693
then dialysed into Buffer F (100 mM HEPES pH=7.5, 200 mM KCl, 10 mM DTT, 0.1 mM
694
EDTA, 0.04% NaN3), and concentrated to provide 200 µM PCNA trimer (i.e. 600 µM
695
monomer) before the addition of glycerol to 50% v/v and storage at –20 °C.
696
697
KlXRN1-The vector corresponding to residues 1–1245 of Kluyveromyces lactis Xrn1 that was
698
subcloned in-frame with a C-terminal hexahistidine tag into pET-26b was a kind gift of
699
Professor Liang Tong laboratory (Columbia University). The protein was expressed in
700
Rosetta E.coli according to protocol51 and purified as described for hFEN1. Once purified, the
701
protein was stored in 20 mM Tris pH = 7.5, 200 mM NaCl, 2 mM DTT and 50% glycerol.
702
The purity of all proteins used was assessed by SDS-PAGE (Supplementary Figure 20).
703
704
Crystallisation and Structure Determination – The C-terminally truncated protein was
705
crystallized using the hanging drop vapor diffusion method. Briefly, the protein was
706
concentrated to approximately 8 mg/mL in a buffer containing 50 mM Tris pH 7.5, 200 mM
707
NaCl, 10 mM MgCl2, 1 mM TCEPwith 5 mM inhibitor 1 added. The crystallization well
708
contained 25% PEG 3350, 0.1 M MOPS pH 7.0, 5% 2-propanol and 2% glycerol. Crystals
709
appeared after 3 days at room temperature. Data were collected at the ERSF synchrotron on
710
station ID23 (T = 100 K). Data were processed and scaled using the XDS and SCALA
711
software packages.52 The crystals diffracted to 2.8 Å resolution, belong to Space Group P1
712
and having unit cell dimensions of a = 43.3Å, b = 50.2 Å, c = 66.9 Å, α = 102.1°, β = 94.0°,
713
γ = 90.7°. The structure was solved by molecular replacement, model rebuilding was
26
conducted using COOT53 and the structure was refined using the BUSTER software.54 The
715
final model has good geometry with 92% of residues in the favored region of the
716
Ramachandran plot, 7% in the allowed regions and 1% in the disallowed regions as defined
717
by PROCHECK.52 At convergence a final crystallographic R-factor of 23.3% was achieved.
718
Full data and refinement statistics are shown in Supplementary Table 1 and ligand electron
719
density in Supplementary Figure 1.
720
721
Isothermal Titration Calorimetry (ITC)–Binding affinities of wt hFEN1, hFEN1-336Δ and
722
hFEN1-R100A for compounds 1 and 2 were measured using either a VP-ITC
723
microcalorimeter (GE Healthcare) or NANO-ITC (TA Instruments). The appropriate protein
724
was exchanged from storage buffer into 100 mM KCl, 1 mM DTT, 50 mM HEPES pH 7.5
725
containing 8 mM MgCl2 or 10 mM CaCl2 using a HiPrep 26/10 desalting column at 4 °C.
726
Subsequently, the protein was dialyzed overnight at 4 °C against the same buffer composition.
727
In all cases, the dialysate was used prepare a solution with final protein concentration 18 µM
728
(based on A280 using extinction coefficients calculated using the ExPASy ProtParam tool,
729
http://web.expasy.org/protparam/) and final inhibitor concentration 200 µM, diluted from
730
DMSO stock solution to a final DMSO concentration of 1%. Twenty-five injections were
731
performed with 180 s spacing time at 25 °C. Titration traces were integrated by NITPIC55 and
732
the resultant curves were globally fit by SEDFIT.56 The figures were prepared using GUSSI
733
(http://biophysics.swmed.edu/MBR/software.html).
734
735
Synthesis and Purification of DNA constructs – The DNA oligonucleotides detailed in
736
Supplementary Table 5, including those synthesised with 5 -fluorescein-CE-phosphoramidite
737
(6-FAM), internal dSpacer-CE-phosphoramidite (dS) or containing site-specific
2-738
aminopurine (2AP) substitutions, were purchased with HPLC purification from DNA
739
Technology A/S (Risskov, Denmark). MALDI–TOF spectrometry confirmed experimental
740
molecular weights were all within 3 Da of calculated values (data not shown). The
27
concentration of individual oligonucleotides was determined by measuring the absorbance at
742
260 nm (20 °C), using an extinction coefficient (ε260) calculated with OligoAnalyzer 3.1
743
(https://eu.idtdna.com/calc/analyzer). Heteroduplex substrates were prepared by heating the
744
appropriate flap (or exo) strand with the complementary template in a 10:11 ratio at 95 °C for
745
5 min in 100 mM KCl, 50 mM HEPES pH 7.5 with subsequent cooling to room temperature
746
(Supplementary Table 6 and Supplementary Figure 5).
747
748
Steady-state kinetic experiments – Reaction mixtures containing twelve different
749
concentrations of FAM-labeled DF1 (Supplementary Figure 5a) substrate were prepared in
750
reaction buffer (RB; 55 mM HEPES pH 7.5, 110 mM KCl, 80 mM MgCl2, 0.1 mg/mL bovine
751
serum albumin, 1 mM DTT) and incubated at 37 °C for 10 min. Reactions were initiated by
752
the addition of hFEN1-336Δ in RB. Reactions were sampled at seven time intervals between
753
2–20 min and quenched with excess EDTA (250 mM) with reaction progress being monitored
754
by dHPLC equipped with a fluorescence detector (Wave® fragment analysis system,
755
Transgenomic UK) as described.32 All reactions were independently repeated four times.
756
Initial rates (v0, nM min–1) were determined by linear regression of plots of the amount of
757
product concentration versus time up to 10% product formation. Kinetic parameters kcat and
758
KMwere determined by generalized nonlinear least squares using a Michaelis–Menten model
759
(Equation 1), from plots of normalized initial rates (v0/[E]0, min
–1
) as a function of substrate
760
concentration. The error distribution was assumed to be Gaussian, but to account for the
761
unequal variance with increasing substrate concentration the variance was weighted to 1/Y2.
762
All graph fitting and statistical analyses were done using GraphPad Prism 6.04 (GraphPad
763
Software, Inc.).
764
Equation 1 765
766
Inhibition Studies – The steady-state kinetic parameters of hFEN1-336Δ with DF1 were
767
determined as above at various concentrations of 1, 2 and 4 (0, 5, 10, 50, 100, 500, 1000 nM)