This is a repository copy of Modelling, simulation and analysis of intensified regenerator for solvent based carbon capture using rotating packed bed technology.
White Rose Research Online URL for this paper: http://eprints.whiterose.ac.uk/118331/
Version: Accepted Version Article:
Joel, A.S., Wang, M. orcid.org/0000-0001-9752-270X, Ramshaw, C. et al. (1 more author) (2017) Modelling, simulation and analysis of intensified regenerator for solvent based carbon capture using rotating packed bed technology. Applied Energy, 203. pp. 11-25. ISSN 0306-2619
https://doi.org/10.1016/j.apenergy.2017.05.157
Article available under the terms of the CC-BY-NC-ND licence (https://creativecommons.org/licenses/by-nc-nd/4.0/).
[email protected] https://eprints.whiterose.ac.uk/
Reuse
This article is distributed under the terms of the Creative Commons Attribution-NonCommercial-NoDerivs (CC BY-NC-ND) licence. This licence only allows you to download this work and share it with others as long as you credit the authors, but you can’t change the article in any way or use it commercially. More
information and the full terms of the licence here: https://creativecommons.org/licenses/
Takedown
If you consider content in White Rose Research Online to be in breach of UK law, please notify us by
1
Modelling, Simulation and Analysis of Intensified
1
Regenerator for Solvent based Carbon Capture using
2
Rotating Packed Bed Technology
3
Atuman S. Joela, Meihong Wangb*, Colin Ramshawb, Eni Okob
4 5
aProcess/Energy Systems Engineering Group, School of Engineering, University of Hull, HU6 7RX, UK
6
bDepartment of Chemical and Biological Engineering, University of Sheffield, S1 3JD, UK
7
*Corresponding author. Tel: + 44(0) 1142 227160. ; Email address: [email protected]
8 9
ABSTRACT 10
Intensified regenerator/stripper using rotating packed bed (RPB) for regeneration of
11
rich-MEA solvent in post-combustion CO2 capture with chemical absorption process
12
was studied through modelling and simulation in this paper. This is the first
13
systematic study of RPB regenerator through modelling as there is no such
14
publication in the open literature. Correlations for liquid and gas mass transfer
15
coefficients, heat transfer coefficient, liquid hold-up, interfacial area and pressure
16
drop which are suitable for RPB regenerator were written in visual FORTRAN as
17
subroutines and then dynamically linked with Aspen Plus® rate-based model to
18
replace the default mass and heat transfer correlations in the Aspen Plus®. The
19
model now represents intensified regenerator/stripper. Model validation shows good
20
agreement between model predictions and experimental data from literature.
21
Process analyses were performed to investigate the effect of rotor speed on the
22
regeneration efficiency and regeneration energy (including motor power). The rotor
23
speed was varied from 200 to 1200 rpm, which was selected to cover the validation
24
range of rotor speed. Impact of reboiler temperature on the rate of CO2 stripping was
25
also investigated. Effect of rich-MEA flow rate on regeneration energy and
26
regeneration efficiency was studied. All the process analyses were done for wide
27
range of MEA concentration (32.6 wt%, 50 wt% and 60 wt%). Comparative study
28
between regenerator using packed column and intensified regenerator using RPB
29
was performed and the study shows a size reduction of 9.691 times. This study
30
indicates that RPB process has great potential in thermal regeneration application.
31
Keywords: Post-combustion CO2 capture, MEA solvent, Process Intensification (PI),
32
Rotating Packed Bed (RPB), Process Modelling, Process simulation 33
1 Introduction 34
1.1 Background 35
Environmental concern has posed many questions as to the impact of greenhouse
36
gas to those changes currently noticed in world climate and the future dangers that
2
will be expected if mitigation measures are not put in place. Combustion of coal and
38
petroleum accounts for the majority of the anthropogenic CO2 emissions. Petroleum
39
is mostly used as a transportation fuel for vehicles while coal is used mostly for
40
electricity generation, for instance about 85.5% of coal is used for electricity
41
generation in 2011 in the UK [1]. Albo et al. [2] stated that among the greenhouse
42
gases, CO2 contributes to more than 60% of global warming. Statistics from World
43
Metrological Organisation (WMO) showed the amount of CO2 in the atmosphere
44
reached 393.1 ppm in 2012. The WMO report also showed that the amount of CO2 in
45
the atmosphere has increased on average by 2 ppm per year for the past 10 years.
46
Recent report by CO2-Earth [3] shows that as at 8 April 2017 CO2 atmospheric
47
concentration stood at 407.78 ppm, this increased atmospheric concentration of CO2
48
affects the radiative balance of the earth surface [4].
49
In order to meet the set target of 50% emission reduction by 2050 as compared to
50
the level of 1990 as proposed by Intergovernmental panel on climate change (IPCC)
51
[5], carbon capture and storage (CCS) is an important option for that target to be
52
achieved. The International Energy Agency (IEA) [6] identifies CCS as a significant
53
and low-cost option in fighting climate change. The most matured CO2 capture
54
technology is post-combustion CO2 capture (PCC) based on chemical absorption as
55
reported in Mac Dowell et al. [7] which is also believed to be a low-risk technology
56
and promising near-term option for large-scale CO2 capture.
57
PCC for coal-fired power plants using conventional packed columns has been
58
reported by many authors. Dugas [8] carried out pilot plant study of PCC in the
59
context of fossil fuel-fired power plants. Lawal et al. [9-11] carried out dynamic
60
modelling and process analysis of CO2 absorption for PCC in coal-fired power
61
plants. In all these studies, one of the identified challenges to the commercial roll-out
62
of the technology has been the high capital and operating costs which has an
63
unavoidable impact on electricity cost. Systematic study of aqueous
64
monoethanolamine (MEA)-based CO2 capture process looking at the
techno-65
economic assessment of the MEA process and its improvements was reported by Li
66
et al. [12]. Oh et al. [13] study energy minimization of MEA-based CO2 capture
67
process it was found that Flue gas splitting gives a significant reduction of energy
68
consumption. Solvent performance comparison for a large scale pulverized coal
69
power plant was reported by Sharifzadeh et al. [14]. Hanak et al. [15] reported
70
efficiency improvements for the coal-fired power plant retrofit with CO2 capture plant
71
using chilled ammonia process showing efficiency penalty reduced to 8.7% Also
72
Zhao et al. [16] using mixed solvent for 650 MW power plant reported that the net
73
power efficiency penalty was reduced from 9.13% to 7.66%. Approaches such as
74
heat integration, inter-cooling among others could reduce the operating cost slightly.
75
However, they limit the plant flexibility and will make operation and control more
76
difficult [17]. Process intensification (PI) has the potential to meet this challenge
[18-77
20].
3
Study of intensified absorber was reported in Joel et al [21,22] and Agarwal et al. 79
[23]. Joel et al [21] reported 12 times volume reduction for absorber if using RPB
80
technology as compared to packed column. Results from Agarwal et al. [23]
81
indicated 7 times volume reduction when using RPB as compared to conventional
82
packed column. The study by Joel et al. [21] uses aqueous MEA solvent while
83
Agarwal et al. [23] uses diethanolamine (DEA) as solvent. This is the main reason for
84
the differences in size reduction since faster reaction rate means shorter residence
85
time and slower reaction rate means longer residence time required for the same
86
capture rate. Jassim et al. [24] and Cheng et al. [25] reported experimental studies
87
on intensified regenerator using RPB. Zhao et al. [26] study the mass transfer
88
performance of CO2 capture in rotating packed bed and Chamchan et al. [27]
89
compared RPB and PB absorber in pilot plant.
90
Figure 1 is a typical process flow diagram of an intensified regenerator using RPB for
91
solvent regeneration. The flowsheet was used by Jassim et al. [24] and Cheng et al. 92
[25] for experimental study. One of the operational benefits of using RPB is its ability
93
to be operated at higher gas and/or liquid flow rates owing to the low tendency of
94
flooding compared to that in the conventional packed bed [28]. Another benefit of
95
using RPB is its better self-cleaning, avoidance of blocking in the system, and being
96
unaffected by a moderate disturbance in its orientation [29].
97
[image:4.595.163.428.385.603.2]98
Figure 1 Schematic diagram of an RPB regenerator
99 100
Nomenclature 101
a effective interfacial area (m2/m3)
activity of species i in a solution
at total specific surface area of packing (m2/m3)
4
parameter for Chen et al. [24] and Chen [25] correlations for liquid and gas film
mass transfer coefficients (= 3000 m2/m3)
c width of wire mesh packing opening (mm)
concentration of component i
heat capacity for component i
d wire diameter of wire mesh packing (mm)
D column diameter (m)
diffusivity of gas (m2/s)
diffusivity of liquid (m2/s)
activation energy (kJ/mol)
dp packing size (m)
G volumetric gas flow rate (m3/s)
Gm Gas molar flowrate (kmol/s)
gc gravitational acceleration or acceleration due to centrifugal field (m2/s)
go characteristic acceleration value (100 m2/s)
H height of packing (m)
hG gas phase specific molar enthalpy (J/kmol)
hL liquid phase specific molar enthalpy (J/kmol)
interfacial heat transfer coefficient (W/m2 K)
heat of desorption of CO2 (J/kmol)
heat of vaporisation of H2O (J/kmol)
gas film mass transfer coefficient (m/s)
overall mass transfer coefficient (1/s)
pre-exponential factor (kmol/m3.s)
liquid film mass transfer coefficient (m/s)
L Liquid mass flowrate per tangential area (kg/m2/s)
Lm Liquid molar flowrate (kmol/s)
MEA Monoethanolamine
molar fluxes for component i (kmol/m2 s)
motor power (kilowatts)
volumetric flow rate of liquid (m3/s)
r radial position (m)
ideal gas constant (J kmol-1 K-1)
reaction rate for reaction j
5 inner radius of the RPB (m)
outer radius of the RPB (m)
radius of the stationary housing of the RPB (m)
T temperature (K) t residence time (s)
superficial liquid velocity (m/s)
superficial gas velocity (m/s)
Uo characteristic superficial liquid velocity (1cm/s)
V volume of the liquid films in the RPB (m3)
volume inside the inner radius of the RPB (m3)
volume between the outer radius of the bed and the stationary housing
(m3)
total volume of the RPB (m3)
Component molar fraction in liquid phase Component molar fraction in gas phase
mole fraction of CO2 in inlet gas stream
mole fraction of CO2 in outlet gas stream
axial height of the RPB (m)
Greek letters
102
reaction order of species i in reaction j
porosity of packing, m3/m3
liquid holdup (m3/m3)
viscosity (Pa.s)
liquid density (kg/m3)
gas density (kg/m3)
liquid surface tension (N/m)
critical surface tension (N/m)
surface tension of water (N/m)
kinematic liquid viscosity (m2/s)
kinematic gas viscosity (m2/s)
angular velocity (rad/s)
Dimensionless groups
103
6 liquid Grashof number
gas Reynolds number
liquid Reynolds number
liquid Schmidt number
liquid Webber number
theoretical probability of liquid uncaptured by fibers ( )
1.2 Motivation 104
Over 8,000 tonnes of CO2 per day will be released from a typical 500 MWe
105
advanced supercritical coal fired power plant operating at 46% overall net power
106
plant efficiency (LHV basis) [30]. This huge volume of flue gas will require big column
107
size. Lawal et al. [9] reported dynamic modelling study of a 500 MWe sub-critical
108
coal-fired power plant using the packed column (i.e. conventional technology). From
109
the study, one regenerator of 17m in packing height and 9 m in diameter will be
110
needed for regeneration of rich-MEA solvent. This huge packed column will mean
111
higher capital and operating costs, therefore a technological option leading to smaller
112
equipment size is very important. Kothandaraman et al. [31] reported that in
113
conventional packed tower majority (approximately 62%) of the energy consumed
114
during the CO2 capture process was used for the solvent regeneration, therefore it is
115
necessary to look for technological options that will reduce this energy requirement.
116
1.3 Novel contributions of the paper 117
This is the first systematic study on RPB regenerator through modelling as there is
118
no such publication in the open literature. There are four novel aspects in this paper:
119
(a) A new first principle model for intensified regenerator using RPB was developed
120
which was implemented in Aspen Plus® rate-based model by replacing different
121
correlations for mass transfer, interfacial area and liquid hold-up. Steady state
122
validation of the intensified regenerator is performed using experimental data from
123
Jassim et al. [24] and Cheng et al. [25]. (b) Process analysis of the intensified
124
regenerator involving different process scenarios were carried out to gain insights for
125
process design and operation. These process scenarios are: (i) the impact of
126
rotational speed on the regeneration efficiency and regeneration energy at fixed
127
intensified regenerator size and MEA flow rate was studied; (ii) the effect of
rich-128
MEA solvent flow rate on the regeneration efficiency and regeneration energy was
129
explored; (iii) the effect of reboiler temperature on regeneration efficiency and
130
regeneration energy was explored. (c) Comparative study was performed between
131
intensified regenerator using RPB and conventional regenerator using packed bed. It
132
was found that there is 9.69 times reduction in size under the same conditions which
133
means decrease in equipment capital cost. (d) The study were done over wide range
7
of MEA concentrations (32.6 wt%, 50 wt% and 60 wt%) and the energy consumption
135
per ton of CO2 is within the range of conventional packed column.
136
2 Model Development 137
Model for intensified regenerator using RPB does not exist in any commercially
138
available model library (including Aspen Plus®). To model intensified regenerator
139
using RPB, the default mass/heat transfer correlations in the Aspen Plus® rate-based
140
model have to be replaced with subroutines written in Intel® visual FORTRAN. The
141
new model now represents an intensified regenerator using RPB. The new steady
142
state model is still developed based on two-film theory Joel et al. [21]. The
143
correlations include: liquid phase mass transfer coefficient given by Chen et al. [32],
144
gas-phase mass transfer coefficient given by Chen [33], interfacial area correlation
145
estimated by Luo et al. [34] and liquid hold-up correlation given by Burns et al. [35].
146
Dry pressure drop expression was used since it accounts in an additive manner of
147
the drag and centrifugal forces, the gas-solid slip and radial acceleration effect [36].
148
2.1 Main governing equations 149
The main governing equations include material and energy balance equations.
150
Momentum balance is reflected in the pressure drop relation presented in Section
151
2.7.
152
2.1.1 Gas and liquid phase material balances 153
Assuming steady state conditions, material balances for gas and liquid phase in the
154
RPB is described by Equations 1 and 2. Due to flow directions in RPB, the equations
155
are based on numerical discretisation in the radial direction. Also, the term is
156
described preferably as tangential area to differentiate it from cross sectional area as
157
it varies from section to section along the radial direction.
158
Material balances for gas phase:
159
160
Material balances for liquid phase:
161
162
The equation includes component molar flow balances (represented by the
163
derivative terms) across each radial segment per tangential area, interfacial molar
164
fluxes ( ) and liquid phase reaction rate ( ). By this, reactions are deemed to
165
occur only in the liquid phase and ionic components therefore only exist in the liquid
166
phase.
8 2.1.2 Gas and liquid phase energy balances 168
Energy balances for gas and liquid phase is given by Equations 3 and 4 respectively
169
[37]
170
Energy balances for gas phase:
171
172
Energy balances for liquid phase:
173
174
The equations include interfacial heat transfer, , heat released due to
175
CO2 desorption from the loaded MEA solvent, and heat released or
176
absorbed due to H2O condensation or vaporization, [17]. Due to the
177
relatively higher temperature of the stripper compared to ambient condition, heat
178
losses ( and ) are also taken into account.
179
2.2 Physical property 180
Electrolyte Non-Random-Two-Liquid (ElecNRTL) activity coefficient model in Aspen
181
Plus® was used to describe the vapour–liquid equilibrium, the chemical equilibrium
182
and the physical properties of the system. The equilibrium constants for reactions
5-183
9 are calculated from the standard Gibbs free energy change, the equilibrium
184
reactions are assumed to occur in the liquid film and kinetic reactions equations and
185
parameters are obtained from AspenTech [38]. The electrolyte solution chemistry
186
which is used in property calculation is modelled with chemistry model and all the
187
ionic reactions are assumed to be in chemical equilibrium as shown in Equations 5-9
188
[38].
189
Equilibrium H O H O OH (5)
190
Equilibrium CO H O H O HCO (6)
191
Equilibrium HCO H O H O CO (7)
192
Equilibrium MEAH H O MEA H O (8)
193
Equilibrium MEACOO H O MEA HCO (9)
194
Kinetic reactions used for the intensified stripping calculation is specified by
195
Equations 10-13 in the reaction part of the regenerator model in the Aspen Plus.
196
Kinetic CO OH HCO (10)
197
Kinetic HCO CO OH (11)
198
Kinetic MEA CO H O MEACOO H O (12)
9
Kinetic MEACOO H O MEA CO H O (13)
200
Power law expression Equation 14 is used for the rate-controlled reactions. The
201
kinetic parameters for reactions in Equations 10-13 were listed in Table 1
202
203
Table 1 Constants for power law expressions for the absorption of CO2 by MEA [39]
204
Reaction No. (kmol/m3.s) , kJ/mol
10 1.33e+17 55.38
11 6.63e+16 107.24
12 3.02e+14 41.2
13 6.56e+27 95.24
205
2.3 Liquid phase mass transfer coefficient 206
An expression was introduced by Tung and Mah [40] based on penetration theory to
207
describe the liquid mass transfer behaviour in the RPB.
208
209
This correlation was developed without considering the Coriolis force or the effect of
210
the packing geometry. This is why there is a need for an alternative correlation for
211
liquid phase mass transfer coefficient.
212
Chen et al. [32] developed liquid phase mass transfer correlation considering the end
213
effect and packing geometry. The correlation was found to be valid for different sizes
214
of the RPBs and for viscous Newtonian and non-Newtonian fluids. Because of these
215
advantages, Equation 16 is selected for calculating the liquid phase mass transfer
216
coefficient, and also findings from Joel et al. [22] suggested the use of Equation 16
217
because of it smaller error prediction.
218 219
220
221 222
2.4 Gas phase mass transfer coefficient 223
Onda et al. [41] correlation for calculating gas-side mass transfer coefficient
224
(Equation 17) was developed for conventional packed column. Sandilya et al. [42]
225
suggested that the gas rotates like a solid body in the rotor because of the drag force
10
caused by the packing, which means that gas-side mass transfer coefficient should
227
be similar to that in a conventional packed column, but the end effect and packing
228
effect were not considered, this makes the authors to select Equation 18 proposed
229
by Chen [33] instead of Equation 17.
230
231
Chen [33] presented local gas-side mass transfer coefficient correlation using
two-232
film theory for RPB. Equation 18 for calculating the gas phase mass transfer
233
coefficient was used in the model because it accounts for the effect of rotation of the
234
RPB.
235
236 237
2.5 Total gas-liquid interfacial area 238
Total gas-liquid interfacial area correlation for conventional packed column was
239
developed by Onda et al. [41] as shown in Equation 19. It can be modified to account
240
for the effect of rotation of the bed but because it is not originally designed for RPB
241
and also it was not designed for different types of packing, Equation 20 developed by
242
Luo et al [34] was selected.
243
244
Luo et al. [34] studied gas-liquid effective interfacial area in an RPB considering
245
different types of packing, also taking into account the effect of fibre diameter and
246
opening of the wire mesh.
247
248
2.6 Liquid hold-up 249
Liquid holdup correlation given by Burns et al. [35] was used. The correlation is
250
based on data obtained through measurement of electrical resistance across
251
sections of an RPB. The study showed that the liquid hold-up is approximately
252
inversely proportional to the local packing radius and is largely independent of gas
253
flow up to the flooding point and also liquid viscosity has only a weak influence on
254
hold-up [35].
255
11
257
258
2.7 Dry pressure drop expression 259
Semi-empirical dry pressure drop expression was given by Llerena-Chavez and
260
Larachi [36]. The correlation was developed based on Ergun-type semi-empirical
261
relationships in which the gas-slip and radial acceleration effects, the laminar and
262
inertial drag effects and the centrifugal effect were aggregated additively to form the
263
pressure drops correlation in the RPB [36].
264
ln
265
266
where is a corrective function given as:
267
268
a, b, and c are fitting parameters given as:
269
270
2.8 Power consumption by RPB stripper motor 271
The amount of power consumed by motor for rotating RPB absorber and stripper is
272
calculated using the correlation proposed by Singh et al. [43]. The correlation was
273
used to account for all the frictional losses and also the power required for
274
accelerating the liquid entering the packing bed to the rotational speed at the outer
275
radius. It is important to note that frictional losses are highly dependent upon the
276
design of the machine and cannot be predicted without advance knowledge of the
277
design (i.e., type of bearings, direct or pulley drive, etc.) [43].
278
12
2.9 Modelling and simulation methodology 280
The procedure used in this paper for modelling and simulation of the RPB is shown
281
in Figure 2 and summary of the model parameters and correlations were presented
282
in Table 2 283
[image:13.595.112.454.165.528.2]284
Figure 2 Methodology used in this paper [21,22]
[image:13.595.65.512.545.773.2]285
Table 2 Summary of model parameters
286
Parameters Correlations or values
Jassim et al Cheng et al
Model geometry
ri (m) 0.156 0.076
ro (m) 0.398 0.160
h (m) 0.025 0.020
surface area of the packing per unit volume of the bed (m2/m3)
2132 803
Liquid phase mass transfer coefficient See Equation 16
Gas phase mass transfer coefficient See Equation 18
Total gas-liquid interfacial area See Equation 20
Liquid holdup See Equation 21
Dry pressure drop expression See Equation 23
Motor power See Equation 25
Aspen Plus
®Rate Based
Model
Writing the user defined correlations
in Visual FORTRAN Compiler
Linking Visual FORTRAN
compiler
with Aspen Plus model
Running the simulation
Model Validation
13 3 Model Validation
287
3.1 Model validation using experimental data from Jassim et al. [24] 288
The experimental data used for the model validation was obtained from Jassim et al. 289
[24]. From their experiments, rich-MEA concentration of 32.9 wt%, 35.7 wt%, 30.8
290
wt%, 57.4 wt% and 52 wt% were selected for the validation study. The equipment
291
specifications and process input conditions for the validation study are shown in
292
Tables 3 and 4. The study was done under two different rotor speeds 800 rpm and
293
1000 rpm.
[image:14.595.69.357.280.400.2]294
Table 3 RPB stripper packing specifications used by Jassim et al. [24]
295
Description Value
RPB outer diameter 0.398 m
RPB inner diameter 0.156 m
RPB axial depth 0.025 m
Packing specific surface area 2132 m2/m3
[image:14.595.67.510.446.645.2]Packing porosity 0.76
Table 4 Input process conditions for Run 1 to Run 5 [24]
296
Runs
Run 1 Run 2 Run 3 Run 4 Run 5
Rotor speed (RPM) 800 800 800 1000 1000
Rich-MEA temperature (oC) 67.100 69.000 70.000 57.200 58.400
Rich-MEA pressure (kPa) 101.325 101.325 101.325 101.325 101.325 Rich-MEA flow rate (kg/s) 0.200 0.200 0.400 0.400 0.200
Rich-MEA composition (wt. %) H2O
CO2
MEA
58.116 8.984 32.900
54.013 10.287 35.700
61.536 7.664 30.800
25.142 17.458 57.400
32.895 15.105 52.000
Rich-MEA CO2 loading (mol CO2
/mol MEA)
0.3790 0.3999 0.3454 0.4221 0.4030
14
Table 5 Simulation results compared to experimental data [24] for Run 1 to Run 5
298
Runs
Run 1 Run 2 Run 3 Run 4 Run 5
Rotor speed (RPM) 800 800 800 1000 1000
Experimental measurement
Lean-MEA CO2 loading (mol/mol) 0.321 0.329 0.329 0.403 0.334
Model prediction
Lean-MEA CO2 loading (mol/mol) 0.316 0.295 0.298 0.355 0.320
Relative error (%) 1.558 10.334 9.422 11.911 4.192
299
Model validation is shown in Table 5 which gives percentage error prediction of not
300
more than 12 % on the lean-MEA CO2 loading. The lean-MEA CO2 loading was
301
evaluated on mole basis as shown in Equation 26.
302
Loading Moles of all MEA carrying speciesMoles of all CO carrying species 303
Jassim et al. [24] didn’t include experimental results on reboiler duty, therefore the
304
authors cannot compare model predictions with experimental tests.
305
3.2 Model validation based on experimental data from Cheng et al. [25] 306
Cheng et al [25] carried out experimental study on the thermal regeneration of
307
alkanolamines solutions in a RPB using 30 wt% MEA aqueous solution loaded with
308
CO2 and a CO2 - loaded aqueous solution consisting of 20 wt% diethylenetriamine
309
and 10 wt% piperazine. For the purpose of this study, experimental data with 30 wt%
310
MEA aqueous solution was used for model validation. RPB stripper specifications
311
and process input conditions for the model are shown in Tables 6 and 7.
312
Table 6 RPB stripper packing specifications used by Cheng et al [25]
313
Description Value
RPB outer diameter 0.160 m
RPB inner diameter 0.076 m
RPB axial depth 0.020 m
Packing specific surface area 803 m2/m3
[image:15.595.71.355.592.712.2]15
Table 7 Input process conditions for different reboiler temperature [25]
314
Variable Reboiler Temperature
105 oC 115 oC 120 oC
Rotor speed (RPM) 900 900 900
Rich-MEA temperature (oC) 96.6 97 97
Rich-MEA pressure (kPa) 202.65 202.65 202.65
Rich-MEA flow rate (mL/min) 400 400 400
Rich-MEA CO2 loading (mol CO2/mol
MEA)
0.484 0.484 0.484
Table 8 Simulation results compared to experimental data [25]
315
Variable Reboiler Temperature (oC)
105 115 120
Lean Loading (mol CO2/mol MEA)
Experimental measurement 0.418 0.340 0.271
Model prediction 0.423 0.367 0.289
Relative error (%) 1.132 8.054 6.848
Reboiler duty (kW)
Experimental measurement 0.620 0.900 1.240
Model prediction 0.629 0.989 1.383
Relative error (%) 1.487 9.951 11.498
Model results compared with the experimental data from Cheng et al. [25] shown in
316
Table 8 indicates a good agreement with relative error on lean loading of less than
317
9% and reboiler duty percentage error of less than 12% for different reboiler
318
temperatures.
319
In summary, the model has predicted all experimental data reasonably well with not
320
more than 12% error prediction, the model developed can then be used to carry out
321
process analysis in order to study the system behaviour when there is a change in
322
some variables.
323
4 Process Analysis 324
With the validated models, we carried out process analysis to explore the effect of
325
rich-MEA flow rate, rotor speed and reboiler temperature on (a) the regeneration
326
efficiency calculated based on loading (Equation 27) and calculated based on
327
amount of CO2 in rich-MEA and lean-MEA solvent (Equation 28), (b) the
328
regeneration energy (with and without motor power) expressed in Equations 29 and
329
30 respectively. But the electricity power consumed by motor is high grade while the
330
steam power in the reboiler is a low grade, therefore for the two powers to be
331
comparable, efficiency loss needs to be accounted for by multiplying the motor
16
power with 2.5 (i.e. assuming 40% thermal efficiency in converting thermal heat into
333
electricity. The reason is that solvent-based carbon capture can be used in different
334
scenarios such as coal-fired subcritical power plants, coal-fired supercritical power
335
plants, gas-fired power plants and other industrial manufacturing plants. 40% is a
336
good assumption for these different scenarios). Equations 31 and 32 were used to
337
estimate the solvent residence time in the RPB with the assumption that wetted area
338
per unit volume is equal to specific surface area of the packing [44]. The RPB
339
stripper used for the process analysis has the following packing geometry: outer
340
radius = 0.371 m; inner radius = 0.152 m; axial depth of packing = 0.167 m; packing
341
void fraction = 0.76; packing specific surface area = 2,132 m2/m3.
342
Regenerationeff RichCO loading LeanRichCO loadingCO loading
343
Regenerationeff Amount of CO in RichAmount of CO in RichAmount of CO in Lean
344
Regenerationenergy without motor power MassReboilerofCO desorbed duty
345
Regenerationenergy with motor power ReboilerMassdutyofCO desorbed
346
Residence time t
347
Where
348
349
= liquid volumetric flowrate (m3/s)
350
351
4.1 Effect of rich solvent flow rate on regeneration efficiency and energy 352
4.1.1 Justification for case study 353
Rich-MEA solvent flow rate not only has influence on the amount of CO2 that will be
354
stripped off from the regenerator, but also has relationship with the reboiler duty.
355
Therefore study on the right quantity of rich-MEA solvent coming into the regenerator
356
of fixed or given size is necessary.
17 4.1.2 Setup of the case study
358
For this study, the process input conditions are shown in Table 9 with the rich-MEA
359
flow rate varying from 0.2 kg/s to 0.8 kg/s. Here the rich-MEA loading is kept
360
constant (i.e. 0.482 mol CO2/mol MEA). Also in this study lean-MEA loading and
361
reboiler temperature are the two outputs parameters that were maintained at 0.3178
362
mol CO2/mol MEA and 120 oC respectively. Reboiler temperature is maintained at
363
120 oC by controlling the back pressure regulator to the stripper.
[image:18.595.69.526.215.430.2]364
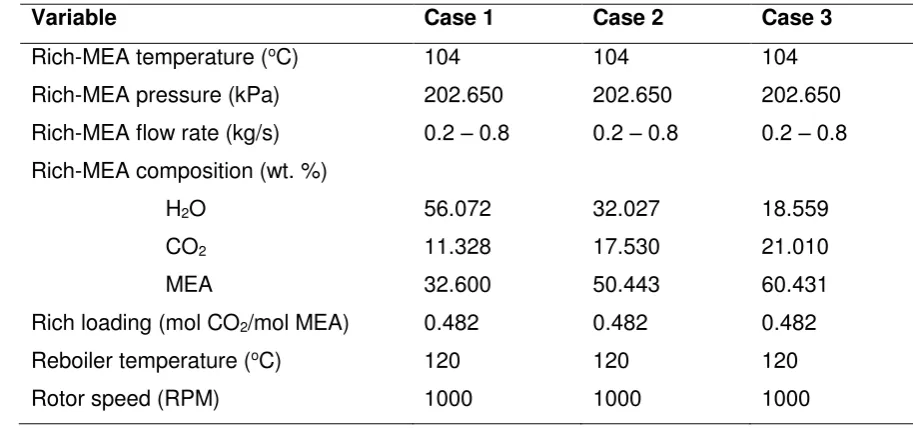
Table 9 Process inputs
365
Variable Case 1 Case 2 Case 3
Rich-MEA temperature (oC) 104 104 104
Rich-MEA pressure (kPa) 202.650 202.650 202.650
Rich-MEA flow rate (kg/s) 0.2 – 0.8 0.2 – 0.8 0.2 – 0.8
Rich-MEA composition (wt. %)
H2O
CO2
MEA
56.072
11.328
32.600
32.027
17.530
50.443
18.559
21.010
60.431
Rich loading (mol CO2/mol MEA) 0.482 0.482 0.482
Reboiler temperature (oC) 120 120 120
Rotor speed (RPM) 1000 1000 1000
366
4.1.3 Results and discussion 367
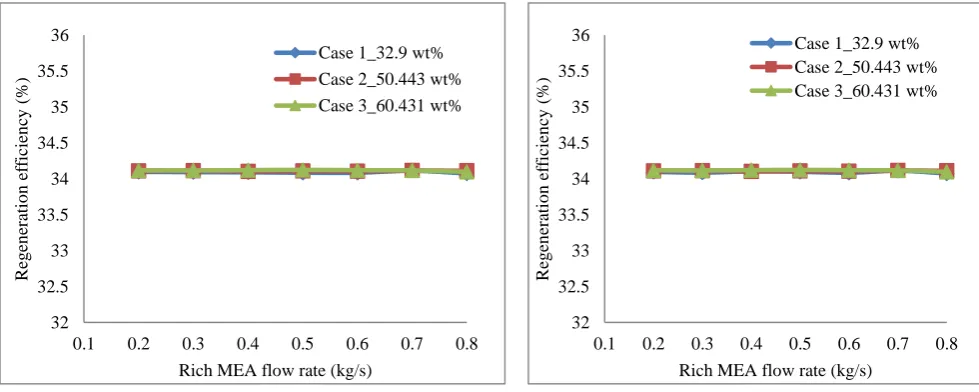
Figure 3a (using Equation 27) and Figure 3b (using Equation 28) show a constant
368
regeneration efficiency as the MEA flow rate increases, this is because the
rich-369
MEA loading is the same for all the cases and the lean-MEA loading which is one of
370
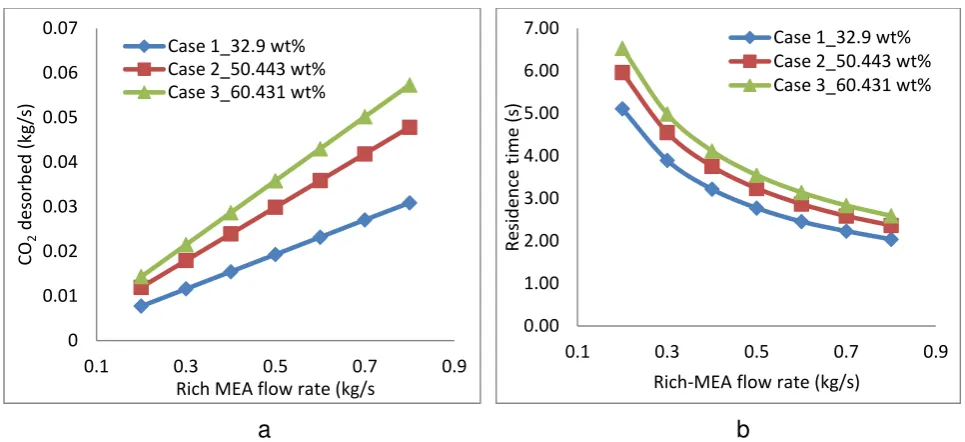
the output is controlled at the same value of 0.3178 mol/mol. Figure 4a presents the
371
amount of CO2 strip-off from the stripper as the rich-MEA flow rate increases. The
372
graph shows an increase in the amount of CO2 desorbed as the rich-MEA flow rate
373
increases. This is attributed to increase in droplet flow regime. As liquid flowrate
374
increases, the liquid breaks up more readily as they enter the rotating packing
375
forming more droplets due to their higher velocity. Studies by Chambers and Walls
376
[45] already showed that droplet flow regime in RPBs generally favours better mass
377
transfer performance than the film flow regime. It is not surprising then that CO2
378
desorption rate noticeably increases (Figure 4a) as liquid flowrate increases. Figure 379
4a also shows that higher MEA concentration gives higher CO2 desorption rate. This
380
is due to their higher loading capacity, which means the amount of CO2 absorbed is
381
more. Therefore, under similar conditions then, desorption rate from more
382
concentrated MEA solution is expected to be more.
18
Figure 4b shows firstly that the residence time decreases with increasing liquid
384
flowrate. To understand this, referring to Equations 31 and 32, it is seen that the
385
residence time can be related to flowrate as follows (assuming other parameters in
386
Equations 31 and 32 remain constant):
387
t
388
With K (= constant), this simply shows that increasing flowrate will result to lower
389
residence time. In physical terms, this can be further explained by acknowledging
390
that liquid velocity increases with flowrate. Higher liquid velocity means that delay
391
within the system is less and this ultimately means lower residence time.
392
The other result shown in Figure 4b is increase in residence time as MEA solution
393
concentration increases. This is due to increase in solution density (i.e. 1062.784
394
kg/m3 for 32.6 wt%, 1162.062 kg/m3 for 50.443 wt%, 1209.465 kg/m3 for 60.431
395
wt%) and viscosity (i.e. 0.000681235 N.s/m2 for 32.6 wt%, 0.000990415 N.s/m2 for
396
50.443 wt%, 0.00125367 N.s/m2 for60.431 wt%).
[image:19.595.72.562.344.540.2]397
Figure 3 Effect of rich-MEA flow rate on regeneration efficiency (a) using Equation 27
398
(b) using Equation 28
399
32 32.5 33 33.5 34 34.5 35 35.5 36
0.1 0.2 0.3 0.4 0.5 0.6 0.7 0.8
Re
g
en
era
ti
o
n
e
ff
icie
n
cy
(%
)
Rich MEA flow rate (kg/s)
Case 1_32.9 wt% Case 2_50.443 wt% Case 3_60.431 wt%
32 32.5 33 33.5 34 34.5 35 35.5 36
0.1 0.2 0.3 0.4 0.5 0.6 0.7 0.8
Re
g
en
era
ti
o
n
e
ff
icie
n
cy
(%
)
Rich MEA flow rate (kg/s) Case 1_32.9 wt% Case 2_50.443 wt% Case 3_60.431 wt%
19 400
Figure 4 Effect of rich-MEA flow rate on (a) CO2 desorbed (b) Residence time
401
It can be observed from Figure 5a,b that the regeneration energy increases with
402
increase in rich-MEA flow rate for Cases 2 and 3 (with and without motor power). For
403
Case 1 (without motor energy) the regeneration energy is fairly constant as the
rich-404
MEA flowrate increases as shown in Figure 5a. This is because the percentage
405
increase in the reboiler duty shown in Figure 6 is same as the percentage in CO2
406
desorbed (Figure 4a) (i.e. 75.103% increase in reboiler duty and 74.973% increase
407
in amount of CO2 desorbed for Case 1) while for Case 2 there is 77.383% increase
408
in reboiler duty and 75.003% increase in amount of CO2 desorbed and Case 3 has
409
80.703% increase in reboiler duty, 74.986% increase in amount of CO2 desorbed.
410
The lowest regeneration energy obtained from the study is at flow rate of 0.2 kg/s
411
rich-MEA. For Case 3 the regeneration energy is 5.17 GJ/ton CO2 (without motor
412
energy) and 5.44 GJ/ton CO2 (with motor energy). The highest regeneration energy
413
for Case 2 is at rich-MEA flow rate of 0.8 kg/s and the regeneration energy is 5.17
414
GJ/ton CO2 (without motor energy) and 5.31 GJ/ton CO2 (with motor energy). For
415
Case 1 (with motor power) regeneration energy decreases with increase in rich-MEA
416
flow.
417
The percentage increase in regeneration energy (i.e. including motor energy) when
418
rich-MEA flowrate increases from 0.2 kg/s to 0.8 kg/s is 5.74% and 20.18% for
419
Cases 2 and 3 respectively, while for Case 1 the regeneration energy decreases by
420
5.72%.
421
Looking at Figures 5a,b and 6, one may wonder why higher MEA concentration
422
solvent is preferred for the RPB technology when the energy consumption is higher.
423
It should be noted that here it is for stripper only. For a closed loop process including
424
RPB Absorber and RPB stripper, the recycling solvent flowrate would be much lower
425
for higher concentration solvent for the same capture efficiency in the absorber.
426
Thus the energy consumption will be lower.
427
0 0.01 0.02 0.03 0.04 0.05 0.06 0.07
0.1 0.3 0.5 0.7 0.9
C
O2
d
e
so
rb
e
d
(
k
g
/s
)
Rich MEA flow rate (kg/s Case 1_32.9 wt%
Case 2_50.443 wt% Case 3_60.431 wt%
0.00 1.00 2.00 3.00 4.00 5.00 6.00 7.00
0.1 0.3 0.5 0.7 0.9
Re
si
d
e
n
ce
ti
m
e
(
s)
Rich-MEA flow rate (kg/s) Case 1_32.9 wt% Case 2_50.443 wt% Case 3_60.431 wt%
20 428
Figure 5 Effect of rich-MEA flow rate on regeneration energy (a) without motor
429
energy (b) with motor energy
430 431
432
Figure 6 Effect of rich-MEA flow rate on reboiler duty
433 434
3.5 4 4.5 5 5.5 6 6.5 7
0.1 0.3 0.5 0.7 0.9
Re
g
e
n
e
ra
ti
o
n
e
n
e
rg
y
(
G
J/
to
n
C
O2
)
Rich MEA flow rate (kg/s) Case 1_32.9 wt%
Case 2_50.443 wt% Case 3_60.431 wt%
3.5 4 4.5 5 5.5 6 6.5 7
0.1 0.3 0.5 0.7 0.9
Re
g
e
n
e
ra
ti
o
n
e
n
e
rg
y
(
G
J/
to
n
C
O2
)
Rich MEA flow rate (kg/s) Case 1_32.9 wt%
Case 2_50.443 wt% Case 3_60.431 wt%
0 50000 100000 150000 200000 250000 300000 350000 400000 450000
0.1 0.2 0.3 0.4 0.5 0.6 0.7 0.8 0.9
re
b
o
il
e
r
d
u
ty
(
W
)
Rich MEA flow rate (kg/s) R-Duty Case 1_32.9 wt%
R-Duty Case 2_50.443 wt% R-Duty Case 3_60.431 wt%
[image:21.595.127.466.352.569.2]21
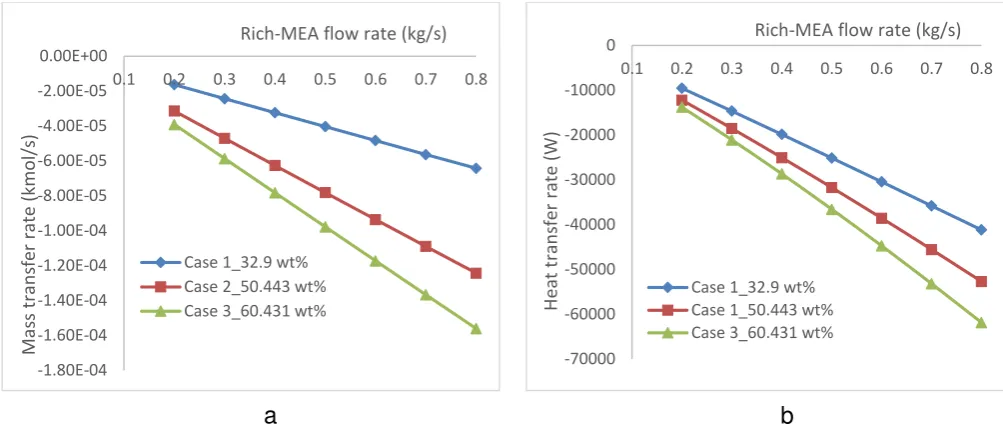
Figure 7 Effect of Rich-MEA flow rate on (a) mass transfer rate (b) heat transfer rate
435
Figure 7a shows how the CO2 mass transfer rate increases as the rich-MEA flow
436
rate increases. Mass transfer is generally defined as transfer from either vapour to
437
liquid or liquid to vapour. Here CO2 is transferred from liquid to vapour, therefore
438
negative sign appears. Figure 7a shows higher mass transfer rate for high MEA
439
concentration this is because more CO2 has been dissolve in it, therefore the rate of
440
CO2 desorbed will be higher than the lower MEA concentration. In Figure 7b heat
441
transfer rate increases with increase in rich-MEA flow rate, the negative sign indicate
442
transfer from liquid to vapour. The studies on CO2 mass transfer rate and the heat
443
transfer rate look at mass and heat transfer from the inner to outer radius of the RPB
444
excluding the mass and heat transfer in the condenser and reboiler.
445
To further account for why there is an increase in the regeneration energy as shown
446
in Figures 5a,b, the heat duty requirement in the reboiler is divided into three
447
different parts: (i) Sensible heat to raise the temperature of the rich-MEA stream in
448
the reboiler; (ii) Heat of reaction to reverse the absorption reaction and release CO2;
449
(iii)Heat of vapourisation to maintain the driving force for transfer of CO2 from liquid
450
phase to gas phase. Figures 8a,b and 9 show how the heat of vapourisation,
451
sensible heat and the heat of reversible reaction increases with increase in rich-MEA
452
flow rate respectively. Figure 8a shows that Heat of vapourisation is higher for high
453
MEA concentration than lower MEA concentration this is due to the difference in their
454
vapour composition (i.e. Case 1 has vapour composition of 0.25% H2O, 97.13%
455
MEA and Case 2 has 0.70% H2O, 97.64% MEA and Case 3 has 1.49% H2O,
456
97.85% MEA). Sensible heat for the three Cases is almost the same this is because
457
the rich-MEA flow rate coming into the stripper is same and the specific heat
458
capacity is relatively same and the difference in the specific heat capacity is counter
459
balanced by the temperature differences. Figure 9 shows that heat of reversible
460
reaction increases with increase in concentration this is as a result more energy
461
needed to break the CO2 and MEA bonds and because of the decrease in the
462
amount of free CO2 as the MEA concentration increases. Figure 10 shows how the
463 -1.80E-04 -1.60E-04 -1.40E-04 -1.20E-04 -1.00E-04 -8.00E-05 -6.00E-05 -4.00E-05 -2.00E-05 0.00E+00
0.1 0.2 0.3 0.4 0.5 0.6 0.7 0.8
Ma ss tr a n sf e r ra te ( k m o l/ s)
Rich-MEA flow rate (kg/s)
Case 1_32.9 wt% Case 2_50.443 wt% Case 3_60.431 wt%
-70000 -60000 -50000 -40000 -30000 -20000 -10000 0
0.1 0.2 0.3 0.4 0.5 0.6 0.7 0.8
H e at t ra n sf e r ra te ( W )
Rich-MEA flow rate (kg/s)
Case 1_32.9 wt% Case 1_50.443 wt% Case 3_60.431 wt%
22
reboiler duty requirement was divided for a fixed rich-MEA flowrate of 0.8 kg/s at
464
three different MEA concentrations. This shows that the heat of reaction increases
465
from 47%, to 65% and 74% when rich-MEA concentration increases from 32.9 wt%,
466
to 50.443 wt% and 60.431 wt%. This is consistent with amount of CO2 stripped as
467
presented in Figure 4 (a).
468
Therefore, this study will help operators and designers of RPB regenerator to
469
balance between energy consumption requirement and amount of CO2 desorbed for
470
a given Rich-MEA flow rate.
471
[image:23.595.39.554.76.653.2]472
Figure 8 Effect of Rich-MEA flow rate on (a) Heat of vapourisation (b) Sensible heat
473
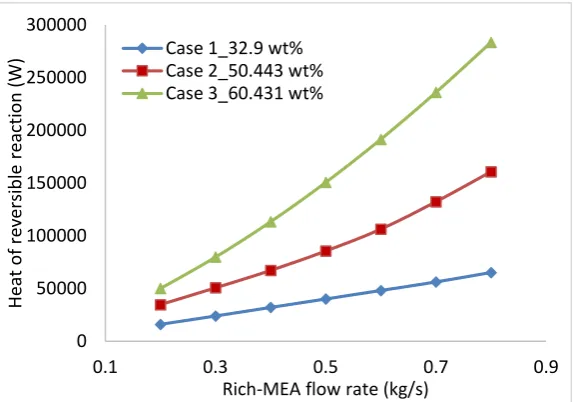
474
Figure 9 Effect of Rich-MEA flow rate on heat of reversible reaction
475
2000 12000 22000 32000 42000 52000 62000
0.1 0.3 0.5 0.7 0.9
H
e
at
o
f
v
ap
o
u
ri
za
ti
o
n
(
W
)
Rich-MEA flow rate (kg/s) Case 1_32.9 wt%
Case 2_50.443 wt% Case 3_60.431 wt%
0 5000 10000 15000 20000 25000 30000 35000 40000 45000 50000
0.1 0.3 0.5 0.7 0.9
S
e
n
si
b
le
h
e
at
(
W
)
Rich-MEA flow rate (kg/s) Case 1_32.9 wt% Case 2_50.443 wt% Case 3_60.431 wt%
0 50000 100000 150000 200000 250000 300000
0.1 0.3 0.5 0.7 0.9
H
e
at
o
f
re
ve
rs
ib
le
r
e
ac
ti
o
n
(
W
)
Rich-MEA flow rate (kg/s) Case 1_32.9 wt%
Case 2_50.443 wt% Case 3_60.431 wt%
[image:23.595.154.441.426.627.2]23
Figure 10 Heat contributions for 0.8 kg/s rich-MEA flowrate at different MEA
476
concentration (a) 32.9 wt% MEA (b) 50.443 wt% MEA (c) 60.431 wt% MEA
477
4.2 Effect of rotor speed on regeneration efficiency and regeneration energy 478
4.2.1 Justification for case study 479
The higher the rotating speed of the intensified regenerator the higher the energy
480
consumed, therefore it is important to understand the relationship that rotor speed
481
has with rich-MEA solvent flow rate so that the energy requirement for driving the
482
stripper can be reduced with respect to the amount of rich-MEA solvent regenerated.
483
4.2.2 Setup of the case study 484
For this study, the rotor speed was varied from 200 rpm and 1200 rpm in order to
485
cover the experimental range of rotor speed reported in Jassim et al [24] and Cheng
486
et al [25]. Input process conditions for this study are shown in Table 9 (i.e. Cases 1
487
and 2). The reboiler temperature, rich-MEA flow rate and rich-MEA loading were kept
488
constant at 120 oC 0.3 kg/s and 0.4823 mol/molrespectively for all the cases.
489
4.2.3 Results and discussion 490
Figure 11a shows that the regeneration efficiency increases with increase in the
491
rotor speed. The impact of rotor speed on lean-MEA loading is shown in Figure 11b.
492
Though higher rotor speed can produce opposite effect on mass and heat transfer by
493
decreasing the residence time (as shown in Figure 12a) but this effect was counter
494
balanced by the increase in the interfacial area which enhances mass and heat
495
transfer. Burns et al. [46] stated that at higher rotor speed there are more of smaller
496
liquid droplets and thinner liquid films in the packing regions of the bed, which means
497
increase in interfacial area. The set-up in this study is different with the one reported
498
in Section 4.1 where the lean-MEA loading was kept constant but in this study the
499
recovery rate is kept constant for all the MEA concentrations, but the recovery rate
500
H_vap 20%
H_sen 33% H_rxn
47%
H_vap 18%
H_sen 17% H_rxn
65%
H_vap 14%
H_sen 12%
H_rxn 74%
24
changes as the rotor speed increases. Figure 11a shows that regeneration
501
efficiency decreases with increase in concentration this is because the rich-MEA
502
loading is maintained at same value and the recovery rate is fixed at the same value
503
for different rotor speed meaning that the change between rich-MEA loading to
lean-504
MEA loading is smaller for higher MEA concentration than lower MEA concentration.
505
The amount of CO2 desorbed from the stripper increases as the rotor speed
506
increases as shown in Figure 12b. The amount of CO2 desorbed for the two
507
different cases are similar this is due to the model set-up where the recovery rate
508
were maintained at the same value but varied with rotor speed.
509
[image:25.595.37.575.212.742.2]510
Figure 11 Effect of rotor speed on (a) regeneration efficiency (b) lean loading
511
[image:25.595.64.560.226.426.2]512
Figure 12 Effect of rotor speed on (a) residence time (b) CO2 desorbed
513
Increase in rotor speed decreases the regeneration energy as shown in Figure 13a.
514
This is because increase in rotor speed leads to more liquid droplet and thin liquid
515
films to dominate the packing resulting in increase in mass and heat transfer. Also at
516 0 5 10 15 20 25 30 35 40 45 50
0 200 400 600 800 1000 1200 1400
Re g e n e ra ti o n e ff ic ie n cy ( % )
Rotor speed (RPM)
Case 1_32.9 wt%
Case 2_50.443 wt%
0.00 0.05 0.10 0.15 0.20 0.25 0.30 0.35 0.40
0 200 400 600 800 1000 1200 1400
Le an l o ad in g ( m o l/ m o l)
Rotor speed (RPM) Case 1_32.9 wt%
Case 2_50.443 wt%
0.00 2.00 4.00 6.00 8.00 10.00 12.00 14.00
0 200 400 600 800 1000 1200 1400
Re si d e n ce ti m e ( s)
Rotor speed (RPM) Case 1_32.9 wt%
Case 2_50.443 wt%
0 0.002 0.004 0.006 0.008 0.01 0.012 0.014 0.016 0.018
0 200 400 600 800 1000 1200 1400
C O2 d e so rb e d ( k g /s )
Rotor speed (RPM) Case 1_32.9 wt%
Case 2_50.443 wt%
a b
25
higher rotational speed the problem of liquid mal-distribution is overcome leading to
517
higher wetted area which subsequently contributes to improving mass transfer. For
518
all cases, the trend in Figure 13a (without motor energy) shows a drop in the
519
regeneration energy as the rotor speed increases from 200 rpm to 1200 rpm this is
520
because of increase in the rate of CO2 stripped-off (Figure 12b). But when energy
521
consumed by the motor is included Figure 13b, there is an increase in regeneration
522
energy at rotor speed above 600 rpm for Case 2 and above 400 rpm for Case 1. This
523
is because the motor energy is a function of square of rotor speed. Also Figures 524
13a,b shows that regeneration energy decreases with increase in MEA
525
concentration this is due to smaller difference between rich-MEA loading and
lean-526
loading as seen in Figure 11b (i.e. at rotor speed of 600rpm Cases 1 and 2 has
527
lean-MEA loading as an output from the model of 0.2898 mol/mol and 0.354076
528
mol/mol respectively). The average percentage increase in regeneration energy
529
when motor power is included is 6.44% and 6.84% for Case 1 and Case 2
530
respectively. Figure 14 shows how the reboiler duty increases with increase in rotor
531
speed. Case 1 has higher reboiler duty because the difference in rich-MEA to
lean-532
MEA loading is bigger which means higher reboiler duty, since reboiler duty is
533
related to the difference in lean and rich loading.
534
This study will help operator and designer of RPB regenerator in chosen the rotor
535
speed that give lower regeneration energy without compromising the amount of CO2
536
desorbed.
537
[image:26.595.66.558.423.641.2]538
Figure 13 Effect of rotor speed on regeneration energy (a) without motor energy (b)
539
with motor energy
540 3.8 3.9 4 4.1 4.2 4.3 4.4 4.5 4.6 4.7 4.8
0 200 400 600 800 1000 1200 1400
R e g e n e rat io n E n e rg y ( G J/ to n C O2 )
Rotor speed (RPM) Case 1_32.9 wt%
Case 2_50.443 wt%
3.8 4 4.2 4.4 4.6 4.8 5 5.2
0 200 400 600 800 1000 1200 1400
R e g e n e rat io n E n e rg y ( G J/ to n C O2 )
Rotor speed (RPM) Case 1_32.9 wt%
Case 2_50.443 wt%
26 541
Figure 14 Effect of rotor speed on reboiler duty
542
4.3 Effect of reboiler temperature on regeneration efficiency and energy 543
4.3.1 Justification for case study 544
Operating intensified regenerator at the right reboiler temperature will lead to good
545
system performance by reducing regeneration energy waste and also operating at
546
relatively high regeneration efficiency.
547
4.3.2 Setup of the case study 548
For this study, the reboiler temperature was varied from 105 to 125 oC. Process input
549
conditions are same as in Table 9 (i.e. Cases 1 and 2). The rich-MEA flow rate and
550
rich-MEA loading were kept constant at 0.3 kg/s and 0.4823 mol/molrespectively for
551
all the cases.
552
4.3.3 Results and discussion 553
Figure 15a shows that the regeneration efficiency increases with increase in reboiler
554
temperature. The percentage increase in regeneration efficiency as the reboiler
555
temperature increases for Cases 1 and 2 is about the same 9.67% and 9.33%
556
respectively. The model shows that regeneration efficiency for Case 1 which has
557
lower MEA concentration is higher. This is due to lower lean-MEA loading coming
558
out as shown in Figure 15b since at each reboiler temperature for Case 1 and 2, the
559
amount CO2 desorbed is maintained at around the same value and also more CO2
560
was dissolved in higher MEA concentration than the lower MEA concentration in
561
order to have the same rich-MEA loading coming into the stripper. Figure 15b shows
562
that there is a decrease in lean-MEA loading as the reboiler temperature increases.
563
This is because of increase in the amount of CO2 stripped-off as shown in Figure 16.
564
50500 51000 51500 52000 52500 53000 53500 54000 54500 55000 55500
0 200 400 600 800 1000 1200 1400
Re
b
o
il
e
r
d
u
ty
(
W
)
Rotor speed (RPM)
Case 1_32.9 wt%
27 565
Figure 15 Effect of reboiler temperature on (a) regeneration efficiency (b) lean
566
loading
567
568
Figure 16 Effect of reboiler temperature on amount of CO2 desorbed
569
There is a decrease and increase in regeneration energy as the reboiler temperature
570
increases from 105 oC to 125 oC. From Figure 16a,b (with and without motor
571
energy) the regeneration energy decreases as the reboiler temperature increases
572
from 105 oC to 115 oC for Case 1 and 2, but this behaviour changes when the
573
reboiler temperature exceed 115 oC. This is because at higher temperature we
574
expect increase in water vapour flow rate which results in increase in regeneration
575
energy because of heat of vaporisation of water. Also Figure 19b shows how the
576
MEA composition in the vapour stream increases with increase in reboiler
577
temperature this means increase in heat of vapourisation. Also from Figure 15b the
578
loading different between the rich-MEA and lean-MEA stream is wide for Case 1
579
than Case 2 that is why it has higher reboiler duty requirement. Figure 18 shows
580
how the reboiler duty increases with increase in reboiler temperature. The decrease
581 0 5 10 15 20 25 30 35 40 45
100 110 120 130
Re g e n e ra ti o n e fi ci e n cy ( % )
Reboiler temperature (oC)
Case 1_32.9 wt%
Case 2_50.443 wt%
0 0.05 0.1 0.15 0.2 0.25 0.3 0.35 0.4
100 105 110 115 120 125 130
Le an l o ad in g ( m o l/ m o l)
Reboiler temperature (oC)
Case 1_32.9 wt%
Case 2_50.443 wt%
0.0118 0.012 0.0122 0.0124 0.0126 0.0128 0.013 0.0132 0.0134
100 105 110 115 120 125 130
C O2 d e so rb e d ( k g /s )
Reboiler temperature (oC)
Case 1_32.9% wt%
Case 2_50.443 wt%
[image:28.595.163.437.324.530.2]28
and increase in the regeneration energy can be further explained by Figure 20 a,b 582
and Figure 21 where the reboiler heat duty requirement is split into the heat of
583
vapourisation, sensible heat and heat of reversible reaction. Increase in reboiler
584
temperature leads to increase in heat of vapourisation and sensible heat while heat
585
of reversible reaction decreases. The decrease in heat of reversible reaction is
586
because of increase in rate of reaction as temperature increases. 587
[image:29.595.67.563.176.404.2]588
Figure 17 Effect of reboiler temperature on regeneration energy (a) without motor
589
energy (b) with motor energy
590 591
592
Figure 18 Effect of reboiler temperature on reboiler duty
593 3.6 3.8 4 4.2 4.4 4.6 4.8 5 5.2
100 105 110 115 120 125 130
Re g e n e rat io n e n e rg y ( G J/ to n C O2 )
Reboiler temperature (oC)
Case 1_32.9 wt% Case 2_50.443 wt%
3.6 3.8 4 4.2 4.4 4.6 4.8 5 5.2
100 105 110 115 120 125 130
Re g e n e rat io n e n e rg y ( G J/ to n C O2 )
Reboiler temperature (oC)
Case 1_32.9 wt%
Case 2_50.443 wt%
0 10000 20000 30000 40000 50000 60000 70000
100 105 110 115 120 125 130
Re b o il e r d u ty ( W )
Reboiler temperature (oC)
Case 1_32.9 wt%
Case 2_50.443 wt%
[image:29.595.141.455.472.674.2]29
Figure 19 Effect of reboiler temperature on (a) lean-MEA viscosity (b) MEA content
594
in outlet vapour stream
[image:30.595.164.431.562.746.2]595
Figure 20 Effect of reboiler temperature on (a) heat of vapourisation (b) sensible heat
596
597
Figure 21 Effect of reboiler temperature on heat of reversible reaction
598 0.0E+00 2.0E-04 4.0E-04 6.0E-04 8.0E-04 1.0E-03 1.2E-03 1.4E-03
100 110 120 130
V is co si ty o f le an -ME A ( N .s /m 2)
Reboiler temperature (oC)
Case 1_32.900 wt%
Case 2_50.443 wt%
0 0.001 0.002 0.003 0.004 0.005 0.006
100 110 120 130
ME A c o m p o si ti o n at v ap o u r (% )
Reboiler temperature (oC) Case 1_32.9 wt% Case 2_50.443 wt%
11400 11500 11600 11700 11800 11900 12000 12100
100 105 110 115 120 125 130
H e at o f v ap o u ri sat io n ( W )
Reboiler temperature (oC)
Case 1_32.9 wt%
Case 2_50.443 wt%
0 5000 10000 15000 20000 25000
100 110 120 130
S e n si b le h e at ( W )
Reboiler temperature (oC)
Case 1_32.9 wt%
Case 2_50.443wt% 0 5000 10000 15000 20000 25000 30000 35000 40000
100 105 110 115 120 125 130
H e at o f re ve rs ab le r e ac ti o n ( W )
Reboiler temperature (oC)
Case 1_32.9 wt%
Case 2_50.443 wt%
b a

![Figure 2 Methodology used in this paper [21,22]](https://thumb-us.123doks.com/thumbv2/123dok_us/7796086.169779/13.595.112.454.165.528/figure-methodology-used-paper.webp)
![Table 4 Input process conditions for Run 1 to Run 5 [24]](https://thumb-us.123doks.com/thumbv2/123dok_us/7796086.169779/14.595.67.510.446.645/table-input-process-conditions-run-run.webp)
![Table 5 Simulation results compared to experimental data [24] for Run 1 to Run 5](https://thumb-us.123doks.com/thumbv2/123dok_us/7796086.169779/15.595.71.355.592.712/table-simulation-results-compared-experimental-data-run-run.webp)