Received January 9, 2017, accepted February 1, 2017, date of publication February 17, 2017, date of current version March 15, 2017. Digital Object Identifier 10.1109/ACCESS.2017.2670027
Coverage and Rate Analysis for Downlink
HetNets Using Modified Reverse
Frequency Allocation Scheme
ANEEQA IJAZ1, SYED ALI HASSAN1, SYED ALI RAZA ZAIDI2, DUSHANTHA NALIN K.
JAYAKODY3, AND SYED MOHAMMAD HASSAN ZAIDI1
1School of Electrical Engineering and Computer Science, National University of Sciences and Technology, Islamabad 44000, Pakistan 2School of Electronic and Electrical Engineering, University of Leeds, Leeds LS2 9JT, U.K.
3Department of Software Engineering, Institute of Cybernetics, National Research Tomsk Polytechnic University, 634050 Tomsk, Russia
Corresponding author: A. Ijaz ([email protected])
This work was supported in part by the U.K. Engineering and Physical Sciences Research Council (EPSRC) for the University of Leeds Institutional Support under EPSRC Prosperities Outcome Framework under Grant EP/P511341/1, in part by the Russian Federal Budget Funds, Fundamental Research, Applied Research and Experimental Development under Grant 3942 (for research work) and performed in accordance with the Russian Government Resolutions under Grant 2014/226 of 2016, and in part by the COST Action on Inclusion Radio Communications under Grant CA15104. All data are provided in full in the results section of this paper.
ABSTRACT The deployment of heterogeneous networks (HetNets) inevitably demands the design of
interference management techniques to elevate the overall network performance. This paper presents a novel interference mitigation technique known as reverse frequency allocation (RFA), which provides an efficient resource allocation compared with the other state-of-the-art techniques. RFA reverses the transmission direction of interferers, thereby minimizing the cross-tier interference. Eventually, better coverage as well as increased data rates are achieved by providing complementary spectrum to the macro and pico users. In this paper, we present a tractable approach for modeling HetNets under the proposed RFA scheme. Specifically, we employ well known tools from stochastic geometry to derive closed-form expressions for the coverage probability and rate coverage in two-tier cellular network employing RFA and its variants. The modeling is performed using two approaches; first, where the base stations and users are modeled as independent Poisson point processes (PPPs) and second, the interference is approximated using the fluid model. It is shown that the results obtained from the PPP model are accurate for higher values of path loss exponents, while the results from fluid model are useful for smaller values of path loss exponents. The plausibility of model is validated through the Monte-Carlo simulations and the network performance is evaluated in terms of coverage probability, coverage rate, and outage capacity. The results demonstrate that 2-RFA yields outage capacity gains of 13% as compared with the soft fractional frequency reuse scheme, whereas, the performance gains can be further improved by 14% by employing the proposed variants of RFA.
INDEX TERMS 5G heterogeneous network, reverse frequency allocation, stochastic geometry, coverage
probability, outage capacity.
I. INTRODUCTION
Addressing the enormous growth of mobile traffic is one of the pivotal challenges for future wireless cellular networks. By observing the current growth trends in the traffic load, it is expected that the mobile data traffic across the globe will exponentially increase over next few years. The recent forecast in [1] shows that the data traffic is expected to increase 1000 folds by the year 2020 and by 10,000 times by 2025. Futhermore, this unprecedented demand for wire-less connectivity is increasingly becoming heterogeneous due
5G wireless networks are geared to exploit aggressive spa-tial reuse of spectrum to realize higher throughput via het-erogeneous cellular architecture, i.e., HCNs (hethet-erogeneous cellular networks) [3].
HCNs are efficient as well as cost effective solution for offloading the mobile users from the macro base sta-tion to small access points (SAPs). SAPs include opera-tor and/or user deployed pico base stations (PBSs) [4], or femto BSs [5], [6], provisioned with multiple radio access technologies (multi-RAT). The BSs of various tiers included in HCNs vary in their transmit power, density, propagation characteristics (e.g., path loss exponents), deployment modes (e.g., open vs. closed, indoor vs. outdoor) [7] and supported quality of service (QoS) requirements. Therefore, user expe-rience in terms of rate, reliability and coverage is varying as compared to the stand alone macro BS networks. The eminent advantage of SAPs is that they can be seamlessly overlaid in the existing macro cellular wireless networks whereby according to [8], the number of small base stations (SBS) would increase up to 17 million by 2017.
As the number of tiers is increased to improve the per-formance of the wireless network, the system has to face major technical challenges. For instance, dealing with the aggregate effect of interference from different tiers and from the cells of same tier while evaluating the signal-to-interference plus noise ratio (SINR) and throughput of the mobile users, increased complexity, self organization, back-hauling and handover etc. Hence, this stands as a necessity to consider for a pragmatic solution that not only minimizes these challenges but also provides phenomenal boost in the data rates. Interference can be reduced within the operator deployed macrocells by implementing interference manage-ment techniques such as the frequency reuse schemes, sub-carrier allocation, codebook restriction strategy to select the best channel [9], and centralization of the network. However, these techniques can be deployed in co-tier cellular net-work. For the intercell interference (ICI) management in HetNets, 3GPP Release 10 introduced almost blank sub-frames (ABS)/ based enhanced inter cell interference coor-dination (eICIC) which is an efficient way to increase the cell-edge area of users [10]. Reducing the power of the small cells increases the throughput of the victim macro user equipments (MUEs) [11], and efficiently defining the user association criteria also enhances the performance of HetNets [12].
A number of recent literature addressed the main issues of interference, limited resource availability and load bal-ancing thereby, introducing the schemes that mitigate inter-ference in heterogeneous cellular networks [13], improve capacity by using the spectrum resources efficiently [14] and by offloading the traffic towards SAPs [15], [16]. Other solutions include power control mechanism, adjusting the transmissions of both tiers in separate time frames for achieving significant gain in the data rates. To mitigate the impact of interference, we present an efficient frequency allocation scheme in a two tier network that reverses the
transmission direction of both tiers, thereby enhances the data rates of downlink users. The following subsection gives an overview of relevant literature in HetNets.
A. RELATED WORK AND MOTIVATION
When the users are allowed to connect to the APs of any tier, they generally connect to high powered macro base stations (MBSs) causing load disparity and under uti-lization of resources. On the other hand, for load bal-ancing, MBS can offload small fraction of macro users to SAPs, however, this leads to lower SINR. Therefore, during the transmission/reception period of small cells, the time/frequency resources of the macro cells become mute [10], leading to the wastage of time/frequency resources assigned to the subscribers attached to the MBS. Moreover, for load balancing, only a limited number of users can be offloaded to the SAPs and the users connected to the SAPs do not receive optimal SINR. Therefore, it is required to apply some resource allocation algorithm along with innova-tive interference mitigation schemes to substantially enhance the gains of the network.
In [14], many frequency allocation schemes are discussed to minimize the impact of interference and fair resource par-titioning among the users connected to macro cells and femto cells. A comprehensive survey [17], depicts many strategies to deal with the interference scenarios. In [18], buffered fractional frequency reuse (FFR) scheme for the elevation of data rates of cell edge macro user equipments (MUEs) is developed and compared with several other frequency reuse schemes. A detailed analysis of coverage probability for open and closed access modes for FFR schemes is proposed in [19]. Universal blanking pattern is introduced in [20] to provide coordination among base stations of various tiers and reduc-ing interference by usreduc-ing physical resource block allocation. The performance and spectral efficiency of SAPs can be improved by utilizing antennas, selection diversity schemes and beamforming for interference management in uplink as well as in downlink [21]. A variant of shared frequency scheme is proposed in [22] that avoids the prominent source of interference from MBS by dividing the macrocell into several regions. In [23], a cross-polarized complementary frequency allocation (CPCFA) scheme in femto-macro net-works is introduced to exploit the diversity in the frequency spectrum by employing the cross-polarization discrimina-tion (XPD) property that supports the independent operadiscrimina-tions within each of the tier by utilizing different polarizations at the cost of complexity.
regions and applying complementary spectrum allocation between the macrocells and picocells, i.e., the direction of radio transmissions of macrocells is reversed and allocated to the picocells that are in the other spatially separated area. Hence, there is a prominent reduction in the number of interfering entities in each region of a macro cell, whereas the detrimental impact of MBS interference is completely avoided.
B. CONTRIBUTIONS
The main contributions of this paper are four fold:
• We provide a detailed description of RFA schemes in terms of bandwidth allocation and interference mitiga-tion. In addition, we devise a hybrid RFA scheme that takes advantage of prominent aspects (higher bandwidth and minimized interference) of existing RFA schemes.
• Utilizing stochastic geometry, we derive the analytical
expressions of coverage probability and rate coverage for various RFA schemes. Our analysis assumes that there is no cross-tier interference from other macro cells and prove that the proposed modified RFA scheme is the optimal scheme among other RFA schemes.
• Mathematical modeling is performed using two different
approaches; in the first approach, the location of the interferers is modeled as independent PPPs, best suitable for higher values of pathloss exponent. Whereas, in the second approach, the expected value of the cumulative interference is calculated using fluid model.
• Analysis of proposed scheme for multiple cells is involved, however, with the help of simulations, the network performance is evaluated in terms of average outage probability and outage capacity, a quantity that provides favorable throughput fairness. The plausibility of model is also verified through simulations and it has been observed that the proposed modified scheme excels in terms of data rates and enhanced capacity as compared to the baseline RFA and SFR scheme.
C. ORGANIZATION
The organization of this paper is as follows. Section II presents the sub-carrier allocation in general RFA setting. Section III provides the mathematical modeling of RFA scheme based on the above mentioned two approaches. Closed-form expressions of coverage probability for modi-fied RFA scheme are derived in Section IV. Section V gives insight of the network performance when RFA scheme is implemented in multi-cellular network. Simulation results and discussion are described in Section VI. The conclusion and future work is provided in Section VII.
II. SUB-CARRIER ALLOCATION IN RFA SCHEME
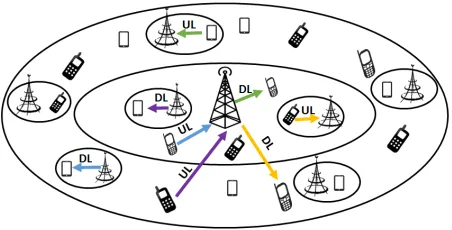
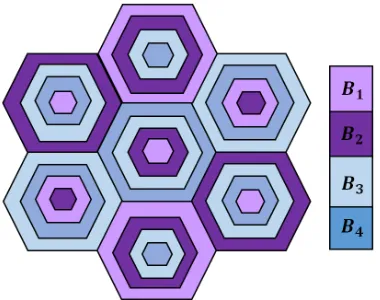
[image:3.576.304.530.65.180.2]Like other FFR schemes, a conventional 2-RFA scheme [24] divides the coverage area of each macrocell into two regions, i.e., an interior region and an exterior region [25]. However, distinguished attribute in this scheme is the reversal of transmission directions of the two tiers to achieve minimal
FIGURE 1. Illustration of 2-RFA in a single cell with two-tier network. (The signaling colors are conversant with the spectrum colors in the Table I).
TABLE 1.Frequency partitioning in 2-RFA scheme.
interference and maximum gain for the downlink (DL) users. Furthermore, frequency division duplexing (FDD) scheme is considered, where the traffic in this study is assumed to be symmetrical and equal bandwidth, bul is allocated for the uplink transmission and downlink bdl channels, i.e., B = bdlS
bul, where B is the available bandwidth. Additionally, there exist no interference between UL and DL traffic of the same tier. Taking advantage of this aspect, we distribute the pico and macro users such that if the pico user equipments (PUEs) connected to the PBSs of inner region of macrocell are at DL, the macro user equipments (MUEs) of outer region utilizing the same frequency band are at UL and vice versa. Therefore, the cross-tier interference is min-imized. In a similar manner, the PUEs of outer region while receiving transmission from the tagged PBSs, encounter cross-tier interference from the inner region uplink MUEs. The detailed interference scenario for the users of both tiers is elaborated in Fig. 1 and bandwidth allocation among the users of inner and outer regions connected to PBSs and MBS is shown in Table I, respectively.
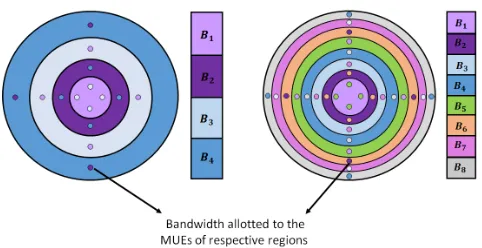
[image:3.576.319.514.245.327.2]FIGURE 2. Bandwidth allocation in multi region RFA (4-RFA and 8-RFA).
are assigned the same spectrum, is reduced and they are now distributed in the far apart regions within the same cell. Therefore, the probability of interference from the adjacent regions is minimized. For instance, partitioning the macrocell into four regions to devise a 4-RFA scheme, the provided spectrum is now divided into four sub-bands and the PUEs of regionR1 receive co-tier interference from the same region and cross-tier interference from a distant regionR3as shown in Fig. 2. The increased path loss between the intended user and the interferers eventually provides better SINR. Likewise, the downlink transmission ofR2PUEs is being interfered by the PBSs of same region and from the uplink MUEs located in R4. Similarly, R3 PUEs receive interference from PBSs situated inR3and from MUEs inR1. In order to attain better SINR of the downlink users, we can further partition the macrocell into 8 regions, whereby the distance between the interferers is further increased, i.e., R1 PUEs now receive cross-tier interference from R5 UL MUEs, R2 PUEs from R6UL MUEs and so on. The detailed bandwidth allocation among the users of 4-RFA and 8-RFA is given in Fig. 2. The resulting SINR expression of a DL PUE connected to the PBS in any region is expressed as
SINR= Pphi||xi|| −β2
69
q=1,q6=iPphq||xq||−β2+6m=1Pmhm||xm||−β1+σ2
,
(1)
wherePpandPm are the transmission powers of PBSs and MUEs, respectively andhi ∼ exp(1) is independently and identically distributed (i.i.d) exponential fading gain with unit mean. The path loss function is expressed as||xi||−β2, where
xiis the distance between the intended PUE and the serving PBS, β2 is the path loss exponent for the pico tier andβ1 for the macro tier. The denominator of (1) represents the interference that PUE experiences from all the DL PBSs9 located in the same region other than the serving PBS and from the UL MUEsin other region exploiting same band-width spectrum, respectively, while noise power is expressed asσ2.
Although, a higher region RFA provides less interference, however, as we opt for these RFA schemes, the division of cell causes partitioning of spectrum into orthogonal bands as
well [26]. Hence, the more we partition the cell, a smaller spectrum is available for the users of higher region RFA. While considering this degradation and requirement of down-link users, in terms of substantial rates, partitioning the cell overwhelmingly is not an attractive solution. Keeping the above in view, we devise a hybrid scheme by merging the 2-RFA and 4-RFA schemes such that the benefits of both schemes in terms of higher sum capacity and vulnerability to interference are achieved, respectively. Combination of other RFA schemes can also be assumed, however, it is shown in Section VI that the optimal rates are achieved by deploying a modified version of 4-RFA, which we call as modified 4-RFA or M-4-RFA scheme. In M-4-RFA scheme, the macro-cell is divided into four regions similar to conventional 4-RFA scheme, however, frequency sub-carriers are allocated just like 2-RFA, such that PUEs of each region now receive co-tier as well as cross-tier interference from two regions rather than just a single region. For instance, a PUE located inR1 receives co-tier interference fromR1 downlink PBSs and from PBSs ofR3, likewise it receives cross-tier interfer-ence from uplink MUEs located inR2andR4, respectively. The benefit of this scheme is that although the amount of interference increases as compared to 4-RFA, however, band-width division is small. Consequently, appreciable increase in the data rates is achieved.
III. MATHEMATICAL MODELING OF 2-RFA SCHEME In this section, we present analytical expressions for the coverage probabilities of DL PUEs in a heterogeneous two tier cellular network, i.e., pico cells are overlaid with macro cellular network. To calculate the coverage of the networks, it is considered that a conventional hexagonal grid model provides an upper bound on coverage, i.e., the deployment of BSs having deterministic cell boundaries is a widely used approach for simulations but too idealistic for practical scenarios. Therefore, in [27], it is stated that a PPP distribution could be used that helps in the modeling of these networks through stochastic geometry. In such models, the BSs have cell boundaries corresponding to Voronoi tessella-tions where the BSs locatessella-tions are modeled by a PPP of finite intensity. Recently, in [28] it is explained that by assuming BS coverage area as Voronoi tessellations, accuracy in the mod-eling of coverage probability is achieved for higher values of path loss exponent, i.e., 4 or higher, whereas for smaller values of path loss exponent, e.g., 2.5, the performance of model is not matched accurately.
A. COVERAGE PROBABILITY ANALYSIS CONSIDERING PPP
As mentioned earlier, a closed access mode is considered, i.e., each user is connected to the closest BS of a particular tier. For a 2-RFA scheme, we divide the macro cell into 2 regions of equal area. The distribution of PBSs and MUEs in each region is considered as independent PPPs, 8(jν) of
intensityλ(jν)and8k(ν)of intensityλ(kν), respectively, whereν denotes the regions of macrocell, i.e,ν ∈ {1,2}for 2-RFA. Each user is served by at most one pico BS with transmit powerPpand the user can communicate with the tagged BS if the resulting SINR is greater than a pre-defined thresholdτ. Without loss of generality, it is assumed that the user is at the origin. Hence, the received power at the user from a PBS located at distancexi(1)is given asPph(1)i ||xi(1)||−β2. As far as
interference is concerned, a worst case scenario is assumed in which all the PBSs and MUEs that utilize the same spectrum are transmitting, therefore a user experiences interference from all the interfering entities. The generalized expression of SINR for a downlink pico user located in the inner region R1 of macro cell connected to its PBS of same region is expressed as
SINR(1)x =Pph (1)
i ||xi(1)||−β2 Ipbs+Imue+σ2
, (2)
whereIpbsis the interference from the downlink PBSs located inR1andImuerepresents the interference active form all the transmitting uplink MUEs from regionR2, respectively. Both interfering entities,IpbsandImueare expressed as
Ipbs= X
xj(1)∈8(1)j
x(1)j 6=xi(1)
Pph(1)j ||xj(1)||−β2,
Imue=
X
xk(2)∈8(2) k
Pmhφk(2)||x
φ(2) k ||
−β1.
1) DISTANCE TO THE CLOSEST PICO BASE STATION
Since, each user connects with the closest pico base station, no other base station can be closer thanxi(1), in other words all the other PBSs are at least at the distanceχfrom the user. For the sake of simplicity, we drop the subscriptiand represent the distance between the serving PBS and PUE asx(1). Then probability density function (PDF) ofx(1)can be formulated by utilizing the fact that the null probability, i.e.,
P[x(1)> χ]=e−λ
(1) j πχ2.
Therefore, the cumulative distribution function (CDF) is
P[x(1)≤χ]=1−e−λ
(1) j πχ2.
The PDF then becomes
f(x(1))= dF(x (1))
dx(1) =2πλ (1) j x
(1)e−πλ(1)j x(1)2.
2) COVERAGE PROBABILITY
Given the SINR threshold and path loss exponent, the coverage probability is expressed as
P(1)c (τ)= Z
x(1)>0EI (1) x
h
P[SINR(1)x > τ]if(x(1))dx(1), (3)
= Z
x(1)>0EI (1) x
h
Ph> τ(Pp)−1x(1)
β2
(Ix(1)+σ2)i
×2πλ(1)j x(1)e−πλ
(1)
j x(1)2dx(1). (4)
The inner expectation in (4) can be further simplified as
EI(1) x
h
Ph> τ(Pp)−1x(1)
β2
(Ipbs+Imue+σ2)
i
=exp −τσ 2
Ppx(1)−β2
!
EI(1) x
e
−τ(Ipbs+Imue)
Ppx(1)−β2
. (5)
By putting the value of expectation obtained in (5) back into (4), the coverage probability is given as
P(1)c (τ)=2πλ(1)j
Z
R2LIpbs(s)LImue(s)e
−τσ2
Ppx(1)−β2
×e−πλ
(1)
j x(1)2x(1)dx(1), (6)
whereLIpbs(.) andLImue(.) are the Laplace transforms of
inter-ference from the DL PBSs and UL MUEs from the respective regions and are given as
LIpbs(s)=exp
−πλ(1)
j (sPp) 2/β2C(1)
2
, (7)
LImue(s)=exp
−πλ(2)
k (sPm) 2/β1C(2)
1
. (8)
The proof for (7) and (8) are given in Appendices A and B, respectively.
Theorem 1: The probability of coverage of a DL PUE located at origin inR1is given as
P(1)c (τ)
=πλ(1)
j
Z R21
0 exp
−πv(1)λ(1)j −πv(1)λ(1)j τ2/β2C(1)
2
−πv(1)β2/β1λ(2)k
τP
m Pp
2/β1
C1(2)−(τσ 2
Pp
v(1)β2/2)
dv(1),
(9)
whereC2(1) = Rτ−(2/β2)(R1/x(1)) 2
τ−(2/β2) (1+( 1
u(1)β2/2))du
(1)andC(2) 1 =
R ( τPm
Ppx(1)−β2
)−2/β1(R2)2
( τPm
Ppx(1)−β2
)−2/β1(R1)2
( 1
1+(w(2)β1/2))dw
(2).
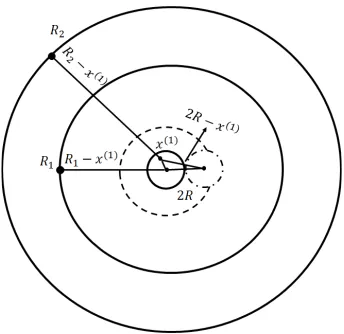
FIGURE 3. Integration limits for cumulative interference computation.
probability of DL PUE located inR2can be derived and the final expression is given as
P(2)c (τ)
=πλ(2)
j
Z R22
0
exp−πv(2)λ(2)j −πv(2)λ(2)j τ2/β2C(2)
2
−πv(2)β2/β1λ(1)k
τ
Pm Pp
2/β1
C1(1)−(τσ 2
Pp v
(2)β2/2)dv(2),
(10)
whereC2(2) =Rτ−(2/β2)(R2/x(2)) 2
τ−(2/β2)(R1/x(2))2(
1 1+(u(2)β2/2))du
(2) andC(1) 1 =
R ( τPm
Ppx(2)−β2
)−2/β1(R1)2
( τPm
Ppx(2)−β2
)−2/β1(x(1))2(
1
1+(w(1)β1/2))dw
(1).
B. COVERAGE PROBABILITY ANALYSIS USING FLUID MODEL
The coverage probability modeling for smaller path loss exponent values can be performed using the fluid model [29]. In this approach, we approximate the average value of interference, by replacing the interfering entities by an equivalent continuum of transmitters, assuming that the PBSs and MUEs are uniformly distributed in the network. Hence, network can be characterize by the PUE densityρ(PUEν) , PBSs densityρj(ν), and MUE densityρk(ν), respectively. The basic concept of this approach is illustrated in Fig. 3, where the network boundary is assumed to be circular having a radius R2, i.e, outer region of 2-RFA. The serving PBS is located at the origin, having a circular coverage area of radiusR. The PUE is situated at a distance x(1) within the coverage area of that PBS. The cumulative interference from both tiers is calculated by dividing the network into rings as explained in the following section.
1) APPROXIMATE CUMULATIVE INTERFERENCE CALCULATION
The interference from the PBSs having density ρj(1) to the intended PUE in the elementary surface rdrdθ is given as
ρ(1)
j rdrdθ, whereas from MUEs having densityρ (2) k to the PUE is depicted asρk(2)rdrdθ. Hence, the contribution of co-tier as well as cross-co-tier interference isPph(1)j r
−β2ρ(1)
j rdrdθ and Pmh(2)k r−β1ρk(2)rdrdθ, respectively. From Fig. 3, it is evident that the distance between the two neighboring PBSs is 2R, where coverage radiusR∝√E[Area]. Therefore, the distance between the PUE to the closest interfering PBS is taken as 2R−x(1). Extending the same concept, the integration surface for the PBSs is approximated with a ring having an inner radius 2R −x(1) and outer radius R1 −x(1). In the similar way, the interference from MUEs is approximated fromR1−x(1)toR2−x(1). Thus, the interference expression can be given as
I(x(1))
= Z 2π
0
Z R1−x(1)
2R−x(1) ρ
(1) j Pph
(1) j r
−β2rdrdθ
+ Z 2π
0
Z R2−x(1)
R1−x(1) ρ(2)
k Pmh (2) k r
−β1rdrdθ (11)
=
2πρj(1)Pph(1)j
β2−2 h
(2R−x(1))(2−β2)−(R
1−x(1))(2−β2) i
+2πρ (2) k Pmh(2)k
β1−2 h
(R1−x(1))(2−β1)−(R2−x(1))(2−β1) i
,
(12)
whereR is the radius of serving PBS, R1 and R2 are the radii of inner and outer regions of macrocell, respectively. Eventually, the average value of the cumulative interference can be computed as
E[Ix(1)]
= 2πρ (1) j Pp
β2−2 h
(2R−x(1))(2−β2)−(R
1−x(1))(2−β2) i
+2πρ (2) k Pm
β1−2 h
(R1−x(1))(2−β1)−(R2−x(1))(2−β1) i
.
(13)
2) COVERAGE PROBABILITY
The expression for the coverage probability is achieved by assuming the uniform distribution of interferers, distributed over the circular regions of equal area, where the resulting CDF is given as
P[x(1)≤χ]= χ 2
ζ2 f
ρ, 0≤χ≤R
whereρ represents the combined density of the interfering entities in both the regions andζf2is the empirically calculated value actin as a normalizing factor. The value of this factor depends upon the shape of the coverage area of BS [28]. Thus, the PDF is expressed as
f(x(1))= 2x (1)
ζ2 f
ρ, 0≤x(1)≤R.
P(1)c (τ) of a randomly chosen DL subscriber connected to PBS located inR1is given as
P(1)c (τ)= ρ
ζ2 f
Z R2
0
exp−τv(1)β2/2γ(1)(β,v(1))dv(1). (14)
Proof:
P(1)c (τ)=E(1)
x
h
EI(1)
x P
SINR(1)x > τi, (15)
P(1)c (τ)= ρ
ζ2 f
Z R
0
EI(1) x
h
Ph> τP−p1x(1)β2(σ2+Ix(1))i
×2x(1)dx(1). (16)
Expected value of inner probability can be further simpli-fied as
EI(1) x
P[h> τP−p1x(1)β2(σ2+Ipbs+Imue)
=e(−τP−1p x(1)β2σ2)E
Ix(1) h
exp
−P−p1τx(1)β2(Ipbs+Imue)i. (17)
Using Jensen’s inequality, we have
EI(1) x
h
exp−τP−p1x(1)β2Ix(1)i≥exp−τP−p1x(1)β2E[Ix(1)]. (18)
By replacing the expected value of interference obtained from (13) in (18), we get
EI(1) x
h
exp(−τP−p1x(1)β2Ix(1))i≥exp−τx(1)β2γ(1)(β,v(1)), (19)
where
γ(1)(β,v(1))=σ2 Pp +
2πρj(1)
β2−2α
(1)+ 2πρ (2) k Pm Pp(β1−2)µ
(2). (20)
In (20),α(1) =[(2R−v(1)1/2)(2−β2)−(R
1−v(1)1/ 2
)(2−β2)]
and µ(2) = [(R1 −v(1)1/ 2
)(2−β1) −(R
2 −v(1)1/ 2
)(2−β1)],
respectively. By substitutingx(1)2 = v(1)and by putting the value ofexp−τx(1)β2γ(1)(β,v(1))into (16), we get the final expression of coverage probability with interferers having uniformly distribution over the respective regions and which
completes the proof.
Following the similar procedure, the coverage probability of PUE located inR2can be derived. The final expression is given as
P(2)c (τ)= ρ
ζ2 f
Z R2
0
exp−τv(2)β2/2γ(2)(β,v(2))dv(2), (21)
where
γ(2)(β,v(2))= σ2 Pp+
2πρk(1)Pm Pp(β1−2)α
(2)+2πρ (2) j
β2−2µ
(1), (22)
whereα(2) =[(2R−v(2)1/2)(2−β1)−(2R+R
1−v(2)1/ 2
)(2−β1)],
andµ(1)=[(R1−v(2)1/ 2
)(2−β2)−(2R+R
2−v(2)1/ 2
)(2−β2)],
respectively.
Remarks:Now that we have derived the analytical cover-age probability expressions for the 2-RFA, the similar proce-dure is followed for the higher region RFA schemes. As DL PUEs in any region receive co-tier as well as cross-tier inter-ference only from one region. Therefore, the aforementioned analysis can be extended easily. In the subsequent section, we provide the expressions for M-4-RFA and explain the modification that occurs in the network while implementing this scheme.
IV. COVERAGE PROBABILITY ANALYSIS OF M-4-RFA Division of a macrocell reduces the number of interfering entities that utilize the same spectrum. Thus, the outage prob-ability is minimized, in addition throughput of the DL PUEs also alleviates. Therefore, we opt for a moderate option in which we divide the macrocell into 4 regions. In this scheme, the impact of interference is increased as compared to the corresponding 4 region RFA scheme, however, the users are provided with the higher data rates, as bandwidth division is similar to 2-RFA. The SINR expression for a DL PUE located inR1in M-4-RFA is given as
SINR(1)x = Pph (1) i ||x
(1) i ||
−β2
Ipbs+Imue+σ2
, (23)
whereIpbsis the interference from the downlink PBSs located inR1 andR3, andImue represents the interference arriving form all the transmitting uplink MUEs from regionR2andR4, respectively.IpbsandImueare expressed as
Ipbs =
X
x(1)j 8(1)j
x(1)j 6=x(1)i
Pph(1)j ||x (1) j ||
−β2+ X
xl(3)8(3)l
Pph(3)l ||x (3) l ||
−β2,
Imue = X
xk(2)8(2)k
Pmh(2)k ||x(2)k ||−β1+ X
x(4)n 8(4)n
Pmh(4)n ||xn(4)||−β1,
where8(1)j and8(3)l represent the independent PPPs of PBSs
inR1andR3, respectively, and8(2)k ,8 (4)
n are that of UL MUEs inR2andR4, respectively.
A. COVERAGE PROBABILITY OF M-4-RFA USING PPP
The analytical expression for the coverage probability can be derived using the similar procedure as above, however, for the interference calculation the Laplace transforms now include additional terms. The final expression of PUE located inR1 can be expressed as
P(1)c (τ)
=πλ(1)
j
Z R21
0
exp−πv(1)λ(1)j −πv(1)λ(1)j τ2/β2C(1)
2
−πv(1)β2/β1λ(2)k
τP
m Pp
2/β1
C1(2)−πv(1)λ(3)l τ2/β2C(3)
2
−πv(1)β2/β1λ(4)n
τ
Pm Pp
2/β1
C1(4)−(τσ 2
Pp v
(1)β2/2)dv(1),
where
C2(1) =
Z τ−(2/β2)(R1/x(1)) 2
τ−(2/β2) (
1
1+(u(1)β2/2))du
(1),
C2(3) =
Z τ−(2/β2)(R3/x(1))2
τ−(2/β2)(R2/x(1))2
( 1
1+(u(3)β2/2))du (3),
C1(2) = Z τ
Pmx(1)β2 Pp
!−2/β1
(R2)2
τPmx(1)β2
Pp
−2/β1
(R1)2
( 1
1+(w(2)β1/2))dw (2), and
C1(4) = Z
τPmx(1)β2
Pp
−2/β1
(R4)2
τPmx(1)β2
Pp
−2/β1
(R3)2
( 1
1+(w(4)β1/2))dw (4).
Whereas the coverage probability expressions for the pico users located in R2, R3, and R4 regions are given in Appendix C.
B. COVERAGE PROBABILITY OF M-4-RFA USING FLUID MODEL
The PBSs and MUEs are uniformly distributed in the four regions of a macrocell. Each PUE in any region receives cross-tier as well as co-tier interference from two regions, thus the PUE has to face co-tier as well as cross-tier inter-ference from four regions. Consequently, following coverage probability expression is obtained
P(1)c (τ)= ρ
ζ2 f
Z R2
0
exp(−τv(1)β2/2ψ(1)(β,v(1))dv(1), (25)
where
ψ(1)(β,v(1))
= σ 2
Pp
+
2πρj(1)
β2−2 h
(2R−v(1)1/2)(2−β2)−(R
1−v(1)1/ 2
)(2−β2)i
+ 2πρ (2) k Pm Pp(β1−2)
h
(R1−v(1)1/ 2
)(2−β1)−(R
2−v(1)1/ 2
)(2−β1)i
+2πρ (3) l
β2−2 h
(R2−v(1)1/ 2
)(2−β2)−(R
3−v(1)1/ 2
)(2−β2)i
+ 2πρ (4) n Pm Pp(β1−2)
h
(R3−v(1)1/ 2
)(2−β1)−(R
4−v(1)1/ 2
)(2−β1)i.
(26)
Following the similar procedure, the coverage probability of users located inR2,R3, andR4, respectively, can be derived. The final expressions are given in Appendix D.
C. COVERAGE RATE ANALYSIS
[image:8.576.301.542.64.221.2]Generally, the performance of network is evaluated in terms of eminent coverage improvement and enhanced data rates. In the above sections, the analytical closed-form expressions for the coverage probability have been derived, for the users having SINR greater than some threshold. In this section, exact rate distribution expression termed as rate coverage
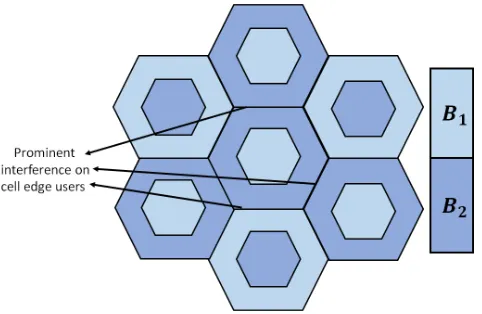
FIGURE 4. 2-RFA in a multi-cell scenario. The cell area is divided into two regions with frequency bandsB1andB2.
probability is provided, by virtue of which the probability that the rate of an intended user is greater than the given threshold can be calculated. The expression for the rate coverage is derived in the following lemma.
Lemma 1: Given the SINR coverage probability greater than the thresholdτ,Pc(τ), the coverage rate probability is evaluated as P(δ)=Pc(2δ/1B−1).
Proof: The proof is similar to [15], for δ < 1Blog2 (1+τmax), whereδis the rate threshold,1B=B/N,B rep-resents the total system bandwidth andNdepicts the number of sub-bands provided to the users of each RFA scheme, like 2, 4, M-4, and 8-RFA scheme. The final expression directly follows and can be evaluated through a change of variablesP(δ)=P[SINR>2δ/1B−1]=Pc(2δ/1B−1).
V. RFA IN MULTI-CELL NETWORK
Given the SINR of downlink PUEs, we have formulated a framework which allows to analyze the network when the DL PUEs are located in a single macrocell partitioned into regions of equal area and receive interference from the UL MUEs and DL PBSs of the respective regions other than the serving PBS. In this section, we discuss the impact of inter-cell interference on the DL PUEs. While extending the baseline 2-RFA scheme in multi-cell, the distance between the macro as well as the pico users exploiting the same sub-carriers is reduced drastically, causing considerate amount of interference both from co-tier and cross-tier. This can be seen in Fig. 4, as the PUEs ofR2region in the central cell have to face prominent interference directly from the adjacent regions of neighboring cells, exploiting the same spectrum. There-fore, due to the inevitable intercell interference (ICI) from the neighboring cells, the SINR of cell edge users is affected immensely, making 2-RFA a less appropriate solution, even in multi-cellular network [26].
FIGURE 5. 4-RFA in a multi-cell scenario. The cell area is divided into four regions with frequency bandsB1,B2,B3andB4.
When 4-RFA scheme is extended in multi-cell, the interfer-ing cells experience maximum attenuation in their signals, i.e., the distance between the intended PUE and interfering cells is increased, which is evident in Fig. 5. It can be observed from the figure that the cell edge PUEs inR4do not receive any co-tier interference from the adjacent regions of neigh-boring cells but only cross-tier interference from low powered MUEs from two neighboring cells. Thereby, the impact of interference becomes negligible, as a consequence, higher SINR is achieved. By opting the other higher region RFA schemes, for instance, 8-RFA and 16-RFA, the chance that the PUEs receive interference from the adjacent regions of other cells declines further, however, the issue of availability of smaller sub-bands to the users still persists. On the other hand, implementing the M-4-RFA scheme in multicell, the number of interfering entities in the adjacent regions of other cells is reduced. In this way, maximum benefit from the bandwidth can be exploited by making the impact of interference neg-ligible. Therefore, M-4-RFA provides significant gains even when cross-tier interference of multi-cell is considered, the simulation results provide validation in the next section.
VI. RESULTS & SYSTEM PERFORMANCE
In the previous sections, the analytical expressions for the coverage probability and rate coverage have been derived, whereas the accuracy of these expressions is validated through simulations in this section. To investigate the system performance, two simulation scenarios are considered. In the first case, the location of the PBSs, PUEs and that of MUEs is assumed to be uniformly distributed, whereas the second case follows by modeling the locations of PBSs and MUEs as spatial PPPs.
[image:9.576.62.252.65.215.2]A two tier network is considered, where the radius of macro cell is assumed 1 km and is divided into two regions of equal area for 2-RFA and four regions of equal area for 4-RFA and M-4-RFA schemes, respectively. The rest of the parameters are shown in Table II. The compari-son of three theoretically derived results of 2-RFA, 4-RFA and M-4-RFA, using fluid model with that of Monte-Carlo
[image:9.576.298.532.74.416.2]TABLE 2.Simulation parameters.
FIGURE 6. Coverage probability comparison of 2, 4, M-4, 8-RFA schemes in a two tier network (β1=3,β2=2.5, No noise).
simulations along with 8-RFA is depicted in Fig. 6. The path loss exponent for pico cells is taken as 2.5 and that of macro users as 3. It can be noticed that as we divide the macrocell area into higher regions, the coverage probability increases, i.e, 8-RFA provides best coverage as compared to 4-RFA. Similarly 4-RFA outperforms 2-RFA. The figure also shows that M-4-RFA provides better coverage as compared to 2-RFA when the downlink PUE receives the same amount of interference as in 2-RFA, however these entities are now distantly located, due to modified sub-band alloca-tion. In 4-RFA, users of each region get cross-tier inter-ference from only one region, therefore, a better coverage is obtained, however the users are deprived of higher data rates, due to bandwidth division. From the figure, it is also validated that the simulation results agree with the trends generated through the analytical expressions for varying SINR threshold. In Fig. 7, the path loss exponents of pico tier and that of macro tier are assumed as 2.75 and 3.5, respectively. The figure also follows the similar trends in the simulation as well as the numerically computed values as of Fig. 6.
FIGURE 7. Coverage probability comparison of 2, 4, M-4, 8-RFA schemes in a two tier network (β1=3.5,β2=2.75, No noise).
FIGURE 8. Coverage probability comparison of different RFA schemes in a two tier network , (β1=4,β2=3.5,λ2=3λ1, No noise).
exponents for the pico cells and macrocell are 3.5 and 4 for Fig. 8, whereas 3.75 and 4.5 for Fig. 9, respectively. Firstly, the simulation results are quite close to analytical ones. Another fact that can be observed, it is not useful to partition the macrocell into higher regions because after dividing the macrocell into more than 8 regions, saturation occurs and no significant improvement in coverage probability is achieved. Next the impact of thermal noise on the achievable cover-age probability is investigated, the remaining simulation envi-ronment remains the same and thermal noise density is taken as −174 dBm/Hz. The result is provided in Fig. 10, which verifies the fact that even after including noise the intended downlink users follow the same coverage trend when only interference is considered. For instance, at the SINR threshold value of 8 dB, the coverage probability of users implementing 2-RFA scheme is affected by 0.01% and that of M-4-RFA by 0.008% with the addition of noise. Hence, this result supports
[image:10.576.39.274.300.485.2]FIGURE 9.Coverage probability comparison of different RFA schemes in a two tier network , (β1=4.5,β2=3.75,λ2=3λ1, No noise).
FIGURE 10.Coverage probability comparison of RFA schemes in a two tier network (β1=2.75,β2=3.5, noise thermal density= −174 dBm/Hz).
the claim that in the presence of interference, noise is not an influential factor and thus can be ignored.
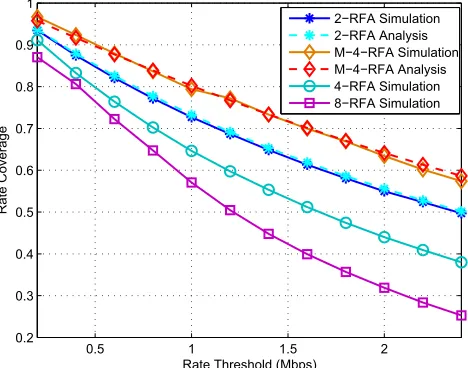
The graphs in Figs. 11 and 12, show rate coverage prob-abilities,P(δ), as a function of the rate thresholdδ. We can observe that the M-4-RFA shows higher rates as opposed to the 2, 4 and 8-RFA, which is expected given the reduced level of interference and greater bandwidth allotted to users. We can also see that the simulation results follow the similar trend generated using Lemma 1.
[image:10.576.299.534.303.486.2]FIGURE 11. Rate coverage comparison between RFA schemes in a two tier network. (The operational system bandwidth is assumed 10 MHz, β1=3.5,β2=2.75).
FIGURE 12. Rate coverage comparison between RFA schemes in a two tier network. (The operational system bandwidth is assumed 10 MHz, β1=4,β2=3).
single cell (SC) and multi-cell (MC) scenarios where the results are generated through Monte-Carlo simulations when the radius of macrocells is assumed as 2000 m, and path loss exponents for the small cells and macrocells are 2.5 and 3, respectively. From this figure, it can be observed that the intercell interference in 2-RFA is much greater than the rest of the RFA schemes and SRF scheme. The hybrid M-4-RFA scheme has a slightly greater interference than the regular 4-RFA scheme due to increased interfering cells. However, even with the elevated interference, the users now can get better data rates. Dividing the macrocell into higher regions reduces the gap between outage probability of SC and MC, because of increased separation among the users.
[image:11.576.298.533.290.480.2]Finally, in Fig. 14, we depict the outage capacity, which is defined as the maximum constant rate that is maintained for the success probability. The 2-RFA scheme provides channel fairness, as a consequence, the cell edge users do not achieve
FIGURE 13. Outage probability of various RFA schemes in single and multi-cell scenarios (τ=0.4,β1=3,β2=2.5).
FIGURE 14. Outage capacity of downlink PUEs in multi-cell with increasing user density (β1=3,β2=2.5,B=10MHz).
favorable data rates, whereas M-4-RFA is a scheme that provides fairness to all the users, as the intended PUEs have higher SINR in addition to better data rates. Eventually, when the performance is evaluated in terms of outage capacity, which depicts the sum rate of the users when they are in coverage instead of ergodic rate, it can be observed that the M-4-RFA provides higher outage capacity as compared to baseline schemes, which approves that even at higher user density, hybrid RFA scheme outperforms all the remaining RFA schemes.
VII. CONCLUSION
[image:11.576.39.273.299.483.2]combines the prominent aspects of various RFA schemes. Consequently, significant gains in terms of coverage and throughput are achieved. Approximated closed-form expres-sions for the coverage probability and rate coverage are derived using two approaches. The performance of the net-work is evaluated by varying sets of parameters, which ver-ifies the fact that despite of slightly increased complexity as compared to baseline 2-RFA and SFR scheme, the proposed M-4-RFA scheme provides prominent performance gain. As a future work, the analytical modeling can be extended to the multi cellular network, where the impact of sectoring, addi-tion of antennas and power allocaaddi-tion schemes can also be studied.
APPENDIX A
The Laplace transform definition yields
LIpbs(s)
=Ehe−sIpbsi,
=E exp −s
X
xj(1)∈8(1) j /x(1)
Pph(1)j ||x (1) j ||
−β2
, (27)
=E
Y
x(1)j ∈8(1) j /x(1)
exp−sPph(1)j ||x (1) j ||
−β2
, (28)
=E 8(1) j Y
x(1)j ∈8(1)j /x(1)
1
1+sPp||xj(1)||−β2
. (29)
The channel gains are Rayleigh fading and are indepen-dent of PPP. The sum over PPP leads to the product form in (28) and the moment generating function of an exponen-tial random variable yields (29). By applying the probabil-ity generation functional (PGFL) of PPP we obtain (30). Transformation of Cartesian to polar coordinates xj(1) =
(r, θ), gives
LIpbs(s)=exp
λ(1) j
Z
R2/x(1)
(1− 1
1+sPp||x(1)||−β2)dx
(1) , (30) =exp −2πλ(1)j
Z R1
x(1)
(1− 1
1+sPpr−β2)rdr
, (31)
whereR1 is the radius of region 1 of macrocell. Thus, the interference from all the PBSs present in this region other than the serving BS at distancex(1)is calculated by implementing the change of variables u(1) = τ−2/β2( r
x(1))
2. The Laplace
transform is given by
LIpbs(s)=exp
−πλ(1)
j (sPp) 2/β2C(1)
2
, (32)
whereC2(1)=Rτ−(2/β2)(R1/x(1))2
τ−(2/β2) ( 1
1+(u(1)β2/2))du
(1).
APPENDIX B
The Laplace transform of cumulative interference from the MUEs located inR2is given as
L Imue(2)(s)
=Ehe−sImuei,
=E exp −s
X
x(2)k ∈8(2) k
Pmh(2)k ||x (2) k ||
−β1
, (33)
=E
Y
xk(2)∈8(2)k
exp
−sPmh(2)k ||xk(2)||−β1
, (34)
=E82 k
Y
x(2)k ∈82 k
1
1+sPm||xk(2)||−β1
, (35)
=exp
λ(2) k
Z
R2(1
− 1
1+sPm||x(2)||−β1)dx
(2)
, (36)
=exp
−2πλ(2)k
Z R2
R1
(1− 1
1+sPmr−β1 )rdr
, (37)
where the integration limit fromR1toR2, defines the annu-lar region of macrocell. Following the same procedure as in Appendix A and implementing the change of variables w(2) = (τPmx(1)β2
Pp )
−2/β1(r)2, the Laplace transform can be
further simplified as
LImue(s)=exp
−πλ(2)
k (sPm) 2/β1C(2)
1
, (38)
whereC1(2)=R ( τPm
Ppx(1)−β2
)−2/β1(R2)2
( τPm
Ppx(1)−β2) −2/β1(R1)2
( 1
1+(w(2)β1/2))dw
(2).
APPENDIX C
The impact of cumulative co-tier as well as cross-tier inter-ference from all the four regions is obtained by deriving the Laplace transforms of interference from the DL and UL transmitters. By following the above mentioned procedure, the coverage probability of PUE located inR2is given as
P(2)c (τ)
=πλ(2)
j
Z R22
0
exp−πv(2)λ(2)j −πv(2)λ(2)j τ2/β2C(2)
2
−πv(2)β2/β1λ(1)k
Pmτ Pp
2/β1
C1(1)−πv(2)λ(4)l τ2/β2C(4)
2
−πv(2)β2/β1λ(3)n
P
mτ Pp
2/β1
C1(3)−(τσ 2
Pp
v(2)β2/2)
dv(2).
(39)
expression becomes
P(3)c (τ)
=πλ(3)
j
Z R23
0 exp
−πv(3)λ(3)j −πv(3)λ(3)j τ2/β2C(3)
2
−πv(3)β2/β1λ(4)k
P
mτ Pp
2/β1
C1(2)−πv(3)λ(1)l τ2/β2C(1)
2
−πv(3)β2/β1λ(2)n
P
mτ Pp
2/β1
C1(4)−(τσ 2
Pp
v(3)β2/2)dv(3).
(40)
Similarly, when the PUE is inR4 region, it receives cross-tier interference fromR1andR3, respectively. The coverage probability is expressed as
P(4)c (τ)
=πλ(4)
j
Z R24
0
exp−πv(4)λ(4)j −πv(4)λ(4)j τ2/β2C(4)
2
−πv(4)β2/β1λ(3)k
Pmτ
Pp
2/β1
C1(1)−πv(4)λ(2)l τ2/β2C(2)
2
−πv(4)β2/β1λ(1)n
P
mτ Pp
2/β1
C1(3)−(τσ 2
Pp v
(4)β2/2)dv(4).
(41)
APPENDIX D
When the pico user is located in R2 region, the uniformly distributed PBSs other than the serving PBS in that region act as interferers, along with the PBSs inR4region. Therefore, by evaluating the expected value of interference as in (26). The PUE that is located inR2region has coverage probability
P(2)c (τ)= ρ
ζ2 f
Z R2
0 exp
−τv(2)β2/2ψ(2)(β,v(2))dv(2). (42)
Similarly, when a PUE is inR3, the lower bound of coverage probability is expressed as
P(3)c (τ)= ρ
ζ2 f
Z R2
0
exp−τv(3)β2/2ψ(3)(β,v(3))dv(3). (43)
Finally, coverage probability of a PUE that is located inR4is given as
P(4)c (τ)= ρ
ζ2 f
Z R2
0
exp−τv(4)β2/2ψ(4)(β,v(4))dv(4), (44)
where ψ(2)(β,v(2)), ψ(3)(β,v(3)) and ψ(4)(β,v(4)), can be obtained by computing the integration limits for cumulative interference similar to (13) and (26).
REFERENCES
[1] S. Chen and J. Zhao, ‘‘The requirements, challenges, and technologies for 5G of terrestrial mobile telecommunication,’’IEEE Commun. Mag., vol. 52, no. 5, pp. 36–43, May 2014.
[2] J. G. Andrewset al., ‘‘What will 5G be?’’IEEE J. Sel. Areas Commun., vol. 3, no. 6, pp. 1065–1082, Jun. 2014.
[3] A. Ghoshet al., ‘‘Heterogeneous cellular networks: From theory to prac-tice,’’IEEE Commun. Mag., vol. 50, no. 6, pp. 54–64, Jun. 2012.
[4] X. Wu, B. Murherjee, and D. Ghosal, ‘‘Hierarchical architectures in the third-generation cellular network,’’IEEE Wireless Commun., vol. 11, no. 3, pp. 62–71, Jun. 2004.
[5] V. Chandrasekhar, J. G. Andrews, and A. Gatherer, ‘‘Femtocell networks: A survey,’’IEEE Commun. Mag., vol. 46, no. 9, pp. 59–67, Sep. 2008. [6] J. G. Andrews, H. Claussen, M. Dohler, S. Rangan, and M. C. Reed,
‘‘Femtocells: Past, present, and future,’’IEEE J. Sel. Areas Commun., vol. 30, no. 3, pp. 497–508, Apr. 2012.
[7] H. Munir, S. A. Hassan, H. B. Parveiz, L. Musavian, and Q. Ni, ‘‘Energy efficient resource allocation in 5G hybrid heterogeneous networks: A game theoretic approach,’’ in Proc. IEEE Veh. Technol. Conf. (VTC-Fall), Sep. 2016.
[8] Small Cell Forum. Small Cell Market Status, accessed on (Jun. 2016). [Online]. Available: http://www.smallcellforum.org/
[9] S. Park, W. Seo, S. Choi, and D. Hong, ‘‘A beamforming codebook restriction for cross-tier interference coordination in two-tier femtocell networks,’’IEEE Trans. Veh. Technol., vol. 60, no. 4, pp. 1651–1663, Apr. 2011.
[10] D. Lopez-Perez, I. Guvenc, G. de la Roche, M. Kountouris, T. Q. S. Quek, and J. Zhang, ‘‘Enhanced intercell interference coordination challenges in heterogeneous networks,’’ IEEE Wireless Commun., vol. 18, no. 3, pp. 22–30, Jun. 2011.
[11] M. Peng, K. Zhang, J. Jiang, J. Wang, and W. Wang, ‘‘Energy-efficient resource assignment and power allocation in heterogeneous cloud radio access networks,’’ IEEE Trans. Veh. Technol., vol. 64, no. 11, pp. 5275–5287, Nov. 2014.
[12] Y. Lin, W. Bao, W. Yu, and B. Liang, ‘‘Optimizing user association and spectrum allocation in HetNets: A utility perspective,’’IEEE J. Sel. Areas Commun., vol. 33, no. 6, pp. 1025–1039, Jun. 2015.
[13] J. G. Andrews, ‘‘Seven ways that HetNets are a cellular paradigm shift,’’ IEEE Commun. Mag., vol. 51, no. 3, pp. 136–144, Mar. 2013.
[14] N. Saquib, E. Hossain, and D. Kim, ‘‘Fractional frequency reuse for inter-ference management in LTE-advanced hetnets,’’IEEE Wireless Commun., vol. 20, no. 2, pp. 113–122, Apr. 2013.
[15] S. Singh, H. S. Dhillon, and J. G. Andrews, ‘‘Offloading in heterogeneous networks: Modeling, analysis, and design insights,’’IEEE Trans. Wireless Commun., vol. 12, no. 5, pp. 2484–2497, May 2013.
[16] M. Bennis, M. Simsek, A. Czylwik, W. Saad, S. Valentin, and M. Debbah, ‘‘When cellular meets WiFi in wireless small cell networks,’’ IEEE Commun. Mag., vol. 51, no. 6, pp. 44–50, Jun. 2013.
[17] T. Zahir, K. Arshad, A. Nakata, and K. Moessner, ‘‘Interference man-agement in femtocells,’’IEEE Commun. Surveys Tuts., vol. 15, no. 1, pp. 293–311, 1st Quart., 2013.
[18] S. U. Abdullahi, J. Liu, C. Huang, and X. Zhang, ‘‘Enhancing throughput performance in LTE-advanced HetNets with buffered fractional frequency reuse,’’ in Proc. IEEE Int. Conf. Ubiquitous Future Netw. (ICUFN), Jul. 2016, pp. 918–923.
[19] T. D. Novlan, R. K. Ganti, A. Ghosh, and J. G. Andrews, ‘‘Analytical eval-uation of fractional frequency reuse for heterogeneous cellular networks,’’ IEEE Trans. Commun., vol. 60, no. 7, pp. 2029–2039, Jul. 2012. [20] R. Singh and C. S. R. Murthy, ‘‘Techniques for interference mitigation
using cooperative resource partitioning in multitier LTE HetNets,’’IEEE Syst. J., to be published, doi: 10.1109/JSYST.2016.2527504
[21] D. Muirhead, M. Imran, and K. Arshad, ‘‘A survey of the challenges, opportunities and use of multiple antennas in current and future 5G small cell base stations,’’IEEE Access, vol. 4, pp. 2952–2964, 2016.
[22] R. Zahid, A. Ur Rahman, and S. A. Hassan, ‘‘On the performance of multiple region reverse frequency allocation scheme in a single cell down-link heterogeneous networks,’’ inProc. IEEE Wireless Commun. Mobile Comput. Conf. (IWCMC), Aug. 2014, pp. 387–392.
[23] P. Jacob, A. S. Madhukumar, and A. P. Vinod, ‘‘Handling interference in self-organizing femtocell networks through frequency-polarization diver-sity,’’Wireless Netw., vol. 22, no. 2, pp. 383–401, 2016.
[24] P. Jacob, A. James, and A. S. Madhukumar, ‘‘Interference mitiga-tion through reverse frequency allocamitiga-tion in multi-tier cellular network: A downlink perspective,’’Wireless Netw., vol. 21, no. 5, pp. 1613–1629, Jul. 2015.
[25] H. B. Chang and I. Rubin, ‘‘Optimal downlink and uplink fractional frequency reuse in cellular wireless networks,’’IEEE Trans. Veh. Technol., vol. 65, no. 4, pp. 2295–2308, Apr. 2016.
[27] J. G. Andrews, F. Baccelli, and R. K. Ganti, ‘‘A tractable approach to coverage and rate in cellular networks,’’IEEE Trans. Commun., vol. 59, no. 11, pp. 3122–3134, Nov. 2011.
[28] H. Zhang, S. Chen, L. Feng, Y. Xie, and L. Hanzo, ‘‘A universal approach to coverage probability and throughput analysis for cellular networks,’’IEEE Trans. Veh. Technol., vol. 64, no. 9, pp. 4245–4256, Sep. 2015.
[29] J. M. Kelif, M. Coupechoux, and P. Godlewski, ‘‘A fluid model for per-formance analysis in cellular networks,’’EURASIP J. Wireless Commun. Netw., vol. 2010, Aug. 2010, Art. no. 435189.
ANEEQA IJAZreceived the B.S. degree in electri-cal engineering from the University of Engineering and Technology, Lahore, Pakistan, in 2013. She is currently pursuing the M.S. degree in electrical engineering with the School of Electrical Engi-neering and Computer Science, National Univer-sity of Sciences and Technology, Pakistan. Her research interest includes wireless communica-tion, 5G heterogeneous networks, and stochastic geometry.
SYED ALI HASSAN received the B.E. degree (Hons.) in electrical engineering from the National University of Sciences and Technology (NUST), Pakistan, in 2004, the M.S. degree in electri-cal engineering from the University of Stuttgart, Germany, in 2007, and the M.S. degree in math-ematics and the Ph.D. degree in electrical engi-neering from the Georgia Institute of Technology, Atlanta, GA, USA, in 2011. His broader area of research is signal processing for communications. He was a Research Associate with Cisco Systems Inc., CA, USA. He is currently an Assistant Professor with the School of Electrical Engineering and Computer Science, NUST, where he is also the Director of Information Processing and Transmission Research Group, which focuses on various aspects of theoretical communications. He has coauthored over 75 publi-cations in international conferences and journals. He served as a the TPC Member of the IEEE WCSP 2014, the IEEE PIMRC 2013–2014, the IEEE VTC 2013, and the MILCOM 2014–2016.
SYED ALI RAZA ZAIDI received the B.Eng. degree in information and communication system engineering from the School of Electronics and Electrical Engineering, NUST, Pakistan in 2008. From 2007 to 2008, he served as a Research Assis-tant with the Wireless Sensor Network Labora-tory on a collaborative research project between NUST, Pakistan, and Ajou University, South Korea. He was a Visiting Research Scientist with the Qatar Innovations and Mobility Center in 2013. His research is focused toward design and analysis of the large-scale ad hoc wireless networks by employing tools from stochastic geometry and random graph theory. He is currently with the University of Leeds, U.K., and is a U.K. Liasion of the European Association for Signal Processing. He received the NUST’s most prestigious Rectors Gold Medal for his final-year project. In 2008, he received the Overseas Research Student Scholarship along with the Tetley Lupton and Excellence Scholarships to pursue the Ph.D. with the School of Electronics and Electrical Engineering, University of Leeds. He also received COST IC0902, DAAD, and Royal Academy of Engineering grants to promote his research. He has served on the program committees and as a chair in various IEEE flagship conferences. He has also served as a Track Chair of the Theory and modeling track at the IEEE/ICST CROWNCOM 2015. He is currently the Technical Program Chair of the EAI STEMCOM 2016 and the workshop chair of the IEEE CAMAD 2015 special session on the Performance Analysis and Modeling of Large-scale 5G networks, the IEEE WCMC 2015 workshop on Recent Advances at Physical Layer for 5G Wireless Networks, and the IEEE VTC workshop on emerging device centric communication. He has served as an Invited Reviewer of the IEEE flagship journals and conferences. He is also a Lead Guest Editor of theIET Signal ProcessingSpecial Issue on Recent Advances in Signal Processing for 5G Wireless Networks and an Associate Editor of the IEEE COMMUNICATION
LETTERS.
DUSHANTHA NALIN K. JAYAKODYreceived the B.E. degree (Hons.) in electronics engineering from Pakistan in 2009. and was ranked as the merit position holder of the University, the M.Sc. degree (Hons.) in electronics and communications engineering from the Department of Electrical and Electronics Engineering, Eastern Mediterranean University, Turkey, in 2010, and ranked as the first merit position holder of the Department, and the Ph.D. degree in electronics, electrical and commu-nications engineering from the University College Dublin, Ireland, in 2014. Since 2014, he has been holding a post-doctoral position with the Coding and Information Transmission Group, University of Tartu, Estonia, and Uni-versity of Bergen, Norway. He is currently a Professor with the Department of Software Engineering, Institute of Cybernetics, National Research Tomsk Polytechnic University, Russia. He received the SAARC Scholarship and the University Full Graduate Scholarship. He has served as a Session Chair or a Technical Program Committee Member for various international confer-ences, such as the IEEE PIMRC 2013/2014, the IEEE WCNC 2014/2016, and the IEEE VTC 2015.