eurostat
OFICINA ESTADÍSTICA DE LAS COMUNIDADES EUROPEAS DE EUROPÆISKE FÆLLESSKABERS STATISTISKE KONTOR STATISTISCHES AMT DER EUROPÄISCHEN GEMEINSCHAFTEN ΣΤΑΤΙΣΤΙΚΗ ΥΠΗΡΕΣΙΑ ΤΩΝ ΕΥΡΩΠΑΪΚΩΝ ΚΟΙΝΟΤΗΤΩΝ STATISTICAL OFFICE OF THE EUROPEAN COMMUNITIES OFFICE STATISTIQUE DES COMMUNAUTÉS EUROPÉENNES ISTITUTO STATISTICO DELLE COMUNITÀ EUROPEE
BUREAU VOOR DE STATISTIEK DER EUROPESE GEMEENSCHAPPEN SERVIÇO DE ESTATÍSTICA DAS COMUNIDADES EUROPEIAS
L2920 Luxembourg Tél. 43011 Télex : Comeur Lu 3423
B1049 Bruxelles, bâtiment Berlaymont, rue de la Loi 200 (bureau de liaison) Tél. 2351111
Las publicaciones de Eurostat están clasificadas por temas y por series. La clasificación se encuentra al final de la obra. Para mayor información sobre las publicaciones, rogamos se pongan en contacto con Eurostat.
Para los pedidos, diríjanse a las oficinas de venta cuyas direcciones figuran en la página interior de la contracubierta.
Eurostats publikationer er klassificeret efter emne og serie. En oversigt herover findes bag i hæftet. Yderligere oplysninger om publikationerne kan fås ved henvendelse til Eurostat.
Bestilling kan afgives til de salgssteder, der er anført på omslagets side 3.
Die Veröffentlichungen von Eurostat sind nach Themenkreisen und Reihen gegliedert. Die Gliederung ist hinten in jedem Band aufgeführt. Genauere Auskünfte über die Veröffentlichungen erteilt Eurostat. Ihre Bestellungen richten Sie bitte an die Verkaufsbüros, deren Anschriften jeweils auf der dritten Umschlagseite der Veröffentlichungen zu finden sind.
Οι εκδόσεις της Eurostat ταξινομούνται κατά θέμα και κατά σειρά. Η ακριβής ταξινόμηση αναφέρεται στο τέλος κάθε έκδοσης. Για λεπτομερέστερες πληροφορίες σχετικά με τις εκδόσεις, μπορείτε να απευθύνεσθε στην Eurostat.
Για τις παραγγελίες μπορείτε να απευθύνεσθε στα γραφεία πώλησης, των οποίων οι διευθύνσεις αναγράφονται στη σελίδα 3 του εξωφύλλου.
Eurostat's publications are classified according to themes and series. This classification is indicated at the end of the publication. For more detailed information on publications, contact Eurostat.
Orders are obtainable from the sales offices mentioned on the inside back cover.
Les publications de l'Eurostat sont classées par thème et par série. Cette classification est précisée à la fin de l'ouvrage. Pour des informations plus détaillées sur les publications, contactez l'Eurostat.
Pour les commandes, adressez-vous aux bureaux de vente dont les adresses sont indiquées à la page 3 de la couverture.
Le pubblicazioni dell'Eurostat sono classificate per tema e per serie. Tale classificazione è precisata alla fine dell'opera. Per informazioni più dettagliate sulle pubblicazioni rivolgersi all'Eurostat.
Per eventuali ordinazioni rivolgersi a uno degli uffici di vendita i cui indirizzi figurano nella 3a pagina della copertina.
De publikaties van Eurostat zijn ingedeeld naar onderwerp en serie. Deze indeling is achter in het boek opgenomen. Voor nadere informatie over de publikaties kunt u zich wenden tot Eurostat.
Gelieve bestellingen op te geven bij de verkoopbureaus, waarvan de adressen op bladzijde 3 van de omslag zijn vermeld.
As publicações do Eurostat estão classificadas por tema e por série. Esta classificação está indicada no fim da obra. Para mais informações sobre as publicações é favor contactar Eurostat.
This publication is also available in the following languages:
ES ISBN 9282612503
DE ISBN 9282612511
FR ISBN 9282612538
IT ISBN 9282612546
Translations into Danish, Dutch, Greek and Portuguese are available, on request, in duplicated form, from Eurostat.
Cataloguing data can be found at the end of this publication
Luxembourg: Office for Official Publications of the European Communities, 1990
ISBN 928261252X
Catalogue number: CA5689740ENC
© ECSC — EEC — EAEC, Brussels ■ Luxembourg, 1990
Contents
Page
Introduction 5 Chapter I The nature of labour force surveys 7
What is a labour force survey? 7 The history of labour force surveys 8 Chapter II The organization of the Community labour force survey 9
Chapter III Labour market characteristics on which information is
sought 11 Chapter IV Labour force concepts and definitions 13
Chapter V The Community labour force survey — Presentation of
results 17 The annual Community labour force survey publication 17
Other sources through which the Community labour force
survey results are made available 26 The Eurostat regional databank 26 Special or ad hoc tabulations of Community labour force
survey data 27 Chapter VI The potential for assessing labour market issues in a wider
social context 29 Discouraged workers 29 Underemployment 30 The household dimension in a labour market context 31
References 31 Appendix A The Community Regulation governing the conduct of the
1988 labour force survey 33 Appendix Β List of aspects on which information is sought in the Com
munity labour force survey 35 Appendix C The detailed categories specified for each aspect on which
information is sought in the Community labour force survey 37 Appendix D Subdivision by economic activity and sector used in present
ing labour force survey results corresponding to the NACE
categories 51 Appendix E Regional codes for Level I and Level II of the nomenclature
INTRODUCTION
This publication is intended to provide assistance to
persons who wish to utilize the results of the Community
labour force survey. While the document does not
pre-sume any detailed prior knowledge on the part of the
reader (and in this sense is self-standing) certain aspects,
such as the items of information covered in the inquiry,
are described in analysing specific issues in more depth.
While technical aspects (such as the sampling
methodo-logy) are described in this document, these descriptions
are of a summary nature. Reference should be made to
the 1988 Eurostat publication
Labour force sample survey
- Methods and definitions
for a more detailed discussion
of these aspects.
This report is structured as follows. Chapter I explains the
nature of labour force surveys and sets out in particular
the advantages of household-based inquiries in providing
labour market information. This chapter also briefly
sketches the history of the development of these surveys.
Chapter II describes how the Community labour force
survey is organized throughout the Community while
Chapter III describes the particular characteristics on
which personal information is sought. Chapter IV
des-cribes the concepts and definitions used in the inquiry
relating to employment, unemployment, the labour force
as a whole and the economically inactive population. The
information which is made available from the Community
labour force survey by means of official Commission
reports and databanks is described in some detail in
Chapter V. The major part of this chapter is concerned
with describing the content of the annual Eurostat
Com-munity labour force survey report relating to overall
popu-lation aspects, employment, unemployment, hours
worked and search for work. The final chapter illustrates
the potential of the labour force survey in providing labour
market information in the context of a wider social
set-ting, covering such aspects as discouragement,
underem-ployment and the extent to which the wider population in
households generally is affected by labour market
phe-nomena.
Chapter I
The nature of labour force surveys
What is a labour force survey?
Basically a labour force survey is an inquiry directed to
households designed to obtain information on
employ-ment and related issues by means of personal interviews.
As it would clearly involve considerable expense to
include all the households in a country in such an
exercise (as, however, is done in censuses of population)
such surveys are usually confined to a sample of
house-holds, the actual size of which depends primarily on the
level of detail required in the survey estimates.
There are a number of advantages in using an approach
of this kind in collecting labour market information. In the
first place it affords the opportunity to obtain information
on relevant labour market aspects across all sectors of
the economy in a consistent manner. It also facilitates
the interpretation of the information in a wider population
setting, since the information collected need not
neces-sarily be confined to persons in the labour force (i. e.
those employed or unemployed) but can involve all
per-sons in the households covered. In current labour market
circumstances this is an important additional dimension
as analysis is increasingly concerned with those on the
peripheries of the labour market. In recent decades the
borderline between the labour force and what is termed
the 'economically inactive' population has become
increasingly blurred, due to the increasing incidence of
part-time and temporary work and the ease with which
large numbers of persons (particularly women and young
persons in the final stages of their education) repeatedly
enter or leave the labour force. Furthermore, the
emer-gence of mass unemployment and long-term
unemploy-ment have resulted in a great many individuals becoming
'marginalized' in the sense that they tend to lose tangible
contact with the core labour market. The wider coverage
associated with labour force surveys also allows the
possibility of assessing labour market effects in a
house-hold or family context. This is important if, for example,
one wishes to measure the extent to which persons other
than those directly involved (e. g. spouses, other
depen-dants, etc.) are affected by the circumstances of
unem-ployment.
Another advantage of a labour force survey is that it
affords the opportunity to define relevant labour market
characteristics in a manner not possible with other
statis-tical sources. Thus, for example, one can identify the
degree of employment engaged in by an individual in
terms of the hours worked, and attempt to conceptualize
unemployment in terms of aspects such as job search
and availability for work. This is important not only
because of the advantages it confers in being able to
define labour market entities in a more meaningful way,
but it also creates the possibility of achieving much
greater international comparability in the compilation of
labour force estimates - if, of course, different countries
adopt the same or reasonably similar definitions. The
last-mentioned aspect is clearly of considerable
impor-tance in a Community context.
There are however some limitations which apply to labour
force surveys. Cost considerations place a constraint on
the overall household sample size and the resultant
sampling variability limits the level of detail that can
reasonably be shown. Thus, for example, while the labour
force survey can be used to compile estimates of
employ-ment across economic sectors, it cannot be expected to
yield reliable figures at a detailed level of regional
disag-gregation, or for individual small industrial or commercial
subsectors. The sampling base on which such estimates
would depend would be too small, and the degree of
variability correspondingly high. For the same reason,
there is also a limit to what can be achieved with labour
force surveys in monitoring trends over time (in
employ-ment and unemployemploy-ment, for example), especially if the
movements involved are relatively small.
It is appropriate at this point to refer briefly to other
sources of statistical information so that the position of
the labour force survey in an overall statistical
perspec-tive can be more clearly understood. The other principal
sources of labour market information are: (a) surveys of
enterprises and (b) administrative records. The former
source clearly has the potential for providing detailed
estimates of employment for individual sectors (and in
fact this is done in many countries). However, such a
source is clearly restricted to a consideration of those
with jobs and cannot provide any information on the
unemployed, or other persons outside the labour force
but who may have an attachment to it. However, such
surveys can be used to obtain information, not only in
relation to employment, but also to output, earnings and
hours worked. The simultaneous collection of consistent
data on employment and output makes it possible to
compile indicators of productivity. Indeed, the derivation
of ouptut-type information is usually the main purpose of
enterprise-based surveys. Many countries, for example,
carry out detailed quarterly or monthly inquiries of the
industrial sector which provide consistent information on
output, earnings and employment and other related
aspects.
unemployment. A prerequisite, however, is that the
administrative arrangements should specifically cater for
the extraction of the relevant statistics. While this source
involves relatively less expense than information derived
from either enterprises or households, it suffers from a
significant disadvantage in that the underlying systems
are based on social welfare or other administrative
provi-sions which may not necessarily accord with the
accepted conventions for defining employment and
unemployment. Furthermore, if these arrangements are
changed (and experience indicates that they frequently
are), a discontinuity invariably arises in the data derived
therefrom. A drawback of even greater relevance,
how-ever, in an international or Community context is the fact
that the social insurance systems in question vary greatly
from country to country, both in terms of their design and
in the manner of their implementation. This renders the
derived information virtually useless in the context of
making comparisons between countries, especially in
absolute terms. Such sources can, however, provide a
reasonable basis for monitoring short-term (i. e. monthly,
quarterly, etc.) trends, the most notable in this regard
being the various national series on the registered
unem-ployed.
To, summarize, therefore, the principal advantages
asso-ciated with labour force sample surveys relate (1) to the
opportunity which they afford to obtain comprehensive
information (at less cost than a census) across the entire
economy, which can be assessed in a global setting
embracing society as a whole; and (2) the inherent
flexibil-ity associated with such surveys, which makes it possible
to define or conceptualize not only employment and
unemployment, but also the circumstances surrounding
other groups outside or on the margins of the labour
force. The latter feature (i. e. the facility to conceptualize
or define) has assumed greater importance in recent
years because of the manner in which labour markets and
society generally have evolved, and in view of the growing
need to view labour market phenomena in an
internation-al context. It must be recognized, however, that the
sampling aspect associated with labour force surveys
places a limitation on the level of detail possible in the
presentation of results.
The history of labour force surveys
The notion of obtaining information on the workforce by
means of household-based inquiries is not in any sense
new. Questions on the concept of possessing a 'gainful
occupation' were introduced in censuses of population in
some countries during the latter half of the last century.
However, at that stage no questions were asked ¡n regard
to what is termed a person's 'economic status', i. e.
whether at work, unemployed or economically inactive.
Indeed, at that stage such a notion was hardly even
conceived of. However, the advancing trend of
industriali-zation and the inevitable restructuring of society which
attended this created a need for new approaches, and for
more sophistication in measuring labour market
phenom-ena. The situation became particularly urgent with the
advent of mass unemployment in the 1930s following the
Great Depression. Whatever uncertainties which may
have previously existed regarding the need to
conceptual-ize or measure unemployment were dispelled by the sheer
fact of millions in a state of enforced idleness. There was
now a clear need to have regular information on the level
and trend of employment and unemployment. The first
labour fource survey was introduced in the United States
in 1940 (on a monthly basis) with a new conceptual
framework designed to provide information on relevant
labour market characteristics.
The movement towards the use of labour force surveys
was somewhat slower in Europe. While the intervention of
the war years contributed to this, it was also due to the
existence of alternative sources of information which
provided at least a partial insight into aspects of the
labour force. Virtually all Western European countries
maintained comprehensive unemployment registers (for
the purpose of dispensing unemployment compensation)
which, despite their disadvantages, provided a
rudimen-tary basis for monitoring unemployment trends. However,
in time, as the need to take a more global view of the
labour market became apparent, different European
coun-tries began to initiate labour force surveys. The first
European country to carry out a labour force survey was
France, in 1950. Further such enquiries were conducted in
France throughout the subsequent decade and these
evolved into a regular consistent series in the early 1960s.
After an extended period of preparation, the Federal
Republic of Germany initiated an annual series of labour
force surveys in 1957 (the Mikrozensus). Sweden
con-ducted its first labour force survey in 1959 and after
further experimentation initiated an official quarterly
ser-ies in 1963. The present position is that virtually every
OECD country has at least an annual labour force survey;
in quite a number (the Netherlands, Italy, Spain, Portugal,
USA, Canada, the Scandinavian countries) such inquiries
are held on a quarterly or monthly basis.
Chapter II
The organization of the Community labour force survey
The technical aspects of the implementation of Commu-nity labour fource surveys are agreed between Eurostat and the national statistical institutes of the Member States. On the basis of proposals from Eurostat, the standing working party on the labour force sample survey determines the content of each inquiry, the list of ques-tions and the common coding system for individual replies, as well as the principal definitions to be applied in the analysis of the results. The national statistical institutes are responsible for selecting the sample, pre-paring questionnaires, conducting the interviews in households and forwarding the results to Eurostat in accordance with a standard coding scheme.
Eurostat devises the programme for analysing the results and is responsible for processing and disseminating the published information.
The Community labour force surveys are carried out on a legal basis. The relevant Council Regulation relating to the 1988 survey is reproduced in Appendix A. The regula-tions relating to surveys for other years are of a similar nature, except to the extent that the specified survey content may vary somewhat.
Reference period
Most of the labour market characteristics derived from the Community labour force surveys refer to the situation in a particular week. While the survey is synchronized to the extent that this reference week falls in the spring in all countries, the national statistical institutes determine the exact weeks on the basis of the particular situation in each country. This aspect has in fact assumed greater significance with the introduction of the revised series of annual surveys in 1983 which involve a much greater emphasis on 'current' (as distinct from 'usual') labour market circumstances. The reference weeks used in the different Member States are published in the Eurostat annual report containing the survey results.
Coverage
The survey is intended to cover the whole of the resident population, i. e. all persons whose usual place of resi-dence is in the territory of the Member States of the Community. For technical reasons, however, it is not possible in all countries to include the population living in collective households, i. e. persons living in institutions of various kinds such as boarding schools, hospitals,
work-ers' hostels, etc. Consequently, in order to have the results for all countries on a consistent basis, the results are compiled on the basis of the population resident in private households only.
In more precise terms this covers all persons living in the households surveyed during the reference week, includ-ing persons temporarily absent from the household for short periods arising from business trips, illness, holi-days, etc. It does not include, however, persons who, although having links with the household under survey, usually live elsewhere, either in another private household or in an institution.
Sampling aspects
The sampling methods used in the labour force surveys are determined by the national statistical institutes on the basis of national socio-economic factors and the technical and administrative arrangements within each country. In this regard the relevant Council regulations determine only the limits of the required sample sizes. These limits are usually specified as follows:
(a) between 60 000 and 100 000 households for the Feder-al Republic of Germany, France, ItFeder-aly, Spain and the United Kingdom;
(b) between 30 000 and 50 000 households for Belgium, Greece, the Netherlands, Portugal and Ireland; (c) between 15 000 and 30 000 households for Denmark; (d) approximately 10 000 households for Luxembourg. The following table sets out the approximate number of households included in the sample in each country in 1987.
Member State Belgium Denmark FR of Germany Greece
Spain France Ireland
Italy
Luxembourg The Netherlands Portugal
United Kingdom
Thus the total sample across the Community comprised
some 600 000 private households.
Within each Member State, the figures obtained from the
sample are expanded to national levels, usually on the
basis of expansion factors derived from the most recent
census of population, suitably adjusted to take account
of recent changes in population levels which may have
occurred since that census.
Full details of the sample procedure used in each
Mem-ber State, and of the expansion and grossing methods,
are given in the 1988 Eurostat publication
Labour force
sample survey - Methods and definitions.
Reliability of the results
As is the case with any sample survey, the labour force
survey estimates are subject to sampling and other
errors. While the complex design features which
charac-terize the survey in different countries virtually preclude
the possibility of obtaining precise measurements of
sampling variability, experience with previous surveys
has shown that at national level the survey information
provides sufficiently accurate estimates for the principal
aggregates into which the labour force is divided.
Detailed classifications, however, and results at regional
level in particular, may be affected by considerable
sam-pling errors, even for relatively large segments of the
overall population.
In addition to sampling errors, the results of any survey
(even if this is a complete enumeration) are affected by
non-sampling errors, i. e. a whole variety of influences
such as non-response, errors by interviewers when
com-pleting survey documents, miscoding, etc.
Beginning with the 1986 survey, national statistical
insti-tutes have been requested to supply Eurostat with
esti-mates of sampling errors for some basic survey results.
Comparability of the survey results from country to
country
Perfect comparability among Community countries is
difficult to achieve, even by means of a single direct
survey such as the labour force survey. Nevertheless, the
degree of comparability of the Community survey results
is considerably greater than that of any other existing set
of statistics on employment or unemployment available
from Member States. This is principally due to:
(a) the recording of the same set of characteristics in
each country;
(b) the greatest possible correspondence between the
Community list of questions and the national
ques-tionnaires;
(c) the use of the same definitions in conceptualizing and
compiling different labour market aggregates;
(d) the use of a common classification (e. g. NACE) for
economic activity;
(e) the synchronization of the survey in the spring;
(f) the data being centrally processed by Eurostat.
It should be noted, however, that the Community labour
force survey, although subject to common agreed
statisti-cal requirements, is in fact a joint effort between Member
States to coordinate their national employment surveys,
which must also serve their own national needs. As a
result, there are some differences in the survey from
country to country, although these are minimized as far
as possible by close cooperation between the national
statistical institutes and Eurostat.
Comparability of the results of successive surveys
For the series of surveys initiated in 1983, comparability
between the results of successive inquiries should in
general be better than in the past, mainly due to the
greater stability of content and design.
However, there are some aspects which militate against
enhanced comparability in this regard:
(a) The population figures used for the population
expan-sion procedures are revised at intervals on the basis
of new population censuses;
(b) The reference period may not remain precisely the
same for a given country from year to year;
(c) In order to improve the quality of the results, some
countries may have changed the content or order of
their questions; such changes are especially
impor-tant between the 1983 and 1984 surveys;
(d) Countries may modify their sample designs;
(e) The manner in which certain questions are answered
may be influenced by political or social circumstances
at the time of the interview.
In so far as they are known, Eurostat indicates when
publishing the results the main factors affecting the
comparability of the survey data for successive inquiries.
Due to the fundamental changes in concepts introduced
in the 1983 survey, comparisons between the results from
that inquiry and those of earlier years are virtually
impos-sible for most characteristics. The report of the 1983
survey contains a quantitative appraisal of the effects of
these changes on the results.
Chapter III
Labour market characteristics on which information is sought
The range of items of a socio-economic nature on which
information is sought in the Community labour force
survey is quite extensive, particularly for those persons
associated with the labour force. A full list of the
charac-teristics involved is given in Appendix B. More detailed
information is given in Appendix C which sets out the full
list of options for each of these items and describes the
coding system used.
Not all of the survey questions of course apply to
everyone and in order to fully understand their
signifi-cance it is necessary to describe them in terms of the
specific population groupings to which they relate.
1. For persons of all ages, basic demographic
character-istics (e. g. age, sex, marital status, etc.) are sought.
2. For all persons 14 years of age or over a crucial
distinction centres on the respondent's 'work status'
in the reference week, i. e. whether the respondent
actually did gainful work, or was temporarily absent
from such work or was simply not in a job and not
working, for various reasons. This question is of
fun-damental importance as it used to make the basic
distinction as to whether the person was or was not in
employment in the survey reference week. Some other
questions are also addressed to all persons aged 14
years or over, for example their work situation at a
point one year prior to the survey date, and whether
education and/or training was received during a
four-week period before the survey.
3. For those who, on the basis of the replies given, are
deemed to be in employment, the survey involves a
range of questions designed to provide information
about the nature of this work — sector of economic
activity, occupation engaged in, hours worked,
wheth-er part-time or full-time, whethwheth-er pwheth-ermanent or
tempo-rary, if more than one job was held and whether the
respondent is seeking work (either as additional or
alternative employment).
4. For those without employment, apart from some
ques-tions on recent work history (duration since last job,
characteristics of that job, etc.) a distinction of
partic-ular importance relates to the question designed to
determine whether the respondent is seeking work or
not, since this is one of the factors used in deciding
whether the respondent should be defined as
unem-ployed or otherwise (see Chapter IV).
5. For those without a job but seeking work there are
questions on the type of work sought, the duration of
search, availability for work and the main means used
in looking for work.
6. For those without a job but not seeking work, basic
information on their status is sought — i. e. whether
they are retired, in full-time education, permanently ill
or incapacitated, etc.
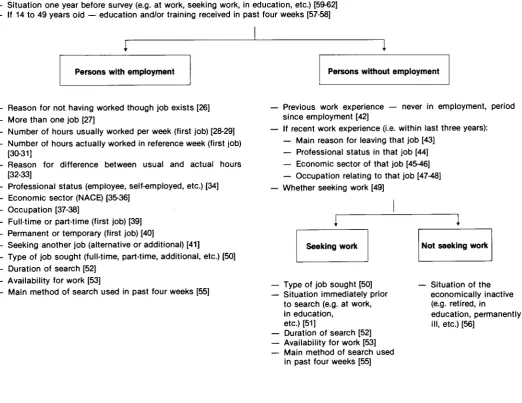
Figure 1
Information available for the main population groups in the
1987 Community labour force survey
Everybody
Demographic characteristics (age, sex, marital status, nationality, type of household, etc.) [15-24] Area of residence one year before survey [63-66]
Everybody 14 years or over
Work status in reference week (actually worked, temporarily absent from work, on lay-off, military service, other) [25] Registration at official employment exchange [54]
Situation one year before survey (e.g. at work, seeking work, in education, etc.) [59-62] If 14 to 49 years old — education and/or training received in past four weeks [57-58]
Persons with employment Persons without employment
Reason for not having worked though job exists [26] More than one job [27]
Number of hours usually worked per week (first job) [28-29] Number of hours actually worked in reference week (first job)
[30-31]
Reason for difference between usual and actual hours [32-33]
Professional status (employee, self-employed, etc.) [34] Economic sector (NACE) [35-36]
Occupation [37-38]
Full-time or part-time (first job) [39] Permanent or temporary (first job) [40]
Seeking another job (alternative or additional) [41]
Type of job sought (full-time, part-time, additional, etc.) [50] Duration of search [52]
Availability for work [53]
Main method of search used in past four weeks [55]
Previous work experience — never in employment, period since employment [42]
If recent work experience (i.e. within last three years): — Main reason for leaving that job [43]
— Professional status in that job [44] — Economic sector of that job [45-46] — Occupation relating to that job [47-48] Whether seeking work [49]
Seeking work Not seeking work
Type of job sought [50] Situation immediately prior to search (e.g. at work, in education,
etc.) [51]
Duration of search [52] Availability for work [53] Main method of search used in past four weeks [55]
Situation of the economically inactive (e.g. retired, in
education, permanently ill, etc.) [56]
Note: The numbers in square brackets relate to the column numbers used tor each characteristic as set out in Appendices Β and C.
Chapter IV
Labour force concepts and definitions
Thus far the description of the labour force survey charac-teristics has tended to be expressed explicitly in terms of the actual survey questions. This is useful up to a point, but ultimately the presentation of data must involve the adoption of further conventions and concepts if the fig-ures are to lend themselves to meaningful interpretation, particularly in the context of facilitating socio-economic analysis. This involves reorganizing the data so as to identify and describe the attributes of groups of indivi-duals who share common pre-specified characteristics (such as the unemployed, so defined). This chapter is therefore concerned with the question of the working definitions used in the Community labour force survey.
It has already in fact been necessary to introduce some concepts in broad terms without referring to the actual problems of definition. One might ask, for example, what does 'being in employment' precisely mean, given that the degree of gainful activity engaged in during a specif-ied period can extend from quite minimal effort to the significant input required for a full-time job?
However, the purpose of the labour force survey extends beyond the provision of distinctions relating solely to employment. The principal statistical objective of the survey is to subdivide the population of working age (i. e those aged 14 years and over) into three mutually exclu-sive groups:
(a) persons in employment; (b) unemployed persons; and
(c) other persons (i. e. those deemed to be economically inactive);
and to provide descriptive and explanatory data on each of these categories.
In fact the concept of being 'in employment' or 'at work' in the Community labour force survey is rather all-embracing and purports to cover 'any work of at least one hour's duration carried out for pay or profit during the reference week'. The definition of unemployment is rather complex and involves the simultaneous application of a number of different criteria (the absence of a job, evi-dence of job search and availability for work). Such an approach in a survey context requires the application of a 'filter process', whereby the replies from a respondent are observed in sequence, the objective being to 'filter down' the initial group targeted until a (smaller) final group is achieved, all the members of which satisfy the agreed requirements for the state or condition in question.
The precise definitions used in the Community labour force survey for the three groups in question are as follows:
1. Persons in employment are those aged 14 years or over who during the reference week:
(a) carried out any work to the extent of one hour or more for pay or profit. This would include paid work in the context of an employee/employer rela-tionship or self-employment. It also includes unpaid family work, which is defined as unpaid work contributing directly to the operation of a farm, business or professional practice owned or operated by a related member of the household; or
(b) were not working but who had jobs or businesses from which they were temporarily absent because of illness, holidays, unsuitable weather, labour disputes, etc. Persons on lay-off and those with a new job to start in the future are however not regarded as employed.
2. Unemployed persons are those who had no employ-ment during the reference week and who:
(a) were actively looking for paid work in the context of an employer/employee relationship (active search in this regard requires that specific steps to find a job were taken during a four-week period ending with the reference week), and were availa-ble for work in the sense that they were free to take up a job during a period within two weeks of the survey interview; or
(b) were seeking to set up their own business or professional practice; or
(c) were waiting to be called back to a job from which they had been laid off; or
(d) had a new job to start after the reference week. 3. Economically inactive persons are those persons
aged 14 years or over who are neither classified as employed nor unemployed.
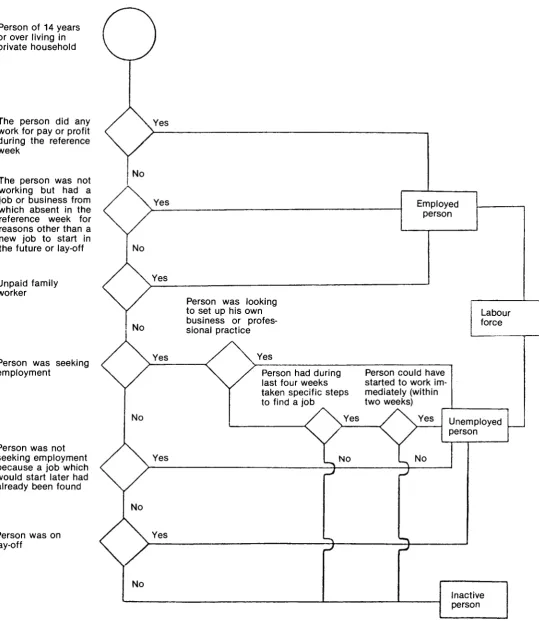
Figure 2
Schematic illustration of persons defined as in employment,
unemployed or economically inactive
Person of 14 years or over living in private household
The person did any work for pay or profit during the reference week
The person was not working but had a job or business from which absent in the reference week for reasons other than a new job to start in the future or lay-off
Unpaid family worker
Yes
Yes Employed
person
No
Yes
No
Person was seeking employment
Yes
Person was looking to set up his own business or profes-sional practice
Yes
Person was not seeking employment because a job which would start later had already been found
Person was on lay-off
No
Person had during last four weeks taken specific steps to find a job
Person could have started to work im-mediately (within two weeks) Yes
Yes
3-
NONo
Yes
Yes Unemployed person
3-No
Inactive person
public or private employment office, contacts with pros-pective employers, informal methods of search through friends and relatives, answering or placing advertise-ments, etc.
The above concepts are consistent with the definitions embodied in the 1982 Recommendations of the Interna-tional Labour Organization contained in the resolution of the 13th International Conference of Labour Statisticians (see References).
Unemployed persons can be further classified in terms of the circumstances of unemployment into three major groups:
1. persons previously in employment who immediately began to look for work subsequent to the termination of the job in question;
2. re-entrants to the labour force, i. e. persons who pre-viously worked, but who were inactive for a period or were on obligatory military service before beginning to look for work;
3. first job-seekers, i. e. persons who never previously worked in a regular job.
The labour force comprises persons in employment and unemployed persons.
Figure 2 provides a diagramatic representation of the composition of each of the abovementioned groups illus-trating particularly the filter process by which the unem-ployed group is defined.
There are other concepts which are used in the presenta-tion of labour force data and in the analysis of labour market information generally. These are:
(a) the labour force activity rate, which is the ratio of the labour force to the total population aged 14 years and over. Such rates can, of course, also apply to indivi-dual age categories. Basically this statistic purports to represent the propensity of the population (or a segment of it) to engage in gainful work;
(b) The employment/population ratio is the ratio of per-sons in employment to the population of working age (i. e. that aged 14 years or over);
Chapter V
The Community labour force survey - Presentation of results
This chapter is concerned primarily with describing the information made available from the Community labour force survey in official Eurostat publications. The greater part of the data in question is made available in the annual Eurostat Community labour force survey report which contains a comprehensive corpus of statistical data which is of primary interest and utility in the context of labour market analysis, particularly when a Communi ty-wide dimension is involved. Labour force survey data are also made available through other sources, for exam ple in more general Eurostat publications such as those relating to social indicators and in the Eurostat regional statistics databank. The content of the latter source (in so far as it relates to the labour force survey information) is described later in this chapter, as it contains information of a regional nature not available elsewhere. It should also be noted that apart from the pre-specified tables contained in official Community reports, a great deal of additional statistical information on individual topics is potentially derivable from the computerized labour force survey files, subject to the availability of programming and computer resources. The question of the availability and accessibility of such additional ad hoc tabulations is considered later in this chapter.
The annual Community labour force survey publication
This is the principal publication setting out the results of the labour force survey; it contains basic population and labour market information for all the countries of the Community as well as containing, where appropriate, aggregate Community-wide figures.
All the tables (which are presented according to a stan dard format from survey to survey) are structured so as to show the data for individual countries (and for the Com munity as a whole) in vertical columns of figures. Many of the basic classifications are in two parts, the first of which contains estimates in absolute terms (to the near est 1 000 units), the second containing percentages, so as to allow relative comparisons between the different Mem ber States (which of course vary greatly in size).
The report is subdivided into four basic sections covering: population and labour force activity levels;
employment; working time;
[image:19.595.40.569.498.749.2]unemployment and search for work.
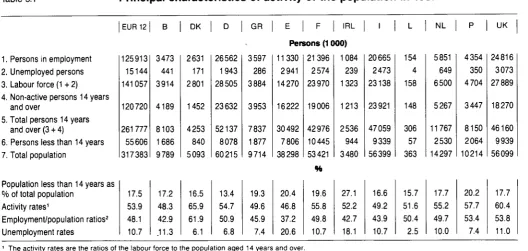
Table 5.1
Principal characteristics of activity of the population in 1987
1. Persons in employment 2. Unemployed persons 3. Labour force (1 + 2) 4. Non-active persons 14 years
and over
5. Total persons 14 years and over (3 + 4)
6. Persons less than 14 years 7. Total population
Population less than 14 years as % of total population
Activity rates1
Employment/population ratios2 Unemployment rates EUR 12 125913 15144 141057 120720 261 777 55606 317383 17.5 53.9 48.1 10.7 B 3473 441 3914 4189 8103 1686 9789 17.2 48.3 42.9 .11.3 DK 2631 171 2801 1452 4253 840 5093 16.5 65.9 61.9 6.1 D 26562 1943 28505 23632 52137 8078 60215 13.4 54.7 50.9 6.8 GR 3597 286 3884 3953 7837 1877 9714 19.3 49.6 45.9 7.4
E F IRL
Persons (1000) 11330 2941 14270 16222 30492 7806 38298 20.4 46.8 37.2 20.6 21396 2574 23970 19006 42976 10445 53421 % 19.6 55.8 49.8 10.7 1084 239 1323 1213 2536 944 3480 27.1 52.2 42.7 18.1 I 20665 2473 23138 23921 47059 9339 56399 16.6 49.2 43.9 10.7 L 154 4 158 148 306 57 363 15.7 51.6 50.4 2.5 NL 5851 649 6500 5267 11767 2530 14297 17.7 55.2 49.7 10.0 Ρ 4354 350 4704 3447 8150 2064 10214 20.2 57.7 53.4 7.4 UK 24816 3073 27889 18270 46160 9939 56099 17.7 60.4 53.8 11.0
1 The activity rates are the ratios of the labour force to the population aged 2 The employment/population ratio represents total employment divided by
14 years and over.
Population and labour force activity levels
This section contains in the first instance classifications of the total population for each Member State according to five-year age groups. A further form of presentation subdivides the population of working age (i. e. those aged 14 years or over) of each country according to 'work status', i. e. distinguishing those at work, those unem-ployed, and those outside the labour force (i. e. the economically inactive).
At this stage it is perhaps appropriate to extend our illustration with the presentation of actual data in order to provide the reader with a better perspective of the infor-mation available. This is done in Table 5.1 which shows broad status classifications of entire populations from the 1987 labour force survey for the 12 Member States, and for the Community as a whole.
It will be noted that in that year the total population resident in private households in the aggregate Commun-ity of 12 Member States (EUR 12) was 317.4 million, of which 261.8 million were aged 14 years or over (i.e. of working age). A total of 141.1 million from the latter total were classified as being in the labour force, of which in turn 125.9 million were recorded as being in employment while 15.1 million were classified as unemployed.
The derived calculations given at the end of the table show that at Community level the aggregate labour force activity rate was 53.9% but this varied from as low as 47% in the case of Spain to as high as 66% for Denmark. It will be noted that many of the activity rates for the other countries were in the 50 to 55% range, while those for Portugal and the United Kingdom lay in the 55 to 60% range. The employment/population ratio for the Commu-nity as a whole was 48% and this varied from as low as 37% in the case of Spain to nearly 62% for Denmark.
The aggregate Community unemployment rate in 1987 was nearly 10.7% and this varied from 2.5% for Luxem-bourg, approximately 6 to 7% for Denmark, Germany, Greece and Portugal to as high as 2 1 % for Spain. The rates for France, Italy, the Netherlands, Belgium and the United Kingdom were all reasonably close to the overall Community average rate.
The foregoing provides but an indication of the kind of information contained in this section of the Community labour force survey annual report. The actual tables presented in the report, all of which involve a basic subdivision by sex, include further classifications of the various work status categories according to age, marital status and nationality.
The full list of tables is as follows:
Tables relating to population and activity
01 Principal characteristics of activity of the population 02 Principal characteristics of activity of young persons
aged 14 to 24 years
03 Activity rates by age groups (%)
04 Activity rates by marital status and broad age groups (%)
05 Activity rates by nationality and broad age groups (%)
06 Employment/population ratios by age groups (%)
07 Employment/population ratios by marital status and broad age groups (%)
08 Unemployment rates by age groups (%)
09 Unemployment rates by marital status and broad age groups (%)
10 Total population by age groups (1 000) 11 Total population by age groups (%)
12 Foreign population by broad age groups (1 000) 13 Foreign population by broad age groups (%) 14 Labour force by age groups (1 000)
15 Labour force by age groups (%)
16 Labour force by nationality and broad age groups (1 000)
17 Labour force by nationality and broad age groups (%)
18 Persons in employment by age groups (1 000) 19 Persons in employment by age groups (%) 20 Unemployed persons by age groups (1 000) 21 Unemployed persons by age groups (%) 22 Inactive persons by age groups (1 000) 23 Inactive persons by age groups (%)
24 Young persons aged 14 to 24 years in education by main population categories and age groups (1 000) The age classifications used involve for the most part a broad categorization of the population of working age distinguishing those aged 14 to 24 years, 24 to 29 years, 50 to 64 years and 65 years and over. The nationality subdivision used in Tables 5, 16 and 17 is rather broad, distinguishing for each country aggregate figures for the number of nationals for all EC Member States combined, and non-EC countries.
Employment
This section contains details of classifications of those at work or in employment as defined in the preceding chapter. The basic categorizations involved in this sec-tion relate to professional status, economic activity and the distinction between full-time and part-time work. The classifications according to professional status dis-tinguish whether persons at work are employers or self-employed, paid employees or family workers. The last category is meant to relate to persons who assist another member of the family to run an agricultural holding or another business, provided they are not considered as employees.
The subdivisions presented in terms of economic activity are given at two levels. The first level of disaggregation involves just three sectors - agriculture, industry and services; the second more detailed categorization extends to 11 sectors at the NACE II level as defined in Appendix D.
The distinction between full-time and part-time work is generally made on the basis of the subjective replies given by the survey respondents. In a number of coun-tries, however, the categorization is somewhat more spe-cific, being based wholly or partly on hours worked. In Greece, for example, a person is considered to work part-time if he or she works less hours than those provided for in collective agreements applicable to the type of work in which the person is engaged.
In Italy, a person works parttime if, in agreement with the employer, he or she works less hours than those normally worked in the particular type of employment.
In the Netherlands, selfemployed or family workers are defined as working parttime if they usually work less than 35 hours per week. Employees are regarded as parttime if either their contractual hours are less than 31 hours per week, or if they are between 31 and 34 hours per week but are considered as less than those normally worked for the type of job.
Tables 5.2 and 5.3 provide an illustration of the kind of basic information on employment made available in this
[image:21.595.38.558.208.398.2]section of the report. The first table which relates to professional status shows that of the 125.9 million per sons who were recorded as in employment throughout the Community in 1987 almost 20 million (15.9%) were employers or self employed, 101.5 million (81%) were paid employees while about 4.3 million (some 3.4%) were family workers. The relative distributions vis'-a-vis these three categories vary considerably between countries, with the proportions of employers and selfemployed being particularly high in Greece (35.4%) and also in Spain, Italy, Ireland and Portugal, where the correspond ing proportions were each in excess of 20%. These relatively high percentages derive partly from the size of the agricultural sectors in these countries.
Table 5.2
Persons in employment in 1987 by professional status
Employers and selfemployed
Employees
Family workers
Not stated
Total
Employers and selfemployed
Employees
Family workers Total
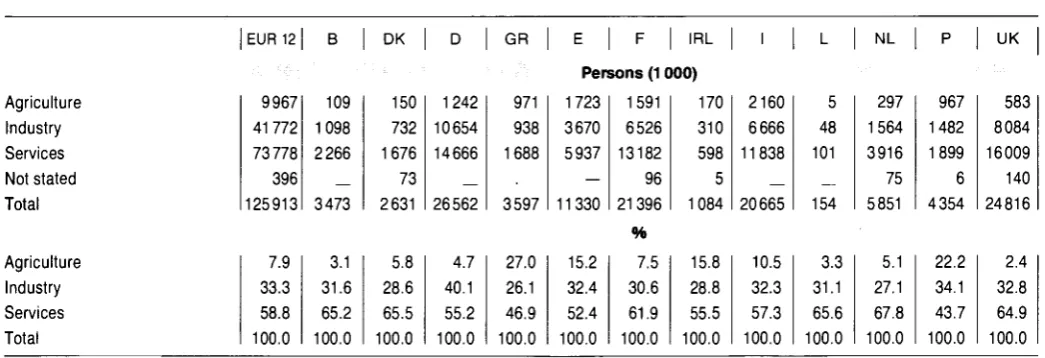
Table 5.3
Agriculture Industry Services Not stated Total Agriculture Industry Services Total
EUR 12
19999 101453 4338 123 125913 15.9 80.7 3.4 100.0
Perso
EUR 12
9967 41772 73778 396 125913 7.9 33.3 58.8 100.0 Β 532 2835 107
_
3473 15.3 81.6 3.1 100.0ns in ι
Β 109 1098 2266
_
3473 3.1 31.6 65.2 100.0 DK 241 2329 60_
2631 9.2 88.5 2.3 100.0ímpio
DK 150 732 1676 73 2631 5.8 28.6 65.5 100.0 D 2421 23466 675_
26562 9.1 88.3 2.5 100.0ymenl
D 1242 10654 14666_
26562 4.7 40.1 55.2 100.0 GR 1274 1794 529_
3597 35.4 49.9 14.7 100.0E F IRL
Persons (1000)
2650 7877 760 42 11330 2709 17904 782
_
21396 236 816 32_
1084 «M> 23.5 69.8 6.7 100.0 12.7 83.7 3.7 100.0 21.8 75.3 2.9 100.0 I 5044 14573 1048_
20665 24.4 70.5 5.1 100.0t in 1987 by sector of activity
GR 971 938 1688 3597 27.0 26.1 46.9 100.0
E F IRL
Persons (1 000)
1723 3670 5937
—
11330 1591 6526 13182 96 21396 170 310 598 5 1084%
15.2 32.4 52.4 100.0 7.5 30.6 61.9 100.0 15.8 28.8 55.5 100.0 I 2160 6666 11838_
20665 10.5 32.3 57.3 100.0 L 14 137 3 154 9.2 88.8 2.0 100.0 L 5 48 101_
154 3.3 31.1 65.6 100.0 NL 593 5123 136_
5851 10.1 87.5 2.3 100.0 NL 297 1564 3916 75 5851 5.1 27.1 67.8 100.0 Ρ 1185 2962 206_
4354 27.2 68.0 4.7 100.0 Ρ 967 1482 1899 6 4354 22.2 34.1 43.7 100.0 UK 3098 21639_
80 24816 12.5 87.5_
100.0 UK 583 8084 16009 140 24816 2.4 32.8 64.9 100.0The classifications by economic activity given in Table 5.3 show that of the Community total of 125.9 million employed persons, just under 10 million were engaged in agriculture, nearly 42 million in industry (which includes building and construction) and almost 74 million in the broad services area. When this distribution is expressed in relative terms the percentages corresponding to these sectors were 7.9, 33.3 and 58.8 respectively. However, it will be noted that again these varied greatly between countries. The percentage at work in agriculture was as high as 27% in Greece, over 22% in Portugal and 15 to
[image:21.595.37.560.445.624.2]The tables included in the Community labour force survey
report under the abovementioned headings involve a
range of cross-classifications according to the
character-istics just described. These tables are as follows:
Tables relating to employment
25 Persons in employment by professional status (1 000)
26 Persons in employment by sector of activity (1 000)
27 Persons in employment by professional status (%)
28 Persons in employment by sector of activity (%)
29 Persons in employment by professional status and
sector of activity (1 000)
30 Persons in employment by professional status and
sector of activity (%)
31 Persons in employment by sector of activity and
professional status (1 000)
32 Persons in employment by sector of activity and
professional status (%)
33 Persons in employment by professional status with a
full-time/part-time breakdown (1 000)
34 Persons in employment by professional status with a
full-time/part-time breakdown (%)
35 Persons in employment by sector of activity with a
full-time/part-time breakdown (1 000)
36 Persons in employment by sector of activity with a
full-time/part-time breakdown (%)
37 Employees by sector of activity with a
full-time/part-time breakdown (1 000)
38 Employees by sector of activity with a
full-time/part-time breakdown (%)
39 Non-employees by sector of activity with a
full-time/part-time breakdown (1 000)
40 Non-employees by sector of activity with a
full-time/part-time breakdown (%)
41 Persons working full-time/part-time by broad age
groups (1 000)
42 Persons working full-time/part-time by broad age
groups (%)
43 Persons in employment by economic activity (1 000)
44 Persons in employment by economic activity (%)
45 Employees by economic activity (1 000)
46 Employees by economic activity (%)
Working time
The section of the Community labour force survey report
dealing with this aspect contains tabulations setting out
information on working time expressed in terms of weekly
hours. Two basic concepts are used to define working
time:
(a) usual hours worked; and
(b) actual hours worked.
The first category corresponds to the number of hours
which survey respondents indicated that they normally
worked in a week. In the context of calculating 'average
hours usually worked', respondents who were unable to
provide information for usual hours, e. g. because the
hours worked varied considerably from week to week, are
not taken into account.
'Hours actually worked' corresponds to the actual
num-ber of hours which a survey respondent worked during the
reference week of the survey. These hours may differ from
the usual hours for reasons such as overtime, illness,
holidays, flexible working hours, etc. For purposes of
calculating 'average hours actually worked' respondents
having worked less than one hour, or not at all during the
reference week, or those who did not reply to this
ques-tion, are not taken into account in the calculation.
If the respondent held more than one job, the hours
worked for the first job only are considered in the context
of these analyses.
There are two basic methods of exposition in relation to
these data — the figures are either expressed in terms of
average hours per week or in the form of distributions
showing the proportions of respondents recorded to
dif-ferent duration categories. With regard to the latter, the
duration classes actually used for persons in full-time
employment are:
Between 1 and 35 hours;
36 to 39 hours;
40 hours;
41 to 45 hours;
46 hours or more.
The single category '40 hours' is distinguished because it
occurs frequently, it still being the standard weekly
work-ing duration in many (but not all) Community countries.
The figures in the various tables presented under this
heading are usually shown for all persons at work and for
paid employees separately. It is considered that the data
for paid employees are perhaps more meaningful since
the concept of working hours in the case of many
self-employed persons and family workers may be difficult to
determine because of the uncertain distinction which
often exists in relation to gainful work and other
activi-ties.
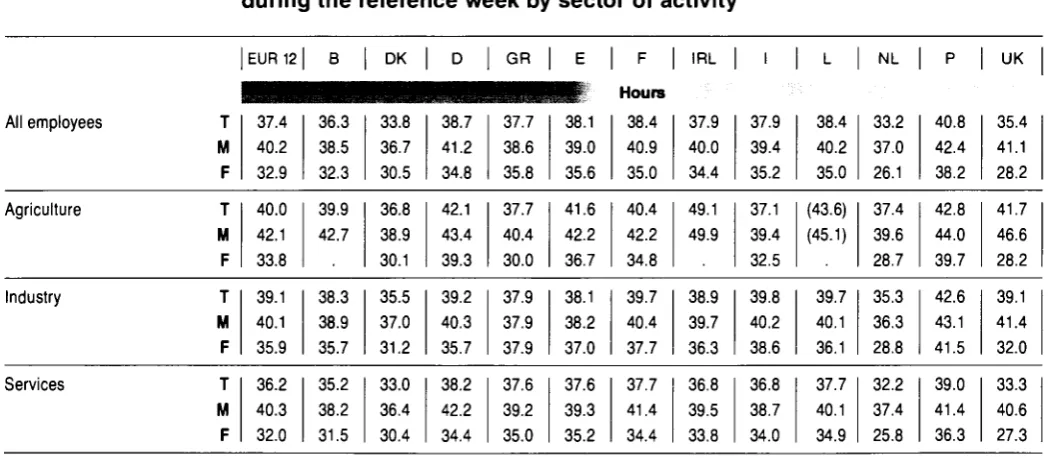
Tables 5.4 to 5.7 contain basic figures on hours worked
for 1987 by paid employees. The first table, which
con-tains data for usual average weekly working time by
broad sector, shows that the average usual hours worked
by employees in the year in question was 37.8 hours, the
averages for males and females being 40.7 hours and 33.4
hours respectively. Viewing the position across countries
it will be noted that the highest averages are for Portugal
and Spain (in excess of 40 hours), while the lowest are for
the Netherlands and Denmark (less than 35 hours).
Table 5.5 contains information similar to that given in
Table 5.4 except that the figures are now presented on
the basis of actual hours worked. Broadly speaking the
pattern of the results is similar to that described above.
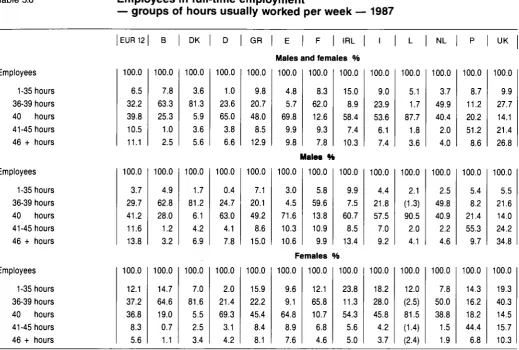
Tables 5.6 and 5.7 contain information on working time
for full-time employees in the form of distributions
according to duration categories. The first of these
tables, which contains data in this form on usual working
time, shows that just over 6% of full-time paid employees
usually worked less than 35 hours per week, nearly one
third worked between 36 and 39 hours, almost 40%
worked exactly 40 hours, while more than 20% worked 41
hours or more. The figures indicate a greater
preponder-ance of shorter working durations among women; more
than 49% of women usually worked less than 40 hours
per week, compared with a corresponding proportion of
33% for men.
Table 5.4
Average hours usually worked per week by employees
for 1987 by sector of activity
All employees
EUR 12 DK GR F
Hours
IRL NL
M UK 37.8 40.7 33.4 36.1 38.2 32.3 34.7 37.5 31.6 38.3 40.6 34.6 39.6 40.6 37.5 40.1 41.1 37.5 37.7 40.0 34.9 39.0 41.0 35.9 38.1 39.5 35.6 38.5 40.3 35.3 32.8 36.5 26.2 41.5 43.1 38.9 37.3 43.5 29.8
Agriculture 41.5
43.5 35.8 38.2 41.1 36.5 38.2 31.0 41.9 43.3 39.1 43.2 44.8 38.9 44.5 44.9 40.3 40.4 42.2 35.2 48.3 49.0 38.6 40.5 35.0 (44.2) (45.4) 36.4 38.4 28.7 47.4 48.6 44.3 43.2 48.0 30.3
Industry 39.8
40.8 36.7 38.2 38.8 35.9 37.1 38.4 33.4 38.9 39.9 35.7 40.5 40.6 40.1 40.2 40.4 39.0 39.4 40.0 37.7 40.4 41.2 38.1 40.1 40.4 39.0 39.8 40.3 36.3 35.9 36.9 29.5 43.3 43.8 42.2 41.7 44.1 34.5
Services 36.4
40.4 32.4 34.8 37.6 31.5 33.6 36.9 31.2 37.7 41.4 34.2 38.9 40.4 36.5 39.5 41.1 37.0 36.8 40.0 34.2 37.9 40.4 35.2 36.8 38.6 34.3 37.8 40.2 35.1 31.4 36.1 25.7 39.3 41.6 36.8 35.0 42.9 28.7
Table 5.5
Average hours actually worked by employees in 1987
during the reference week by sector of activity
[image:23.595.33.558.380.609.2]Table 5.6
Employees in full-time employment
— groups of hours usually worked per week — 1987
Employees
1-35 hours 36-39 hours 40 hours 41-45 hours 46 + hours
Employees
1-35 hours 36-39 hours 40 hours 41-45 hours 46 + hours
Employees
1-35 hours 36-39 hours 40 hours 41-45 hours 46 + hours
EUR 12 100.0 6.5 32.2 39.8 10.5 11.1 100.0 3.7 29.7 41.2 11.6 13.8 100.0 12.1 37.2 36.8 8.3 5.6 Β 100.0 7.8 63.3 25.3 1.0 2.5 100.0 4.9 62.8 28.0 1.2 3.2 100.0 14.7 64.6 19.0 0.7 1.1 DK 100.0 3.6 81.3 5.9 3.6 5.6 100.0 1.7 81.2 6.1 4.2 6.9 100.0 7.0 81.6 5.5 2.5 3.4 D 100.0 1.0 23.6 65.0 3.8 6.6 100.0 0.4 24.7 63.0 4.1 7.8 100.0 2.0 21.4 69.3 3.1 4.2 GR 100.0 9.8 20.7 48.0 8.5 12.9 100.0 7.1 20.1 49.2 8.6 15.0 100.0 15.9 22.2 45.4 8.4 8.1
E I F I IRL Males and females %
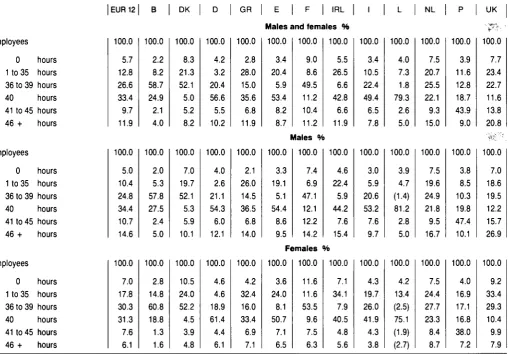
Table 5.7
Employees in full-time employment
— groups of hours actually worked during the reference week — 1987
Employees
0 hours 1 to 35 hours 36 to 39 hours 40 hours 41 to 45 hours 46 + hours
Employees
0 hours 1 to 35 hours 36 to 39 hours 40 hours 41 to 45 hours 46 + hours
Employees
0 hours 1 to 35 hours 36 to 39 hours 40 hours 41 to 45 hours 46 + hours
EUR 12 100.0 5.7 12.8 26.6 33.4 9.7 11.9 100.0 5.0 10.4 24.8 34.4 10.7 14.6 100.0 7.0 17.8 30.3 31.3 7.6 6.1 Β 100.0 2.2 8.2 58.7 24.9 2.1 4.0 100.0 2.0 5.3 57.8 27.5 2.4 5.0 100.0 2.8 14.8 60.8 18.8 1.3 1.6 DK 100.0 8.3 21.3 52.1 5.0 5.2 8.2 100.0 7.0 19.7 52.1 5.3 5.9 10.1 100.0 10.5 24.0 52.2 4.5 3.9 4.8 D 100.0 4.2 3.2 20.4 56.6 5.5 10.2 100.0 4.0 2.6 21.1 54.3 6.0 12.1 100.0 4.6 4.6 18.9 61.4 4.4 6.1 GR 100.0 2.8 28.0 15.0 35.6 6.8 11.9 100.0 2.1 26.0 14.5 36.5 6.8 14.0 100.0 4.2 32.4 16.0 33.4 6.9 7.1
E F IRL
Males and females % 100.0 3.4 20.4 5.9 53.4 8.2 8.7 100.0 9.0 8.6 49.5 11.2 10.4 11.2 100.0 5.5 26.5 6.6 42.8 6.6 11.9 Males % 100.0 3.3 19.1 5.1 54.4 8.6 9.5 100.0 7.4 6.9 47.1 12.1 12.2 14.2 100.0 4.6 22.4 5.9 44.2 7.6 15.4 Females % 100.0 3.6 24.0 8.1 50.7 7.1 6.5 100.0 11.6 11.6 53.5 9.6 7.5 6.3 100.0 7.1 34.1 7.9 40.5 4.8 5.6 I 100.0 3.4 10.5 22.4 49.4 6.5 7.8 100.0 3.0 5.9 20.6 53.2 7.6 9.7 100.0 4.3 19.7 26.0 41.9 4.3 3.8 L 100.0 4.0 7.3 1.8 79.3 2.6 5.0 100.0 3.9 4.7 (1.4) 81.2 2.8 5.0 100.0 4.2 13.4 (2.5) 75.1 (1.9) (2.7) NL 100.0 7.5 20.7 25.5 22.1 9.3 15.0 100.0 7.5 19.6 24.9 21.8 9.5 16.7 100.0 7.5 24.4 27.7 23.3 8.4 8.7 Ρ 100.0 3.9 11.6 12.8 18.7 43.9 9.0 100.0 3.8 8.5 10.3 19.8 47.4 10.1 100.0 4.0 16.9 17.1 16.8 38.0 7.2 UK 100.0 7.7 23.4 22.7 11.6 13.8 20.8 100.0 7.0 18.6 19.5 12.2 15.7 26.9 100.0 9.2 33.4 29.3 10.4 9.9 7.9
There is considerable variation across countries in rela tion to the distribution by working time. In Denmark, for example, it will be noted that only 6% of paid employees were indicated to have worked exactly 40 hours per week because the standard working week is lower in that country (81% of paid employees in Denmark worked between 36 and 39 hours). In the United Kingdom only some 14% of paid employees usually worked 40 hours per week, but this is because in that country there is a more widely spread pattern of working times, embracing both short and long durations. It will be noted, for exam ple, that in the United Kingdom almost 27% of paid employees worked more than 45 hours per week, which is more than twice the overall Community average.
Table 5.7 contains a classification of actual hours worked for full-time paid employees according to duration cate gories. In this context it is necessary to have an addition al category relating to 'zero' hours and the relevant figures show that in 1987 some 5.5% of full-time paid employees with a job did not work at all in the survey reference week (for reasons of illness, holidays, etc.). With this type of concept (i. e. as distinct from usual working hours) it is only to be expected that one would find relatively smaller numbers working what one might describe as 'standard hours'. At overall Community level it will be noted that some 33% of paid employees actually worked 40 hours in the reference week, compared with
nearly 40% when formulated on the basis of usual work ing time.
The full range of tabulations included in the Community labour force survey report under the heading of working time involves various cross-classifications under the headings described in the preceding paragraphs. The full list of these tables is as follows:
Tables relating to working time
47 Persons in employment - average hours usually worked per week by sector of activity (hours)
48 Persons in employment - average hours actually worked during the reference week by sector of activity (hours)
49 Persons in full-time employment - groups of hours usually worked per week (%)
50 Persons in full-time employment - groups of hours actually worked during the reference week (%) 51 Persons in part-time employment - groups of hours
usually worked per week (%)
52 Persons in part-time employment - groups of hours actually worked during the reference week (%) 53 Persons in full-time/part-time employment - differ
ences between usual and actual hours (1 000)
55 Employees working full-time - average hours usually worked per week by economic activity (hours)
56 Employees working part-time - average hours usually worked per week by economic activity (hours) 57 Employees in industry working full-time - groups of
hours usually worked per week by economic activity (%)
58 Employees in services working full-time - groups of hours usually worked per week by economic activity (%)
59 Employees in industry and services working part-time - groups of hours usually worked per week (%) 60 Persons working full-time - detailed groups of hours
actually worked during the reference week (%)
61 Employees working full-time - detailed groups of hours actually worked during the reference week (%) Unemployment and search for work
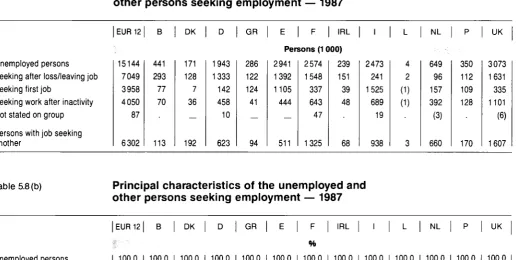
The final section of the annual Community labour force survey report is concerned with unemployment and search for work. Clearly analyses relating to search for work are important in the context of the unemployed but it should be noted that some of these tabulations extend further in the sense that they present information on those who are in employment but who are seeking work (in the form of an additional or alternative job). Thus, in effect, the assessment covers the phenomenon of job search in the context of the labour force as a whole.
Table 5.8(a)
Principal characteristics of the unemployed and
other persons seeking employment — 1987
Unemployed persons Seeking after loss/leaving job Seeking first job
Seeking work after inactivity Not stated on group
Persons with job seeking another
EUR 12 DK GR IRL
Persons (1 000)
NL UK
15144 7049 3958 4050 87 6302 441 293 77 70 113 171 128 7 36
—
192 1943 1333 142 458 10 623 286 122 124 41—
94 2941 1392 1105 444—
511 2574 1548 337 643 47 1325 239 151 39 48 68 2473 241 1525 689 19 938 4 2 (1) (1) 3 649 96 157 392 (3) 660 350 112 109 128 170 3073 1631 335 1101 (6) 1607Table 5.8(b)
Principal characteristics of the unemployed and
other persons seeking employment — 1987
Unemployed persons Seeking after loss/leaving job Seeking first job
Seeking work after inactivity Not stated on group
EUR 12 Β DK GR F IRL NL UK
100.0 46.5 26.1 26.7 0.6 100.0 66.6 17.5 15.9 100.0 75.0 4.2 20.8 100.0 68.6 7.3 23.6 0.5 100.0 42.6 43.1 14.3 100.0 47.3 37.6 15.1 100.0 60.1 13.1 25.0 1.8 100.0 63.1 16.2 20.1 100.0 9.7 61.7 27.8 0.8 100.0 44.1 (26.1) (27.4) 100.0 14.9 24.3 60.4 (0.4) 100.0 31.9 31.3 36.6 100.0 53.1 10.9 35.8 (0.1)
Basic information on these aspects is given in Tables 5.8 (a) and 5.8 (b). The tables show that of the 15.1 million persons who were classified as unemployed in 1987, some 7 million (nearly 47%) were seeking work, having lost or left a previous job, almost 4 million (just over a quarter) were seeking their first job after leaving the educational system, while just over 4 million (27%) were looking for a job after a period outside the labour force. The majority in the last group were women.
The emphasis with regard to the three abovementioned groups varies significantly between countries. The figures show a preponderance of first job seekers among the unemployed in Italy , Greece and Spain (62, 43 and 38% respectively) while in Denmark and Germany less than 10% of the totality of unemployed fell into this cat egory.
Table 5.8 (a) also shows that at overall Community level there were in 1987 6.3 million persons in employment who were seeking additional or alternative jobs. This figure represents 5% of the total number of persons at work in that year.
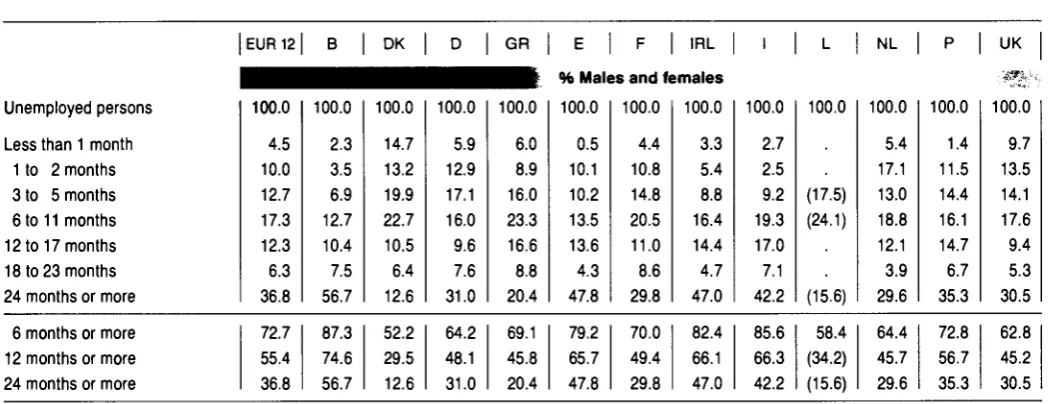
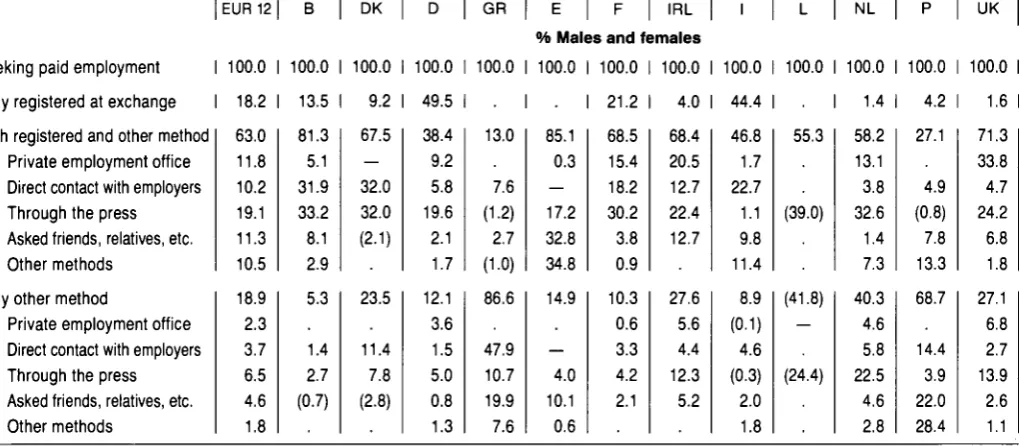
Apart from what might be regarded as standard categori zations such as those relating to sex or age, this section of the Community labour force survey report contains classifications of unemployment and work search in terms of (a) the relationship of the respondent to the head of the household in which he/she is resident; (b) duration of work search; and (c) the principal methods used in carrying out this search. Tables 5.9 to 5.11 provide an illustration of the information available under each of these headings.
[image:26.595.39.556.230.490.2]Figure
Related documents
Other data were also used to inform teacher interviews; these data were derived from a student questionnaire, follow-up structured student interviews,
edge, no social accounting matrix ( SAM ) constructed for Egypt, to date, has provided such detailed representation of agricultural activities and factors across irrigation
Private placements of straight non-bank debt by publicly traded firms elicit a positive stock price reaction on average, consistent with a market perception that they confer
• Focus on the governance of political and social participation, providing an analysis of the main trade-offs to identify successful models of involvement and consultation, as well
If the grid voltage is permanently within the permissible range and this message is still displayed, contact the Service (see Section 11, page 30 )..
continued readiness for a deployment are significant stressors that can cause poor health practices, thus decreasing psychological well-being and possibly increasing depression
Pathein-Myaungmya Karen Baptist Association Office Building Construction Project The construction project for the Pathein-Myaungmya Karen Baptist Association office building
HP 816 Certifi cate in Growth and Development Through the Life Span Th is certifi cate program is designed to enhance the knowledge and skills of nurses and health care
