City, University of London Institutional Repository
Citation
:
Chatterjee, S. ORCID: 0000-0002-7735-6123 and Kyriacou, P. A. (2019).
Estimating the Dependence of Differential Pathlength Factor on Blood Volume and Oxygen
Saturation using Monte Carlo method. 2019 41st Annual International Conference of the
IEEE Engineering in Medicine and Biology Society (EMBC), pp. 75-78. doi:
10.1109/embc.2019.8856437
This is the accepted version of the paper.
This version of the publication may differ from the final published
version.
Permanent repository link:
http://openaccess.city.ac.uk/id/eprint/23012/
Link to published version
:
http://dx.doi.org/10.1109/embc.2019.8856437
Copyright and reuse:
City Research Online aims to make research
outputs of City, University of London available to a wider audience.
Copyright and Moral Rights remain with the author(s) and/or copyright
holders. URLs from City Research Online may be freely distributed and
linked to.
Estimating the Dependence of Differential Pathlength Factor on Blood
Volume and Oxygen Saturation using Monte Carlo method
Subhasri Chatterjee
1and Panayiotis A. Kyriacou
1Abstract— Differential Pathlength Factor (DPF) is a vital parameter for the Beer-Lambert law based calculations in estimating tissue perfusion using non-invasive optical tech-niques. A significant error in the measured concentration of oxyhemoglobin and deoxyhemoglobin has been reported due to the usage of wrong DPF values. The dependence of DPF on blood oxygen saturation and blood volume has never been studied earlier. In this work, a Monte Carlo model of perfused skin tissue was developed and executed at 660 nm and 940 nm optical wavelengths at a reflectance geometry. DPFs were simulated through 1-10 mm source detector separations at different blood volumes and oxygen saturations. Results showed higher DPFs at lower wavelengths and considerable variation with blood volume and oxygen saturation.
I. INTRODUCTION
The clinical assessment of tissue perfusion relies on the technique of illuminating the tissue by near infrared optical wavelengths (∼ 650 nm - 950 nm), and analysing the ac-quired optical signal by the use of the modified Beer-Lambert law [1]. The modified Beer-Lambert law describes the mi-gration of photons through a highly scattering and absorbing medium such as biological tissue [2]. This law relates the absorbance (A) of the optical radiation (with wavelength λ) to the optical properties of the tissue (attenuation coefficient,
µ and optical pathlegnth,l) by a multiplicative term called the Differential Pathlength Factor (DPF):
A(λ) =µ(λ)·l(λ)·DP F(λ) (1) Differential pathlength factor plays a pivotal role in assess-ing tissue perfusion by estimatassess-ing the concentration change in blood oxyhaemoglobin and deoxyhaemoglobin from the diffused light signal from tissue. A number of research works have been carried out previously to evaluate the dependence of DPF on tissue location, sensor geometry, optical wavelength and age [3], [4], [5], [6]. Recent studies have also identified a variation in DPF between larger and smaller source-detector separations, typically used in non-invasive applications such as Near-Infrared Spectroscopy (NIRS) and Photoplethysmography (PPG), respectively [7]. The importance of an accurate DPF assessment for a specific application has been demonstrated in previous works that have shown significant cross-talk errors in the measured concentration of oxyhaemoglobin and deoxyhaemoglobin for an inaccuracy in the DPF value [9], [10], [11].
1Subhasri Chatterjee is with the Research Centre for Biomedical
Engineering, City, University of London, UK, EC1V0HB. [email protected]
1Panayiotis A. Kyriacou is with the Research Centre for
Biomedical Engineering, City, University of London, UK, EC1V0HB. [email protected]
The Differential pathlength factor is quantified as the ratio between the physical and geometrical optical pathlength through a tissue medium [8]. The dependence of the op-tical pathlength through a perfused tissue volume on the physiological parameters such as blood volume and blood oxygen saturation has already been demonstrated in our earlier studies [12]. DPF is directly related to the optical path, therefore, should vary with the physiological properties as well. However, the relationship between the DPF and changing physiological parameters have never been studied before. The present work is aims to investigate the rela-tionship between the DPF and two physiological parameters (blood volume and blood oxygen saturation) at two near infrared wavelengths (i.e., 660 nm and 940 nm) through a volume of perfused skin tissue.
Monte Carlo (MC) is a stochastic procedure that simulates the propagation of light through a complex medium such as biological tissue [15]. MC has been accepted as a reliable and flexible tool for investigating various problems related to tissue optics which are difficult to solve using other approaches (e.g., diffusion approximation or electromagnetic theory based formalisms) [14]. In the present work, a Monte Carlo method based perfused skin (dermis) tissue is explored at an optimal geometry similar to a dual wavelength re-flectance PPG sensor for analysing the differential optical pathlengths. Such a study is crucial for developing the fun-damental knowledge on PPG DPF which could lead to more accurate assessment of tissue perfusion and oxygenation.
II. METHODOLOGY
A. Tissue characterisation
The tissue layer was presented by a slab of infinite di-mensions. The slab geometry was chosen because the spatial dimension of the photon distribution was much smaller than the width of tissue. The tissue-slab was presented in a three-dimensional Cartesian co-ordinate system (x,y,z). The optical source S was placed on the tissue surface (z = 0) having its centre on the origin (0,0,0), as shown in Figure 1. The tissue was characterised by its optical properties, e.g.,
µa, µs, and g. The volumetric contribution of the optical
properties were considered, i.e., the ‘perfused’ tissue layer was assumed to be a homogeneous mixture of skin-dermis and blood (comprising the main absorbers: oxyhaemoglobin and deoxyhaemoglobin). The effective optical properties incorporated the volumetric contributions from the tissue-components. The total absorption coefficient µa of a layer
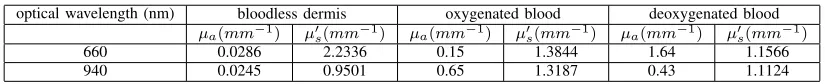
TABLE I
OPTICAL PROPERTIES OF SIMULATED COMPONENTS OF DERMIS.
optical wavelength (nm) bloodless dermis oxygenated blood deoxygenated blood µa(mm−1) µ0
s(mm−1) µa(mm−1) µ0s(mm−1) µa(mm−1) µ0s(mm−1)
660 0.0286 2.2336 0.15 1.3844 1.64 1.1566
940 0.0245 0.9501 0.65 1.3187 0.43 1.1124
in the arterial, venous and capillary blood) was written as the sum of the individual absorption coefficients of the components [15]:
µa = (1−V)·µab+V.[StO2µaHbO2+(1−StO2)µaHb] (2)
where µab is the absorption coefficient of the bloodless
dermis, µaHbO2 andµaHb are the absorption coefficients of
oxygenated and deoxygenated blood respectively having a haematocrit (Hct) of 45%. The total oxygen saturationStO2
was given by,
StO2=
[HbO2]
[Hb] + [HbO2], (3)
where [HbO2] and [Hb] were the concentrations of
oxy-haemoglobin and deoxyoxy-haemoglobin, respectively in the total blood volume, i.e., all blood found in the arterial, capillary and venous blood compartments. The baseline skin
absorp-Fig. 1. The schematic representation of the tissue volume in a 3D Cartesian co-ordinate system (x,y,z) with the source S at the origin and the detector D place at a distancedon the tissue surface.
tion coefficient (i.e., the co-efficient for bloodless skin) at wavelengthλwas expressed (in the unit ofmm−1) as [16]:
µab = 0.244 + 85.3·e
−λ−154
66.2 (4)
The reduced scattering coefficient of bloodless dermis was estimated from the contribution of dermis collagen fibres as given by [16]:
µ0s
b = (2×10
4)λ−1.5+ (2×10¹¹)λ−4. (5)
The values of the absorption and reduced scattering coef-ficient at 660 nm and 940 nm for skin dermis (calculated using above equation), and for the oxygenated and deoxy-genated blood (adapted from [17]) are given in Table 1. The anisotropy factor value for the perfused skin tissue was considered to be g = 0.95 at both wavelengths, and the refractive index of the tissue layer was considered to be
n= 1.
B. Monte Carlo method
The light propagation through the skin tissue layers was simulated using the following steps:
1) A photon packet with initial weight(w= 1), position co-ordinates(x, y, z)and direction (scattering angle= θ, azimuth=φ) were supposed to be incident from the source placed on the surface of the tissue (at the origin of the Cartesian co-ordinate system).
2) The path of the photon packet was simulated by tracing photons steps through the medium, determined by random sampling of the probability distribution
p(s) for the photons free pathlength(s)between two consecutive scattering events, which was given by
p(s) =µs.exp(−µs.s) (6)
The step size s of a photon packet was calculated as:
s=−ln(ξ)
µs
(7) 3) While the photon stayed within the medium, it un-derwent scattering and absorption at that interaction site. Once the step-size was determined, scattering was achieved by orienting the photon direction through two randomly generated angles, zenith (θ) and azimuth
(φ), given by:
cosθ= 1 2g
h
1 +g2− 1−g
2
1−g+ 2gξ
i
(8)
φ= 2πξ (9)
The scattering angle was calculated using the Henyey-Greenstein phase function, which has been experi-mentally proven to describe the single scattering in biological tissue very well. The azimuth was chosen randomly within the maximum value of 2π. After scattering corrections, a fraction of photon weight
∆w= µa
µa+µs.w was absorbed in the medium.
4) If the step size of the photon packet was long enough so that it hit the boundary, it would undergo either reflection or transmission. The photon would terminate if its weight dropped below a threshold.
5) If the photon was transmitted, the detected photons were scored. The detector was basically simulated as a sliding window of a width equal to the detector diameter (0.1 mm). The distance of the point of exit of the photon on tissue surface (on z = 0) from the origin was calculated from its position co-ordinates:
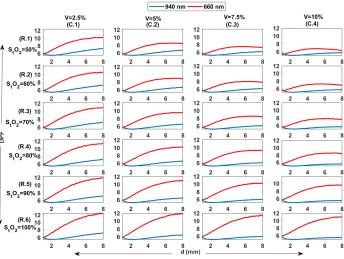
[image:3.612.100.513.77.119.2]Fig. 2. Differential Pathlength Factor is estimated in monolayer perfused skin dermis. DPFs in red (660 nm) and infrared (940 nm) are evaluated at source-detector separations 1-10 mm. Results for different blood volumes (Vb= 2.5%,5%,7.5%,10%) are presented in the columns C.1-C.4, and that for different total oxygen saturations (StO2= 50−100%) are presented in the rows R.1-R.6.
The optical path associated with the detected photon was recorded. DPF was calculated from the mean optical path (l) of the detected photon packets at wavelength λfor the source-detector separationd:
DP Fλd=
lλ
d. (11)
III. RESULTS ANDDISCUSSION
Simulation was repeated for detecting a 1010 number of photon packets through the range source-detector separations
1−10mm. The smaller source detector separation(<1cm)
usually is used for monitoring the oxygen saturation of the peripheral arterial blood, especially in photoplethysmogra-phy. Through the source-detector separations within PPG region (1< d(mm) <10), the DPF in the perfused skin was evaluated for a range of total oxygen saturation (StO2= 50−100%) and blood volume (Vb= 2.5%,5%,7.5%,10%).
The results are demonstrated in Figure 2. A significant vari-ation was observed between the DPFs at two wavelengths. The values of DPF was found to be changing with the blood volume as well as blood oxygen saturation.
For a clearer observation, DPFs for a fixed blood volume
Vb = 10% for different oxygen saturations, i.e., StO2 = 50%,60%,70%,80%,90% as a function of source-detector separations are presented in Figure 3. DPF at 660 nm was shown to increase slowly with increasing d but the rate of increase gradually decreased. A considerable increase in DPF at lower wavelengths with higher oxygen saturation was no-ticed. The DPF at higher wavelength, on the other hand, did not change considerably with blood oxygen saturation and
Fig. 3. Differential Pathlength Factor in perfused dermis at a fixedVb= 10%for different oxygen saturationsStO2= 50%,60%,70%,80%,90%. All plots are shown in the same axes limits.
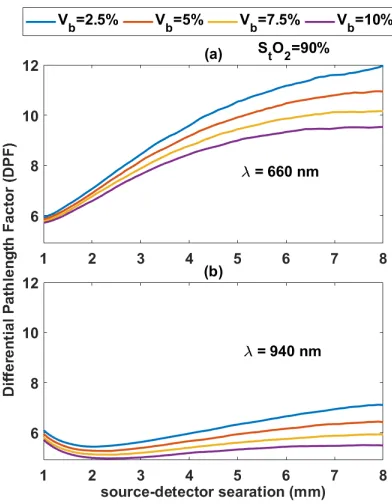
slightly varied with increasing source-detector separation. Also, DPF values at a fixedStO2= 90%for different blood
volumes, i.e,Vb=2.5%, 5%, 7.5%, 10% are shown in Figure
[image:4.612.318.555.367.581.2]Fig. 4. Differential Pathlength Factor in monolayer perfused skin dermis at a fixed StO2 = 90% for different blood volume Vb =
2.5%,5%,7.5%,10%are shown for red (660 nm) in (a) and for infrared (940 nm) in (b). All plots are shown in the same axes limits.
The results presented in Figures 2, 3 and 4 elucidate the dependence of DPF on several factors, e.g., source-detector separation, optical wavelength, physiological states such as blood volume and oxygen saturation of tissue etc. Therefore, for any further application, it is crucial to asses the DPF in the specific geometry for the specific tissue sample at a certain wavelength rather than any crude approximation. The dependence of DPF on the external factors such as the geo-metrical setting or the physiological states are more clearly visible in the red wavelength. Relatively lesser changes in the infrared wavelength is consistent with the previous ob-servation by [18] where it was stated the DPF is independent of the source-detector separation at the infrared wavelength region. For PPG applications where lower wavelengths play an important role, a careful assessment is imperative.
IV. CONCLUSION
A robust Monte Carlo model of perfused skin was ex-ecuted at near infrared optical wavelengths to analyse the relationship between differential pathlength factor and the physiological parameters such as blood volume and total (arterial, venous and capillary) blood oxygen saturation. A simplistic model was implemented for quantifying the indi-vidual effect of skin perfusion and oxygenation on the DPF. Considerable wavelength dependent deviation was found in the DPF values. With increasing blood volume, DPF was found to decrease whereas with increasing oxygen saturation, DPF was found to increase. Such variations were more no-ticeable for lower wavelength. All the information regarding
the DPF presented in this paper are immensely important for accurate assessment of the tissue perfusion employing the Beer-Lambert law based derivations.
REFERENCES
[1] Kocsis, L., Herman, P. and Eke, A., The modified BeerLambert law revisited. Physics in Medicine & Biology, 51(5), 2006, p.N91. [2] Kamran, M.A., Mannan, N., Muhammad, M. and Jeong, M.Y.,
Dif-ferential path-length factor’s effect on the characterization of brains hemodynamic response function: a functional near-infrared study. Frontiers in neuroinformatics, 12, 2018, p.37.
[3] Essenpreis, M., Cope, M., Elwell, C.E., Arridge, S.R., Van der Zee, P. and Delpy, D.T., Wavelength dependence of the differential pathlength factor and the log slope in time-resolved tissue spectroscopy. In Optical Imaging of Brain Function and Metabolism (pp. 9-20). Springer, Boston, MA, 1993.
[4] Kohl, M., Nolte, C., Heekeren, H.R., Horst, S., Scholz, U., Obrig, H. and Villringer, A., Determination of the wavelength dependence of the differential pathlength factor from near-infrared pulse signals. Physics in Medicine&Biology, 43(6), 1998, p.1771.
[5] Scholkmann, F. and Wolf, M., General equation for the differential pathlength factor of the frontal human head depending on wavelength and age. Journal of biomedical optics, 18(10), 2013, p.105004. [6] Piao, D.D., Barbour, R., Graber, H. and Lee, D., How does the
dif-ferential pathlength factor for steady-state near-infrared spectroscopy of homogeneous medium vary with geometry? In Optical Trapping Applications (pp. JT3A-45), Optical Society of America, 2015. [7] Chatterjee, S., Abay, T.Y., Phillips, J.P. and Kyriacou, P.A.,
Inves-tigating optical path and differential pathlength factor in reflectance photoplethysmography for the assessment of perfusion. Journal of biomedical optics, 23(7), 2018, p.075005.
[8] Hiraoka, M., Firbank, M., Essenpreis, M., Cope, M., Arridge, S.R., Van Der Zee, P. and Delpy, D.T., A Monte Carlo investigation of optical pathlength in inhomogeneous tissue and its application to near-infrared spectroscopy. Physics in Medicine&Biology, 38(12), 1993, p.1859.
[9] Boas, D.A., Gaudette, T., Strangman, G., Cheng, X., Marota, J.J. and Mandeville, J.B., The accuracy of near infrared spectroscopy and imaging during focal changes in cerebral hemodynamics. Neuroimage, 13(1), 2001, pp.76-90.
[10] Talukdar, T., Diamond, S.G. and Moore, J.H., Continuous correction of differential path length factor in near-infrared spectroscopy. Journal of biomedical optics, 18(5), 2013, p.056001.
[11] Uluda, K., Steinbrink, J., Villringer, A. and Obrig, H., Separability and cross talk: optimizing dual wavelength combinations for near-infrared spectroscopy of the adult head. Neuroimage, 22(2), 2004, pp.583-589. [12] Chatterjee, S., Phillips, J.P. and Kyriacou, P.A., Monte Carlo investi-gation of the effect of blood volume and oxygen saturation on optical path in reflectance pulse oximetry. Biomedical Physics&Engineering Express, 2(6), 2016, p.065018.
[13] Tuchin, V.V., Utz, S.R. and Yaroslavsky, I.V., Tissue optics, light distribution, and spectroscopy. Optical Engineering, 33(10), 1994, pp.3178-3189.
[14] Zhu, C. and Liu, Q., Review of Monte Carlo modeling of light trans-port in tissues. Journal of biomedical optics, 18(5), 2013, p.050902. [15] Schmitt, J.M.,. Simple photon diffusion analysis of the effects of
mul-tiple scattering on pulse oximetry. IEEE Transactions on Biomedical Engineering, 38(12), 1991, pp.1194-1203.
[16] Jacques, S.L., Sterenborg, H.J. and Star, W.M., Skin optics. IEEE transactions on bio-medical engineering, 36(12), 1989, pp.1146-1154. [17] Bosschaart, N., Edelman, G.J., Aalders, M.C., van Leeuwen, T.G. and Faber, D.J., A literature review and novel theoretical approach on the optical properties of whole blood. Lasers in medical science, 29(2), 2014, pp.453-479.