Int. J. Electrochem. Sci., 10 (2015) 7671 - 7683
International Journal of
ELECTROCHEMICAL
SCIENCE
www.electrochemsci.org
One-step Fabrication of a New Carbon Paste Electrode for
Dopamine, Ascorbic acid and Uric acid determination in Serum
Ying Li1, Lin-hsiang Huang1, Shen-Ming Chen1,*, Bih-Show Lou2,*, Xiaoheng Liu3*
1
Department of Chemical Engineering and Biotechnology, National Taipei University of Technology, No.1, Section 3, Chung-Hsiao East Road, Taipei 106, Taiwan (R.O.C).
2
Chemistry Division, Center for General Education, Chang Gung University, No.259, Wenhua 1st Rd., Kwei-Shan, Tao-Yuan 333, Taiwan (R.O.C.)
3
Key Laboratory of Education Ministry for Soft Chemistry and Functional Materials, Nanjing University of Science and Technology, Nanjing 210094, China.
*
E-mail: [email protected]; [email protected]; [email protected]
Received: 19 May 2015 / Accepted: 27 June 2015 / Published: 28 July 2015
The carbon paste electrode is electrocatalytically active for dopamine, ascorbic acid and uric acid oxidation. The electrocatalytic oxidation current is developed from the anodic peak of the redox couple. Electrochemical impedance spectroscopy is applied to monitor the entire electrode modification process and supplies useful information as to the impedance changes on the electrode surface between each step. The surface morphology of the composite film is using scanning electron microscopy and atomic force microscopy, and cyclic voltammetry is used to measure the electroanalytical properties of the analytes. The sensitivity values of the carbon paste electrode are higher than those of the bare electrode. Finally, differential pulse voltammetry is used to detect the mixture of analytes at the carbon paste electrode. We simulate a more complex system when dopamine, ascorbic acid and uric acid are present simultaneously. The peak currents for the analyte mixture increased linearly with the analyte concentration. The detection limit of the carbon paste-modified electrode for ascorbic acid, dopamine and uric acid was 8.3 10-6 M, 1.5 10-6 M and 1.6
10-6 M, respectively.
Keywords: Carbon paste, dopamine (DA), ascorbic acid (AA), uric acid (UA), biosensor
1. INTRODUCTION
regeneration of the electrode surface aside, mechanical strength in the presence of non-aqueous solvents, generation of non-toxic residues, stable response, low ohmic resistance, the potential to incorporate specific modifiers, uniform distribution of the catalyst into the paste, adequate robustness in aqueous solutions [3] and the enhancing of electrode reactivity are some of the advantages of using CPEs [4]. The simple and economical fabrication of an easy-to-use biosensor with high electroanalytical performance as regards analyte detection is an attractive area in bioelectroanalysis [5-9]. However, it is important to investigate the toxic effect of CP and its derivatives on biological entities, such as mammalian cells and animals. Biocompatibility is an essential requirement for the materials employed in biological systems [10, 11]. CP is a mixture of carbon powder and a suitable liquid binder and represents the most flexible substrate for a wide variety of chemical and biological modifications. The CPE is useful for estimating the analytical performance of the developed biosensor. CPEs have been used for potentiometric and voltammetric determination of various cations, anions, organic and pharmaceutical species [12-15].
Dopamine (DA) is one of the most important neurotransmitters of the catecholamines which are widely distributed in the mammalian central nervous system for message transfer [16-20]. DA plays a very important role in the functioning of the central nervous, renal, hormonal and cardiovascular systems, and a deficiency can lead to brain disorders, such as Parkinson’s disease and schizophrenia [21, 22]. Thus, detecting and determining the concentrations of DA and its metabolites in the presence of interfering species is an important goal in bioelectrochemical analysis. L(+)-ascorbic acid (AA, vitamin C) is the main antioxidant found in both animals and plants. AA is a water-soluble vitamin that takes part in many important life processes and, consequently, it is widely used in foods, beverages and pharmaceutical products [23-26]. For humans, AA is an essential nutrient due to its participation in several metabolic reactions, and it is used in the prevention and treatment of scurvy, the common cold, mental illness, hepatic disease and cancer [27, 28]. Uric acid (UA) and other oxypurines are the main final products of purine metabolism in the human body [29]. The determination of UA in urine is of great importance in medical diagnosis. For example, leucocythemia, hepatitis and gout can cause an increase in the concentration of UA in urine [30]. The simultaneous detection of DA, AA and UA is of critical importance, not only in the field of biomedical chemistry and neurochemistry, but also for diagnostic and pathological research [31, 32]. Measurements at bare electrodes are complicated due to the coexistence of high concentrations of AA and other related species, which are oxidized in the same potential region [33]. UA also attenuates the detection of neuromolecules, such as DA. At bare electrodes, the selective determination of AA, DA and UA is impossible because their oxidation potentials are very close. Besides, stability and reproducibility cannot be achieved at bare electrodes due to the surface fouling caused by the adsorption of oxidized products of AA on the electrode surface.
fabrication, wide potential range for analysis, an easily renewable surface (unlike conventional electrodes) [40], high sensitivity, good selectivity, low cost, fast response and suitability for online analysis [41-43]. In this work, we used the CPE for the detection of DA, AA and UA, as the CP modification improved the selectivity and sensitivity of the bioelectrochemical measurements of the target analyte from a dilute solution on the electrode surface.
2. EXPERIMENTAL PROCEDURE
2.1. Materials
Carbon paste (Hopax CCB-S6-10%) was used as received. Dopamine (DA), ascorbic acid (AA) and uric acid (UA) were obtained from Sigma (St. Loius, MO, USA). Indium tin oxide (ITO) (7 /cm-2
) was purchased from Merck Display Technologies (MDT) Ltd. (Taiwan). Serum biochemical samples from professor Lou’s Lab (Chang Gung University), blood were placed at room temperature for 1 h, and then centrifuged at 1000g for 10 min to obtain serum. Aqueous solutions were prepared using double-distilled deionized water by purging with high purity nitrogen gas for approximately 20 min prior to performing the electrochemical experiments. All other chemicals used were of analytical grade and used without further purification, pH 7.0 Phosphate-buffered saline (PBS) was used as the supporting electrolyte. In addition, a continuous flow of nitrogen over the aqueous solution was maintained during the measurements.
2.2. Apparatus
Cyclic voltammetry (CV) and differential pulse voltammetry (DPV) had been used to investigate the electrochemical behavior using the model CHI-1205B and CHI-900 potentiostat. A conventional three-electrode cell assembly, consisting of reference electrode (Ag/AgCl) and counter electrode (Pt wire), was used for the electrochemical workstation. The working electrode was a glassy carbon electrode (GCE; area 0.07 cm2). The potentials were reported versus those of the Ag/AgCl reference electrode. The morphology of obtained electrode was studied by scanning electron microscopy (SEM) (Hitachi S-3000H) and atomic force microscopy (AFM) (Being Nano-Instruments CSPM5000). Electrochemical impedance spectroscopy (EIS) measurements were performed using an IM6ex Zahner instrument (Kroanch, Germany). All experiments were performed at room temperature ( 25 C).
2.3. Preparation of carbon paste
homogeneous dispersion. The cleaned glassy carbon electrode was coated with 2 µL of carbon paste and the solvent was allowed to evaporate at room temperature.
3. RESULTS AND DISCUSSION
3.1 Optimization of the experimental conditions
To investigate the effect of the solvents on the stability of the CP electrode coating, a series of mixtures with different ratios was prepared. The produced CP was suspended in ethanol mixtures of 1:1, 2:1, 5:1, 10:1 and 1:20 (v/v) and a sonication bath for 2 h. The cleaned ITO was coated with 2 µL of CP and the solvent allowed to evaporate at room temperature. A comparison was then made of the different ratios of ethanol mixtures as prepared in order to determine which exhibited better dispersion. The CP with ethanol ratios of 2:1, 5:1 and 10:1 (v/v) contained aggregates and exhibited thick surfaces on the electrode. In contrast, the CP with ethanol ratios of 1:1 and 1:20 (v/v) was well-dispersed and smooth. For the stability study, we flushed the CP-modified electrode with flowing water. The CP with an ethanol ratio of 1:20 (v/v) showed the best dispersion and stability.
A CP modified with multi-walled carbon nanotubes (MWCNTs) or graphene has been investigated for detecting biological samples [43, 44]. We attempted to add MWCNTs to the CP (ethanol mixture 1:20). The produced CP was suspended with 10 mg/mL MWCNTs in a sonication bath for 2 h. The CP and CP-MWCNT dispersions were dropped in 2 µL aliquots onto the GCE surfaces. Each newly-prepared modified electrode was transferred to pH 7.0 PBS containing 1×10⁻³ M DA for electrochemical characterization. These optimized pH 7.0 solutions were chosen to improve stability. CV was performed at a 50 mV s-1 scan rate in the potential range of -0.2 to 0.8 V, and a comparison was made of the cyclic voltammograms collected from the CP- and CP-MWCNT-modified electrodes. The CP- and CP-MWCNT-CP-MWCNT-modified electrodes exhibited a peak-to-peak separation of 148 mV and 380 mV, respectively. The solid state of the MWCNTs contributed to the increased peak potential separation current value. Our results revealed that pure CP resulted in superior stability and dispersion as compared with the other evaluated samples; the CP with an ethanol ratio of 1:20 (v/v) was, therefore, selected for further optimization in the subsequent experiments.
3.2. Morphological characterization of CP
Figs. 1(A) and (B) show the top view of the SEM images of different films coated on ITO surfaces taken at a specific resolution. Prior to modification, the ITO surfaces were cleaned and ultrasonicated in an acetone–water mixture for 15 min and then dried. Subsequently, the CP and CP-MWCNTs were prepared on the ITO electrode. As shown in Figs. 1, there were significant morphological differences among the films. The top view in (A) of the ITO electrode surface revealed a uniform coverage of CP on the electrode. The CP-MWCNTs in (B) displayed a CP coating over the entire MWCNT surface.
the ITO surface by AFM. The roughness average (sa), an expression of the surface roughness or texture that is typically used to describe a polished or machined metal surface and the arithmetic average value of the departure (peaks and valleys) of the surface profile from the center-line through the sampling length. The surface areas of AFM images were collected over 5000 × 5000 nm. As shown in Figs. 1(C) and (D), there were morphological differences among the films. The top views of the nanostructures (C) revealed uniformly deposited and homogeneously dispersed CP on the electrode. Nanostructures were present with an average height of 7.55 nm. The roughness average (sa) for the CP was 1.99 nm and the root mean square roughness was 2.51 nm. The total surface area was 25,201,458 (nm*nm). Fig. 1(D) shows an image of the CP-MWCNTs, which exhibited a roughness average (sa) and root mean square roughness of 1.99 nm and 2.72 nm, respectively, and an average height and total surface area of 19.53 nm and 25,363,043 (nm*nm), respectively.
[image:5.596.61.536.294.696.2]
Figure 2. (A) Electrochemical impedance spectroscopy (EIS) images of (a) bare GCE and (b) CP/GCE in pH 7.0 PBS containing 5 × 10⁻³ M [Fe(CN)6]-3/-4 (Amplitude: 5 mV); (B) cyclic
voltammograms of CP electrode at high scan rates of 100 mV s-1 to 1000 mV s-1 and (a) low scan rates of 5 mV s-1 to 100 mV s-1 in the presence of equimolar 5 mM [Fe(CN)6]3− in pH 7.0
PBS, respectively. Calibration curve of (b) Ipa & Ipc vs scan rate; and (C) cyclic
voltammograms of the CP electrode transferred to various pH solutions (a) 1; (b) 3; (c) 7; (d) 11; (e) 13 in the presence of equimolar 1 mM DA. The inset displays the formal E0’ vs pH.
3.3. Electrochemical impedance spectroscopy (EIS) analysis
Electrochemical impedance spectroscopy (EIS) was applied to monitor the whole process of the electrode modification. EIS can give useful information as to the impedance changes on the electrode surface between each step. Fig. 2(A) exhibits the Nyquist plots of the bare GCE and the CP-modified electrode in the presence of equimolar 5 mM [Fe(CN)6]3−/4−in pH 7.0 PBS. EIS includes a
semicircular part and a linear part. In this circuit, Rs, C and Rct represent solution resistance, a
capacitance for the double-layer and electron transfer resistance, respectively. Rct at the electrode
surface is equal to the semicircle diameter, which can be used to describe the interface properties of the electrode. The linear part at lower frequencies corresponds to the diffusion process. The semicircle of CP-modified electrode was smaller than that of bare GCE. The estimated Rct for CP-modified
[image:6.596.75.521.68.377.2]
indicate that the CP firmly modified the electrode surface. The inset shows the equivalent circuit (Randles model) used to fit the Nyquist diagrams. This circuit contains a distributed element which can only be approximated by an infinite series of simple electrical elements. The error values for the corresponding semicircles ranged from 5 to 7%. From these observations, we could conclude that the CP was highly conductive and so a good platform for sensing applications.
3.4. Different scan rate studies of CP
Fig. 2(B) shows cyclic voltammograms of CP on a glassy carbon electrode in the presence of equimolar 5 mM [Fe(CN)6]3− pH 7.0 PBS. It had one reversible redox couple at 0.22 V recorded at
different scan rates (100 to 1000 mV s-1). The low scan rates (5 to 100 mV s-1) are shown in inset (a). Our results indicated that there is a linear relationship between the peak currents and the scan rate. For sweep rates above 50 mV s-1, the peak separations begin to increase, indicating the limitation arising from charge transfer kinetics. The inset calibration curve for data in (b) displays Ipa & Ipc vs the scan
rate. It exhibited correlation coefficients R2 = 0.9962 and 0.9953. The ratio of Ipa/Ipc from the inset
demonstrated that the redox process was not controlled by diffusion. This behavior perhaps occurred because of a reversible electron transfer process involving the CP layer, with a proton exchange process occurring along with the electron transfer process. However, the ΔEp of each scan rate
revealed that the peak separation of the composite redox couple increased as the scan rate increased.
3.5. Different pH influence of composite films
In order to optimize the electrocatalytic response of oxidation, the effect of pH on the electrocatalytic oxidation was investigated. Fig. 2(C) displays the cyclic voltammetric results of CP on the electrode obtained in the various pH aqueous buffer solutions. The CP films were highly stable in the pH range of 1.0 to 13 in the presence of equimolar 1 mM DA. The values of Epa and Epc depend on
the pH value of the buffer solution. These results showed that the maximum electrocatalytic current was obtained at pH 70. Therefore, pH 7.0 was chosen as the optimum pH for the determination of DA. The inset in Fig. 2 displays the potential of CP plotted over a pH range of 1.0 to 13. The response slope of -53 mV/pH was close to the Nernstian equation for a transfer of an equal number of electrons and protons.
3.6. Electrocatalytic response of AA, DA and UA
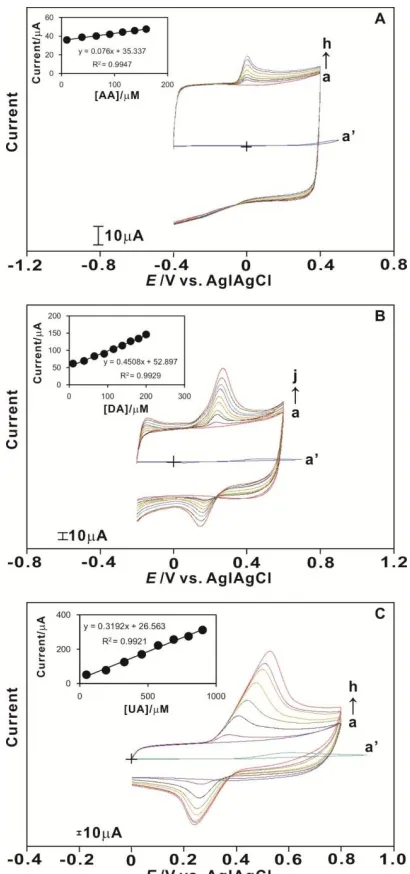
Figs. 3(A), (B) and (C) display the electrocatalytic oxidation of AA, DA and UA at the CP-modified electrode with a scan rate of 100 mV s-1. In all sections of Fig. 3, curve (a) is the CP-modified electrode in pH 7.0 PBS; and curve (a’) is the bare GCE at the highest concentration of analytes. The CVs for the CP-modified electrode exhibited a smooth background current in pH 7.0 PBS; on the addition of analytes, a new growth in the oxidation peak of the analytes appeared at Epa =
GCE at the highest concentration of analytes appeared at Epa = 0.5 V for AA, Epa = 0.48 V for DA and
Epa = 0.6 V for UA. Interestingly, the peak currents for AA, DA and UA increased linearly with the
[image:8.596.195.400.254.691.2]analyte concentration, which demonstrated that the calibration curves for the analyte were almost linear for a wide range of concentrations, as displayed in the inset. The detection limit of the CP-modified electrode for AA, DA and UA was 9.9 10-6 M, 9.9 10-6 M and 4.9 10-5 M, respectively, which covered the concentration range found in the physiological conditions. The slope of the linear range for AA, DA and UA was 9.9 10-6 M to 1.6 10-4 M, 9.9 10-6 M to 2.0 10-4 M and 4.9 10-5 M to 1.1 10-3 M, respectively; the sensitivity of the CP-modified electrode and the correlation coefficients are shown in the inset. It was obvious that the CP-modified electrode had higher electrocatalytic activity for AA, DA and UA than that of the bare GCE.
The results as observed from the Ipa and Epa values were that the increase in peak current and
lower overpotential could both be considered as electrocatalysis [47]. It was obvious that the sensitivity of the CP-modified electrode was higher for all analytes when compared with that of the bare GCE. Overall, the results clearly showed the efficiency of the CP-modified electrode in AA, DA and UA detection.
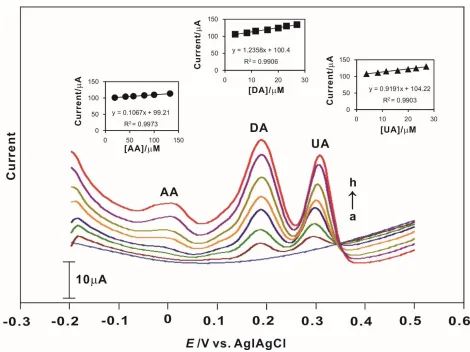
3.7. Differential pulse voltammetry (DPV) of the mixture analytes at the CP
The DPV values were recorded at a constant time interval of 2 min, with nitrogen purging performed prior to the start of each experiment. A more complex system was simulated with AA, DA and UA present simultaneously.
Figure 4. Differential pulse voltammograms (DPVs) of simultaneous changes in the concentrations of the analyte mixture accumulatively (AA 5.0 × 10⁻⁴ M with DA and UA 1.0 × 10⁻⁴ M, after each addition of 100 mL in 10 mL pH 7.0 PBS) at the CP-modified electrode. The inset displays the plot of current versus concentration of analytes.
[image:9.596.62.532.283.635.2][image:10.596.83.536.296.738.2]
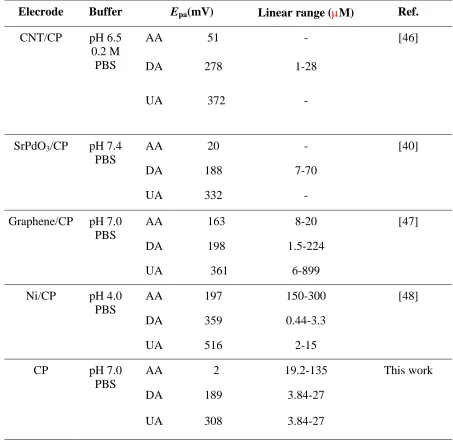
pH 7.0 PBS) at the CP-modified electrode. The peak currents for the analyte mixture increased linearly with the analyte concentration. The detection limit of the CP-modified electrode for AA, DA and UA was 8.3 10-6 M, 1.5 10-6 M and 1.6 10-6 M, respectively. The slopes of the linear range, which illustrate the sensitivity of the CP-modified electrode and the correlation coefficients, are shown in the inset. All these values showed the higher efficiency of the CP-modified electrode towards the analytes as compared with the bare GCE. The CP-modified electrode exhibited three well-separated electro-oxidation peaks for the detection of AA, DA and UA. The peak separation was sufficient for the selective determination of the mixture. The oxidation peak of DA shifted from 0.27 V to 0.19 V and that of UA from 0.44 V to 0.31 V. A comparison of the CP electrodes for the determination of AA, DA and UA is shown in Table 1.
Table 1. Comparison of CP electrodes for the determination of AA, DA and UA
Elecrode Buffer Epa(mV) Linear range (M) Ref.
CNT/CP pH 6.5 0.2 M PBS
AA 51 - [46]
DA 278 1-28
UA 372 -
SrPdO3/CP pH 7.4
PBS
AA 20 - [40]
DA 188 7-70
UA 332 -
Graphene/CP pH 7.0 PBS
AA 163 8-20 [47]
DA 198 1.5-224
UA 361 6-899
Ni/CP pH 4.0 PBS
AA 197 150-300 [48]
DA 359 0.44-3.3
UA 516 2-15
CP pH 7.0
PBS
AA 2 19.2-135 This work
DA 189 3.84-27
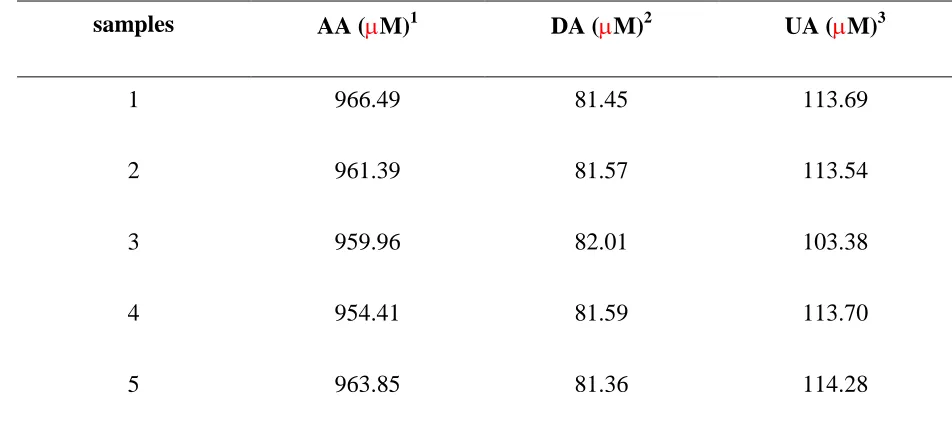
3.8. Serum biochemical analysis of AA, DA and UA
[image:11.596.79.555.286.502.2]We simulated more complex system using real samples. The electrocatalytic oxidation was examined at CP modified electrode with the potential range of −0.2 to 0.5 V by DPV. Blood were placed at room temperature for 1 h, and then centrifuged at 1000g for 10 min to obtain serum. The Table 2 displays oxidation peaks for the detection of AA, DA and UA. The experimental method of DPV with biosensor integrated into the CP modified electrode which are presented in this paper, provide an opportunity for qualitative and quantitative characterization, even at physiologically relevant conditions.
Table 2. DPV of electrocatalytical values obtained for serum determination in pH 7.0 Normal Saline (0.9%) at CP modified electrode
samples AA (M)1 DA (M)2 UA (M)3
1 966.49 81.45 113.69
2 961.39 81.57 113.54
3 959.96 82.01 103.38
4 954.41 81.59 113.70
5 963.85 81.36 114.28
Each samples was performed five times
1
Standard of AA intake 90 mg/day for adult
2Standard of DA 50 – 450 g/24 hr 3
Standard of UA 2.3-7.6 mg/dL
4. CONCLUSIONS
sensitivity and excellent stability of CP in biosensors. The SEM and AFM results provided the CP morphological data. Therefore, this work has established and illustrated, in principle and potential, a simple and novel approach for the development of a voltammetric biosensor based on CP electrodes. ACKNOWLEDGEMENT
This project was supported by the Ministry of Science and Technology, Taiwan through contracts NSC101-2113-M-027-001-MY3 to Chen and MOST103-2410-H-182-020 to Lou.
References
1. P. D. Schumacher, K. A. Fitzgerald, J. O. Schenk, S. B. Clark, Analytical Biochemistry, 83 (2011) 1388.
2. A. Doménech-Carbó, M. T. Doménech-Carbó, L. Osete-Cortina, J. V. Gimeno Adelantado, F. Bosch-Reig, R. Mateo-Castro, Talanta, 56 (2002) 161.
3. K. Kalcher, J. M. Kauffmnann, J. Wang, I. Svancara, K. Vytras, C. Neuhold, Z. Yang, Electroanalysis, 7 (1995) 5.
4. L. Gorton, Electroanalysis, 7 (1995) 23.
5. M. C. Teixeira, F. L. T. Elisângela de, A. S. Adelir, L. L. Okumura, M. G. Cardoso, Z. M. Magriotis, M. F. de Oliveira, Food Chemistry, 154 (2014) 38.
6. I. Svancara, A. Walcarius, K. Kalcher, K. Vytras, Central European Journal of Chemistry, 7 (2009) 598.
7. F. Ricci, A. Amine, D. Moscone, G. Palleschi, Analytical Letters, 36 (2003) 1921.
8. H. T. Liu, P. He, Z. Y. Li, C. Y. Sun, L. H. Shi, Y. Liu, G. Y. Zhu, J. H. Li, Electrochemistry Communications, 7 (2005) 1357.
9. B. Haghighi, M. Khosravi, A. Barati, Materials Science and Engineering C, 40 (2014) 204. 10. M. Behbahani, J. Abolhasani, M. M Amini, O. Sadeghi, F. Omidi, A. Bagheri, M. Salarian, Food
chemistry, 173 (2014) 1207.
11. M. Mahyari, A. Shaabani, M. Behbahani, A. Bagheri, Applied Organometallic Chemistry, 28 (2014) 576.
12. M. K. Bojdi, M. H. Mashhadizadeh, M. Behbahani, A. Farahani, S. S. H. Davarani, A. Bagheri, Electrochimica Acta, 136 (2014) 59.
13. H. Hosseini, M. Behbahani, M. Mahyari, H. Kazerooni, A. Bagheri, A. Shaabani, Biosensors and Bioelectronics, 59 (2014) 412.
14. M. K. Bojdi, M. Behbahani, A. Sahragard, B. G. Amin, A. Fakhari, A. Bagheri, Electrochimica Acta, 149 (2014) 108.
15. M. K. Bojdi, M. Behbahani, M. H. Mashhadizadeh, A. Bagheri, S. S. H. Davarani, Ali Farahani, Materials Science and Engineering: C, 48 (2015) 213.
16. N. F. Atta, A. Galal, F. M. Abu-Attia, S. M. Azab, Journal of The Electrochemical Society, 157 (2010) F116.
17. S. Thiagarajan, S. M. Chen, Talanta, 74 (2007) 212.
18. N. F. Atta, A. Galal, E. H. El-Ads, Electrochimica Acta, 69 (2012)102. 19. A. Galal, N. F. Atta, E. H. El-Ads, Talanta, 93 (2012) 264.
20. N. F. Atta, A. Galal, R. A. Ahmed, Bioelectrochemistry, 80 (2011) 132. 21. C. Martin, Chemische Berichte, 34 (1998) 40.
22. R. M. Wightman, L. J. May, A. C. Michael, Analytical Chemistry, 60 (1988) 769A. 23. P. A. Kilmartin, A. Martinez, P. N. Bartlett, Current Applied Physics, 8 (2008) 320. 24. S. Ivanov, V. Tsakova, V. M. Mirsky, Electrochemistry Communications, 8 (2006) 643. 25. D. Ragupathy, A. I. Gopalan, K. P. Lee, K. M. Manesh, Electrochemistry Communications, 10
26. A. G. Frenich, M. E. H. Torres, A. B. Vega, Journal of Agricultural and Food Chemistry, 53 (2005) 7371.
27. W. Shi, C. Liu, Y. Song, N. Lin, S. Zhou, X. Cai, Biosensors and Bioelectronics, 38 (2012) 100. 28. X. Zhang, Y. Cao, S. Yu, F. Yang, P. Xi, Biosensors and Bioelectronics, 44 (2013) 183.
29. S. H. Huang, Y. C. Shih, C. Y. Wu, C. J. Yuan, Y. S. Yang, Y. K. Li, T. K.Wu, Biosensors and Bioelectronics, 19 (2004) 1627.
30. J. B. He, G. P. Jin, Q. Z. Chen, Y. Wang., Analytica Chimica Acta, 585 (2007) 337. 31. X. Lin, Y. Zhang, W. Chen, P. Wu, Sensors and Actuators B, 122 (2007) 309.
32. A. Safavi, N. Maleki, O. Moradlou, F. Tajabadi, Analytical Biochemistry, 359 (2006) 224. 33. J. M. Zen, P. J. Chen, Analytical Chemistry, 69 (1997) 5087.
34. R. W. Murray, Introduction to Molecularly Designed Electrode Surfaces, Techniques of Chemistry, 22, John Wiley & Sons, New York, (1992) p271.
35. J. M. Lehn, Angewandte Chemie International Edition in English, 29 (1990) 1304. 36. E. A. Khudaish, A. A. Al Farsi, Talanta, 80 (2010) 1919.
37. S. Thiagarajan, R. F. Yang, S. M. Chen, Bioelectrochemistry, 75 (2009) 163.
38. S. Harish, J. Mathiyarasu, K. L. N. Phani, V. Yegnaraman, Journal of Applied Electrochemistry, 38 (2008) 1583.
39. N. F. Atta, S. M. Ali, E. H. El-Ads, A. Galal, Electrochimica Acta, 128 (2014) 16. 40. M. S. Lin, B. I. Jan, H. J. Leu, J. S. Lin, Analytica Chimica Acta, 388 (1999) 111. 41. A. Abbaci, N. Azzouz, Y. Bouznit, Applied Clay Science, 90 (2014) 130.
42. H. Bagheri, A. Afkhami, Y. Panahi, H. Khoshsafar, A. Shirzadmehr, Materials Science and Engineering C, 37 (2014) 264.
43. U. Waiwijit, W. Kandhavivorn, B. Oonkhanond, T. Lomas, D. Phokaratkula,A. Wisitsoraat, A. Tuantranont, Colloids and Surfaces B 113 (2014) 190.
44. M. Mohamadi, A. Mostafavi, M. Torkzadeh-Mahani, Biosensors and Bioelectronics, 54 (2014) 211.
45. C. P. Andrieux, O. Haas, J. M. SavGant, Journal of the American Chemical Society, 108 (1986) 8175.
46. J. G. Manjunatha, M. Deraman, N. H. Basri, N. S. M. Nor, I. A. Talib, N. Ataollahi, Comptes Rendus Chimie, 17 (2014) 465.
47. B. B. Yang, H. W. Wan, J. Du, Y. Z. Fu, P. Yang, Y. K. Du, Colloids and Surfaces A, 456 (2014) 146.
48. T. E. Mary Nancy, V. Anitha Kumary, Electrochimica Acta, 133 (2014) 233.

![Figure 2 . (A) Electrochemical impedance spectroscopy (EIS) images of (a) bare GCE and (b) CP/GCE in pH 7.0 PBS containing 5 × 10⁻³ M [Fe(CN)6]-3/-4 (Amplitude: 5 mV); (B) cyclic voltammograms of CP electrode at high scan rates of 100 mV s-1 to 1000 mV s-1](https://thumb-us.123doks.com/thumbv2/123dok_us/1890350.146634/6.596.75.521.68.377/figure-electrochemical-impedance-spectroscopy-containing-amplitude-voltammograms-electrode.webp)